| Param | Original file | Final file |
|---|---|---|
| Filename | modeM0/AS1G05_246T03_9000000516_04039cztM0_level2.evt | modeM0/AS1G05_246T03_9000000516_04039cztM0_level2_quad_clean.evt |
| Size (bytes) | 423,564,480 | 77,198,400 |
| Size | 403.9 MB | 73.6 MB |
| Events in quadrant A | 3,560,870 | 468,122 |
| Events in quadrant B | 3,020,593 | 485,681 |
| Events in quadrant C | 2,781,523 | 484,151 |
| Events in quadrant D | 3,036,452 | 460,104 |
| Mode M9 | |||
|---|---|---|---|
| Quadrant | BADHDUFLAG | Total packets | Discarded packets |
| A | 0 | 20 | 0 |
| B | 0 | 20 | 0 |
| C | 0 | 20 | 0 |
| D | 0 | 21 | 0 |
| Mode M0 | |||
|---|---|---|---|
| Quadrant | BADHDUFLAG | Total packets | Discarded packets |
| A | 0 | 14988 | 5 |
| B | 0 | 13357 | 6 |
| C | 0 | 12871 | 4 |
| D | 0 | 13802 | 10 |
| Mode SS | |||
|---|---|---|---|
| Quadrant | BADHDUFLAG | Total packets | Discarded packets |
| A | 0 | 128 | 0 |
| B | 0 | 128 | 0 |
| C | 0 | 128 | 0 |
| D | 0 | 128 | 0 |
| Quadrant | Total seconds | Saturated seconds | Saturation percentage |
|---|---|---|---|
| A | 6296 | 171 | 2.716010% |
| B | 6295 | 43 | 0.683082% |
| C | 6296 | 17 | 0.270013% |
| D | 6295 | 50 | 0.794281% |
Noise dominated data is calculated using 1-second bins in cleaned event files. If a bin has >2000 counts, and if more than 50% of those come from <1% of pixels, then it is considered to be noise-dominated and hence unusable.
| Quadrant | # 1 sec bins | Bins with >0 counts | Bins with >2000 counts | High rate bins dominated by noise | Noise dominated (total time) | Noise dominated (detector-on time) | Marked lightcurve |
|---|---|---|---|---|---|---|---|
| A | 7567 | 6298 | 87 | 87 | 1.15% | 1.38% | 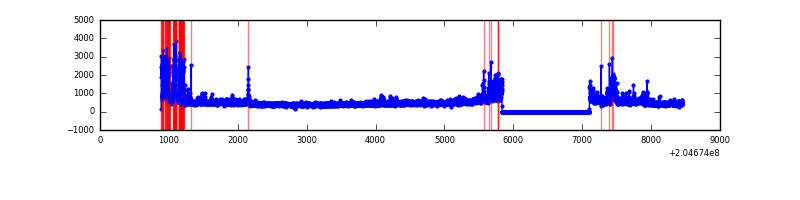 |
| B | 7567 | 6298 | 19 | 19 | 0.25% | 0.30% | 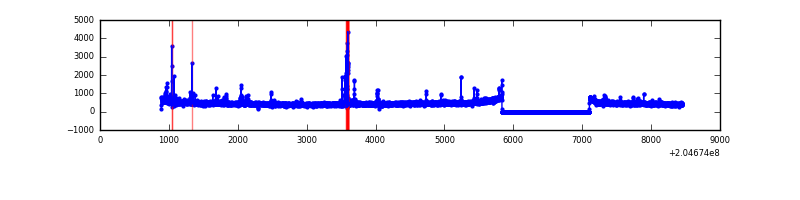 |
| C | 7567 | 6298 | 1 | 1 | 0.01% | 0.02% | 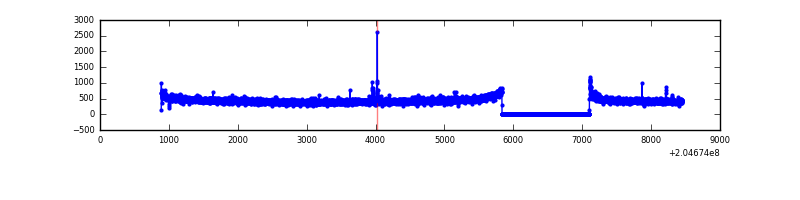 |
| D | 7567 | 6298 | 42 | 42 | 0.56% | 0.67% | 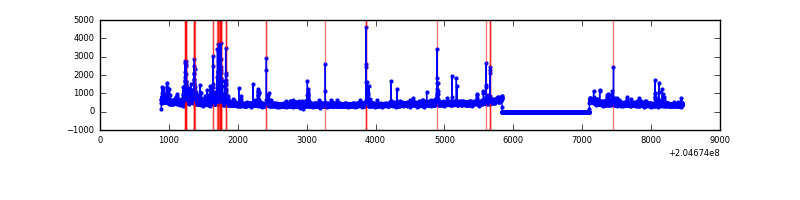 |
Top three noisy pixels from each quadrant. If the there are fewer than three noisy pixels in the level2.evt file, extra rows are filled as -1
| Pixel properties | Quadrant properties | ||||||
|---|---|---|---|---|---|---|---|
| Quadrant | DetID | PixID | Counts | Sigma | Mean | Median | Sigma |
| A | 0 | 50 | 313979 | 2168.74 | 704 | 687 | 144.5 |
| A | 8 | 15 | 230496 | 1590.84 | 704 | 687 | 144.5 |
| A | 0 | 199 | 190254 | 1312.27 | 704 | 687 | 144.5 |
| B | 10 | 16 | 95193 | 685.99 | 726 | 709 | 137.7 |
| B | 14 | 167 | 39310 | 280.26 | 726 | 709 | 137.7 |
| B | 15 | 204 | 37213 | 265.03 | 726 | 709 | 137.7 |
| C | 9 | 144 | 15969 | 93.6 | 703 | 707 | 163.1 |
| C | 1 | 16 | 14953 | 87.37 | 703 | 707 | 163.1 |
| C | 13 | 61 | 5985 | 32.37 | 703 | 707 | 163.1 |
| D | 2 | 232 | 154377 | 938.53 | 687 | 669 | 163.8 |
| D | 4 | 160 | 145094 | 881.84 | 687 | 669 | 163.8 |
| D | 4 | 95 | 32131 | 192.1 | 687 | 669 | 163.8 |
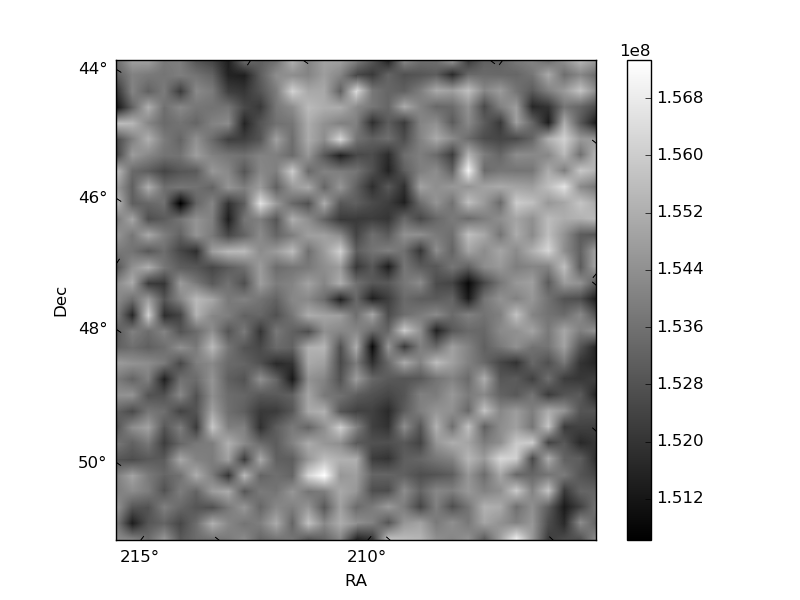
Histogram calculated using DETX and DETY for each event in the final _common_clean file
| Quadrant A | 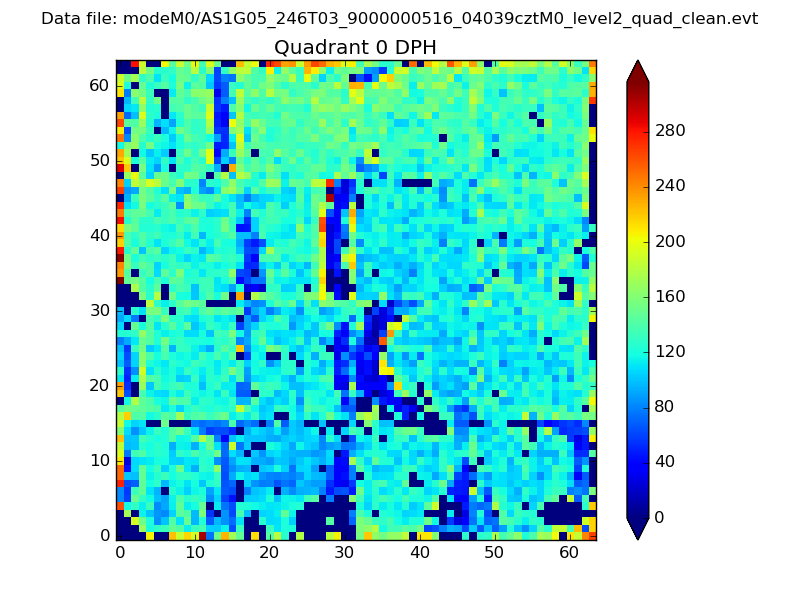 |
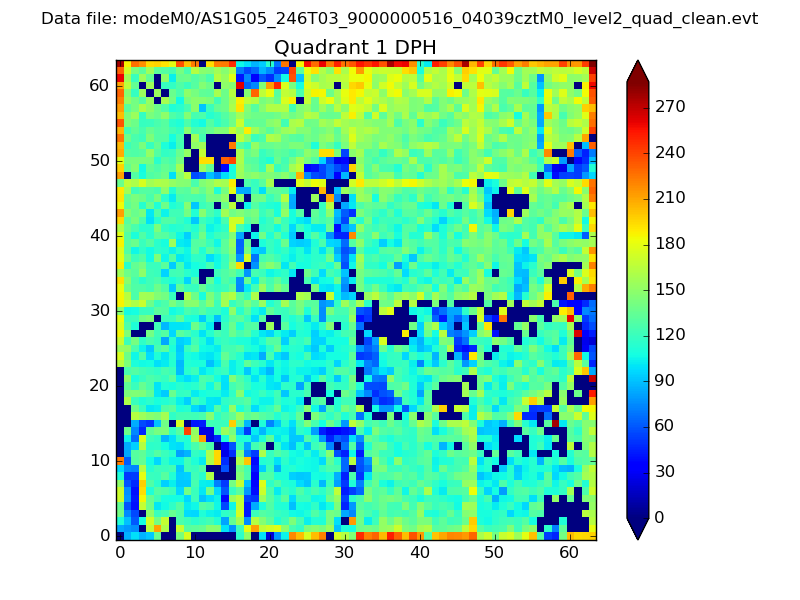 |
Quadrant B |
|---|---|---|---|
| Quadrant D | 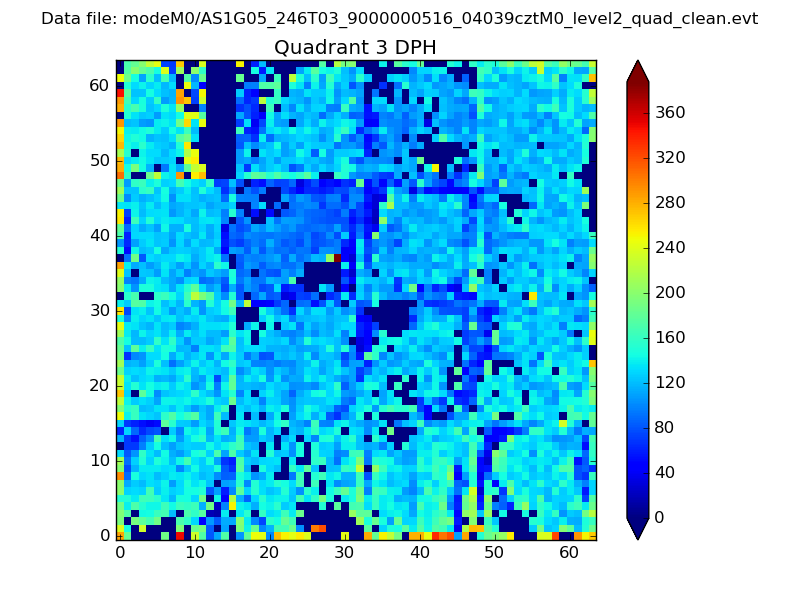 |
 |
Quadrant C |
| Plot type | Count rate plots | Images |
|---|---|---|
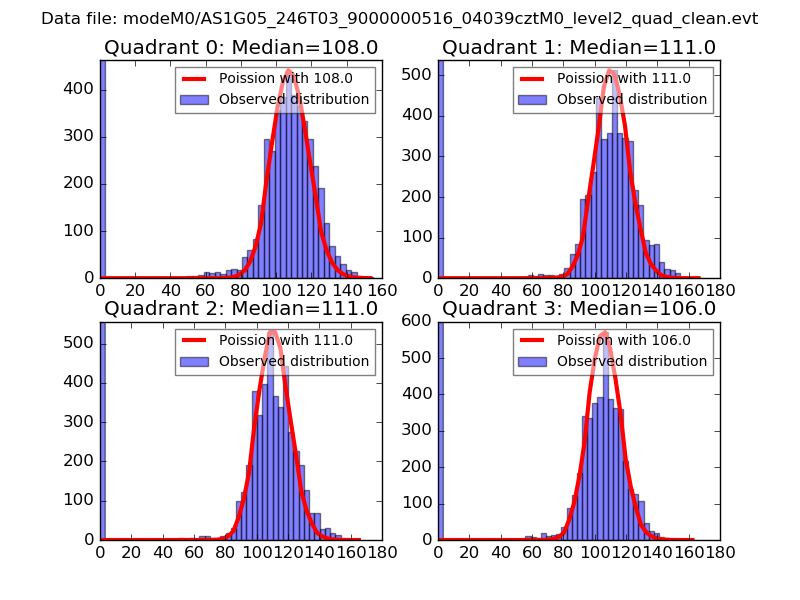
| Comparison with Poisson distribution Blue bars denote a histogram of data divided into 1 sec bins. Red curve is a Poisson curve with rate = median count rate of data. |
 |
 |
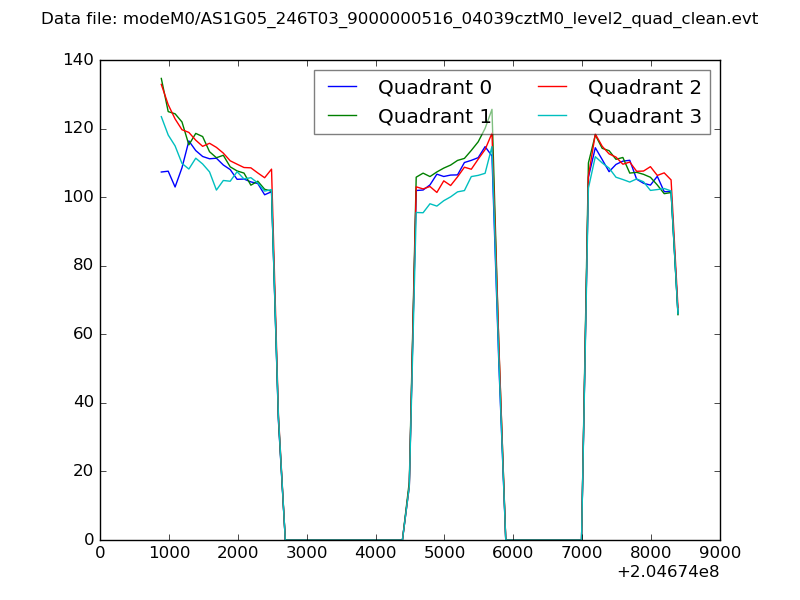
| Quadrant-wise count rates Data is divided into 100 sec bins |
 |
|
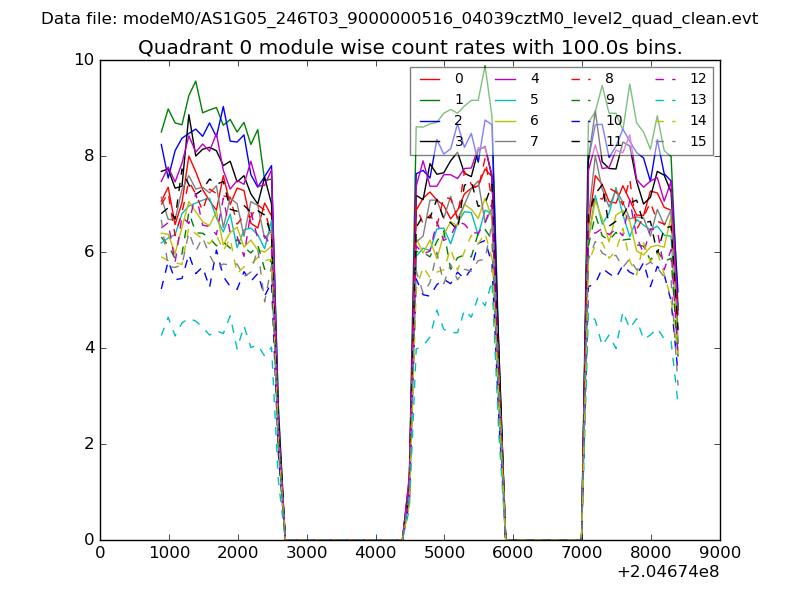
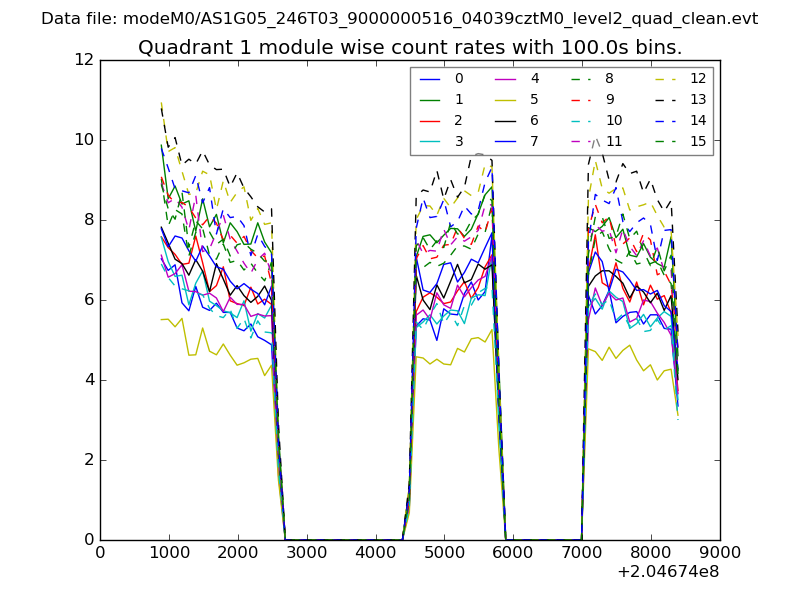
| Module-wise count rates for Quadrant A Data is divided into 100 sec bins |
 |
 |
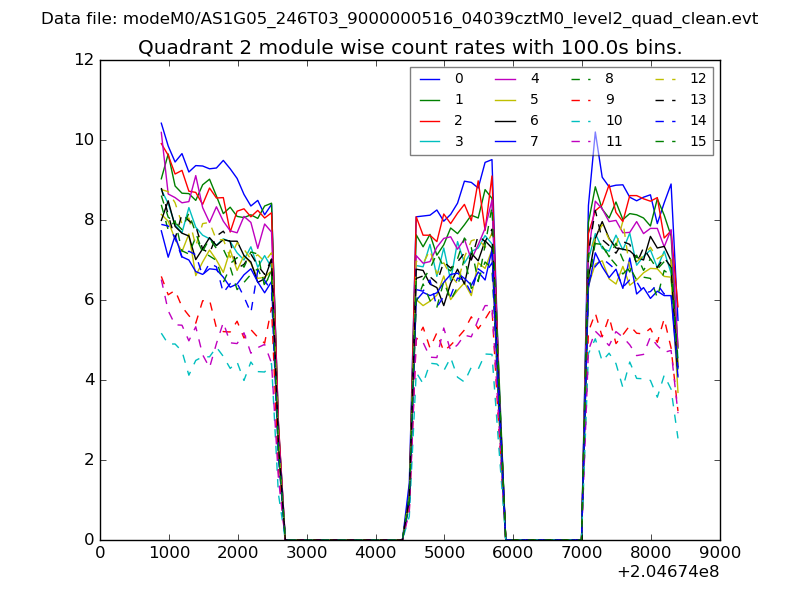
| Module-wise count rates for Quadrant B Data is divided into 100 sec bins |
 |
 |
| Module-wise count rates for Quadrant C Data is divided into 100 sec bins |
 |
 |
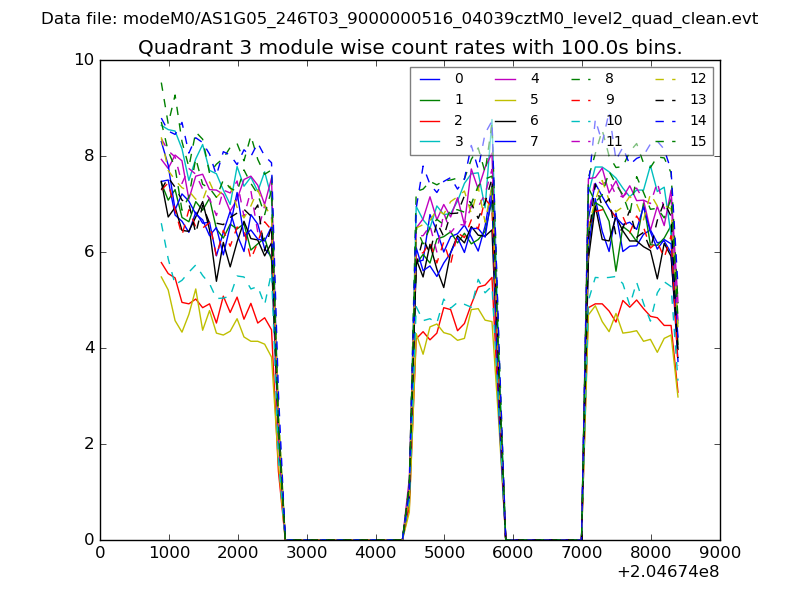
| Module-wise count rates for Quadrant D Data is divided into 100 sec bins |
 |
 |
| Parameter | Plot |
|---|---|
| CZT HV Monitor | 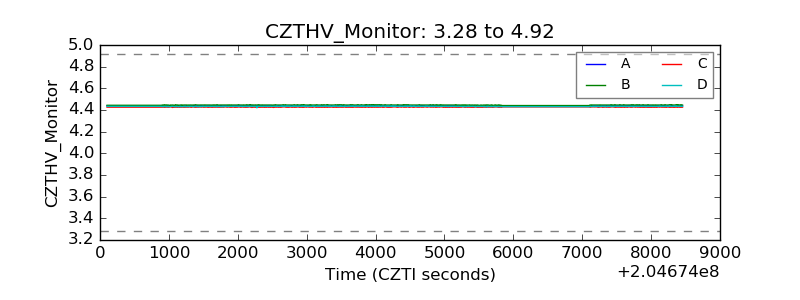 |
| D_VDD | 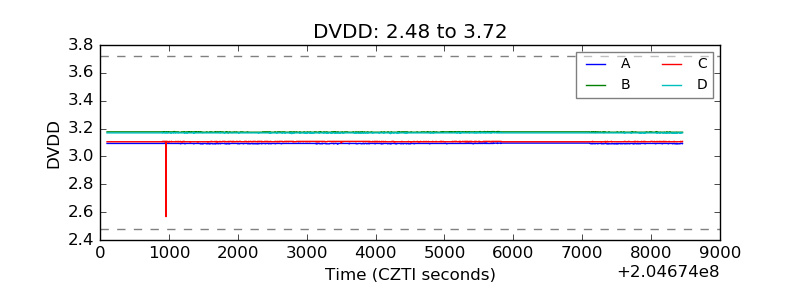 |
| Temperature 1 | 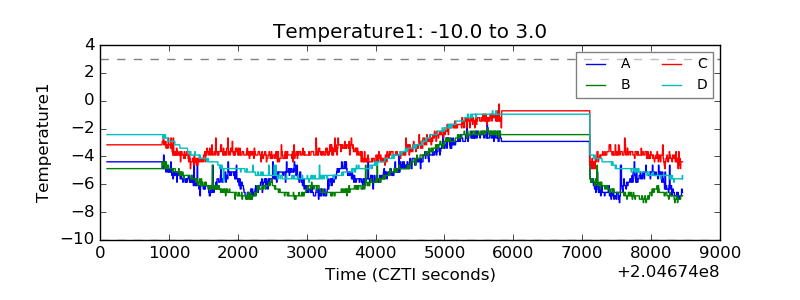 |
| Veto HV Monitor | 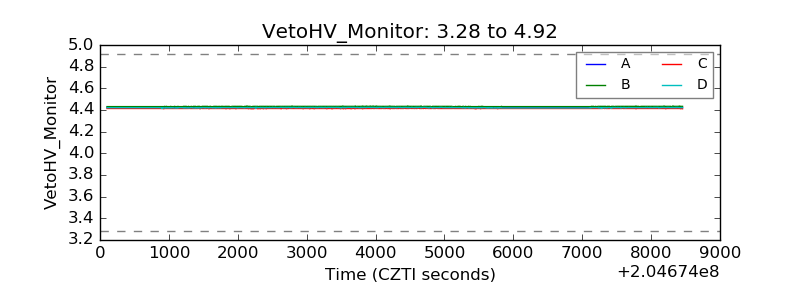 |
| Veto LLD | 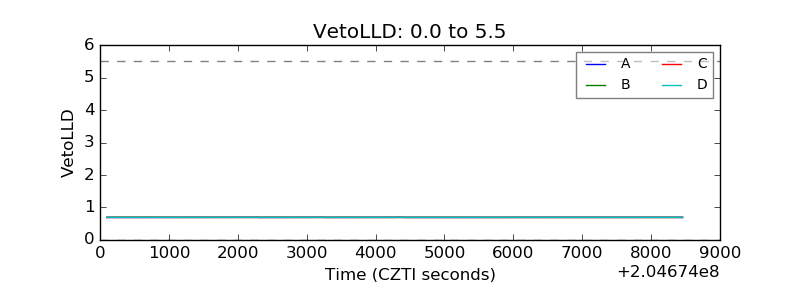 |
| Alpha Counter |  |
| _CPM_Rate |  |
| CZT Counter | 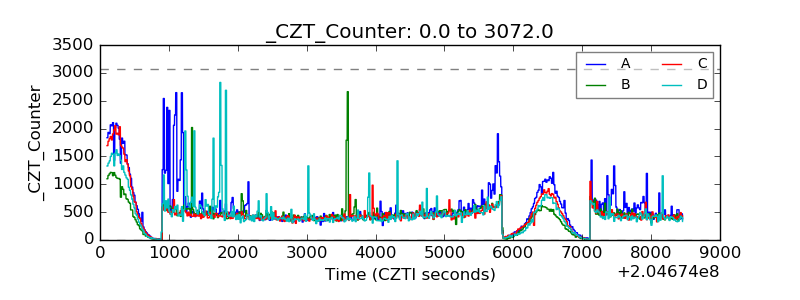 |
| +2.5 Volts monitor |  |
| +5 Volts monitor |  |
| _ROLL_ROT | 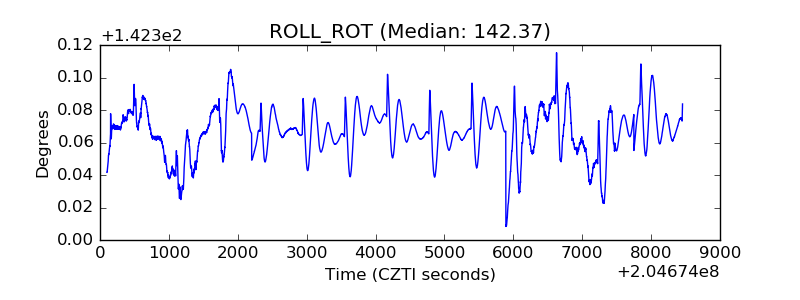 |
| _Roll_DEC | 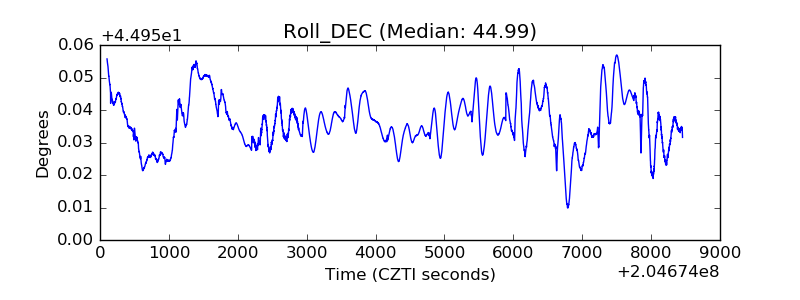 |
| _Roll_RA | 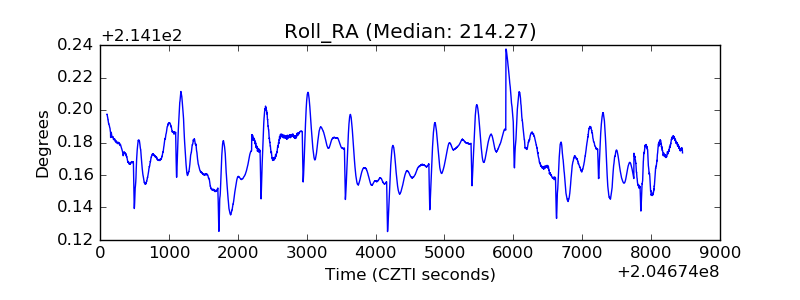 |
| Veto Counter | 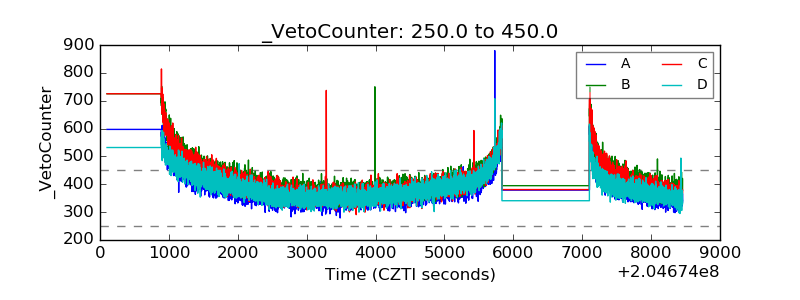 |