| Param | Original file | Final file |
|---|---|---|
| Filename | modeM0/AS1G05_246T03_9000000516_04040cztM0_level2.evt | modeM0/AS1G05_246T03_9000000516_04040cztM0_level2_quad_clean.evt |
| Size (bytes) | 502,392,960 | 73,431,360 |
| Size | 479.1 MB | 70.0 MB |
| Events in quadrant A | 5,936,791 | 432,150 |
| Events in quadrant B | 3,100,462 | 450,602 |
| Events in quadrant C | 2,834,567 | 451,433 |
| Events in quadrant D | 2,901,939 | 435,560 |
| Mode M9 | |||
|---|---|---|---|
| Quadrant | BADHDUFLAG | Total packets | Discarded packets |
| A | 0 | 18 | 0 |
| B | 0 | 18 | 0 |
| C | 0 | 18 | 0 |
| D | 0 | 19 | 0 |
| Mode M0 | |||
|---|---|---|---|
| Quadrant | BADHDUFLAG | Total packets | Discarded packets |
| A | 0 | 22199 | 3 |
| B | 0 | 13830 | 2 |
| C | 0 | 13309 | 4 |
| D | 0 | 13617 | 2 |
| Mode SS | |||
|---|---|---|---|
| Quadrant | BADHDUFLAG | Total packets | Discarded packets |
| A | 0 | 130 | 0 |
| B | 0 | 130 | 0 |
| C | 0 | 130 | 0 |
| D | 0 | 130 | 0 |
| Quadrant | Total seconds | Saturated seconds | Saturation percentage |
|---|---|---|---|
| A | 6509 | 392 | 6.022430% |
| B | 6509 | 57 | 0.875711% |
| C | 6508 | 15 | 0.230486% |
| D | 6509 | 30 | 0.460900% |
Noise dominated data is calculated using 1-second bins in cleaned event files. If a bin has >2000 counts, and if more than 50% of those come from <1% of pixels, then it is considered to be noise-dominated and hence unusable.
| Quadrant | # 1 sec bins | Bins with >0 counts | Bins with >2000 counts | High rate bins dominated by noise | Noise dominated (total time) | Noise dominated (detector-on time) | Marked lightcurve |
|---|---|---|---|---|---|---|---|
| A | 7584 | 6510 | 195 | 195 | 2.57% | 3.00% | 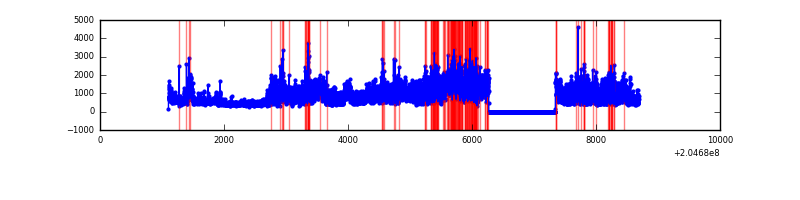 |
| B | 7584 | 6509 | 24 | 24 | 0.32% | 0.37% | 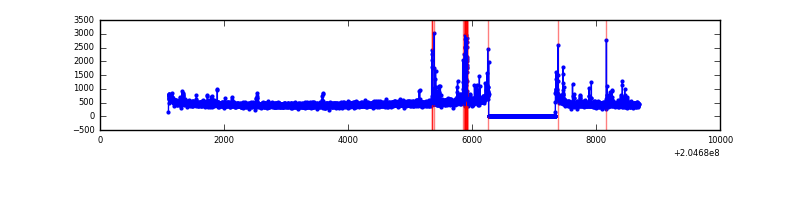 |
| C | 7584 | 6510 | 0 | 0 | 0.00% | 0.00% | 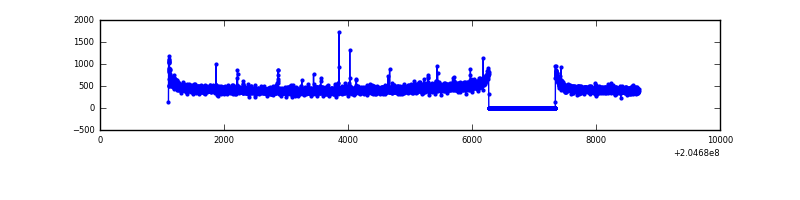 |
| D | 7584 | 6510 | 16 | 16 | 0.21% | 0.25% | 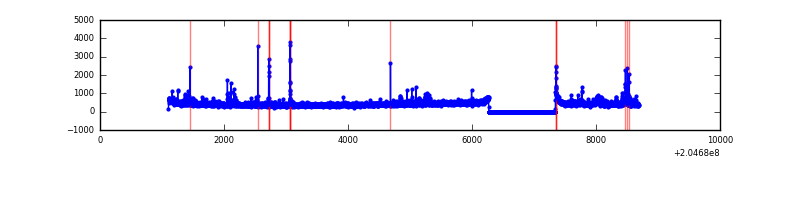 |
Top three noisy pixels from each quadrant. If the there are fewer than three noisy pixels in the level2.evt file, extra rows are filled as -1
| Pixel properties | Quadrant properties | ||||||
|---|---|---|---|---|---|---|---|
| Quadrant | DetID | PixID | Counts | Sigma | Mean | Median | Sigma |
| A | 8 | 15 | 1588003 | 10926.51 | 715 | 700 | 145.3 |
| A | 0 | 199 | 1342261 | 9234.9 | 715 | 700 | 145.3 |
| A | 0 | 226 | 143683 | 984.25 | 715 | 700 | 145.3 |
| B | 10 | 16 | 117638 | 825.92 | 741 | 724 | 141.6 |
| B | 14 | 167 | 40907 | 283.87 | 741 | 724 | 141.6 |
| B | 15 | 204 | 40853 | 283.48 | 741 | 724 | 141.6 |
| C | 9 | 144 | 22505 | 131.88 | 715 | 719 | 165.2 |
| C | 1 | 16 | 12019 | 68.4 | 715 | 719 | 165.2 |
| C | 13 | 61 | 6013 | 32.05 | 715 | 719 | 165.2 |
| D | 2 | 232 | 130617 | 760.86 | 703 | 682 | 170.8 |
| D | 2 | 14 | 37653 | 216.49 | 703 | 682 | 170.8 |
| D | 4 | 95 | 34146 | 195.96 | 703 | 682 | 170.8 |
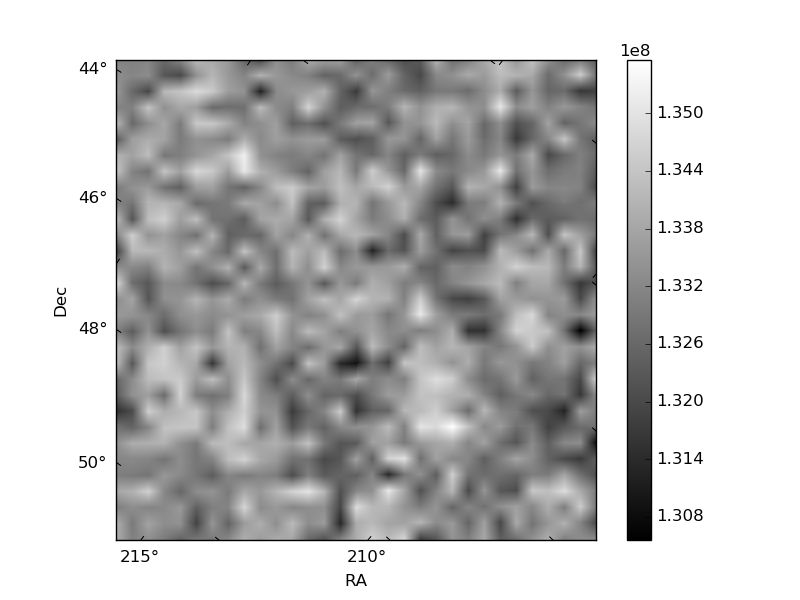
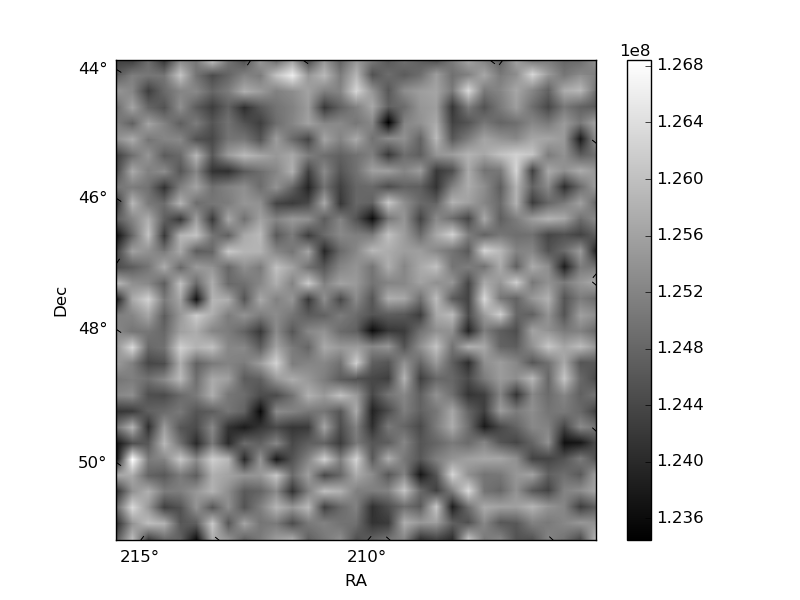
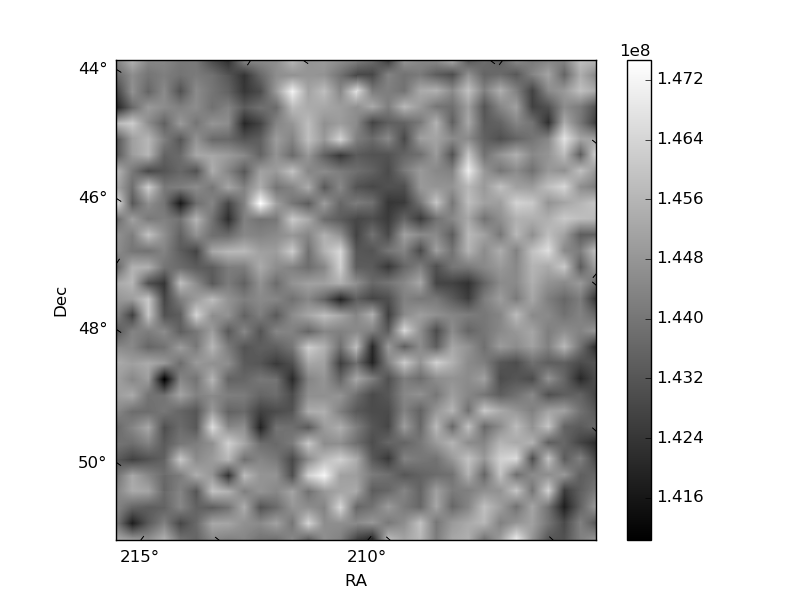
Histogram calculated using DETX and DETY for each event in the final _common_clean file
| Quadrant A | 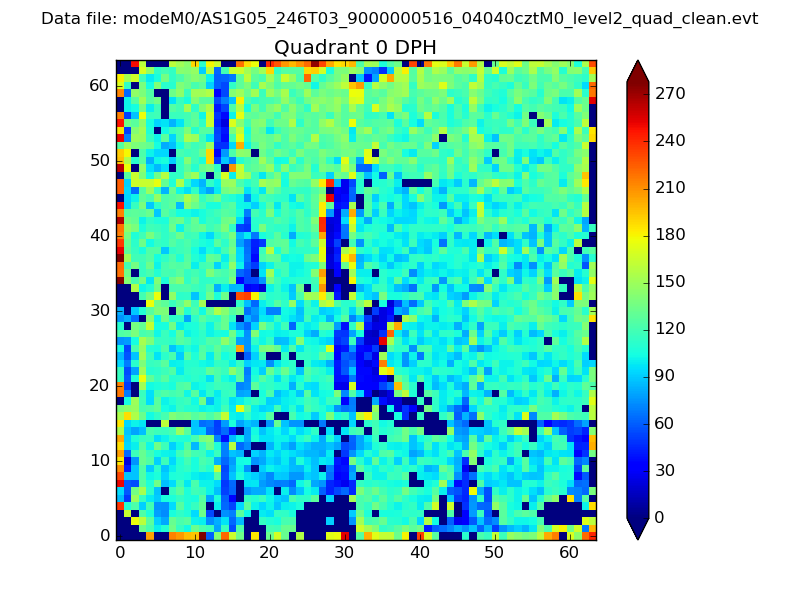 |
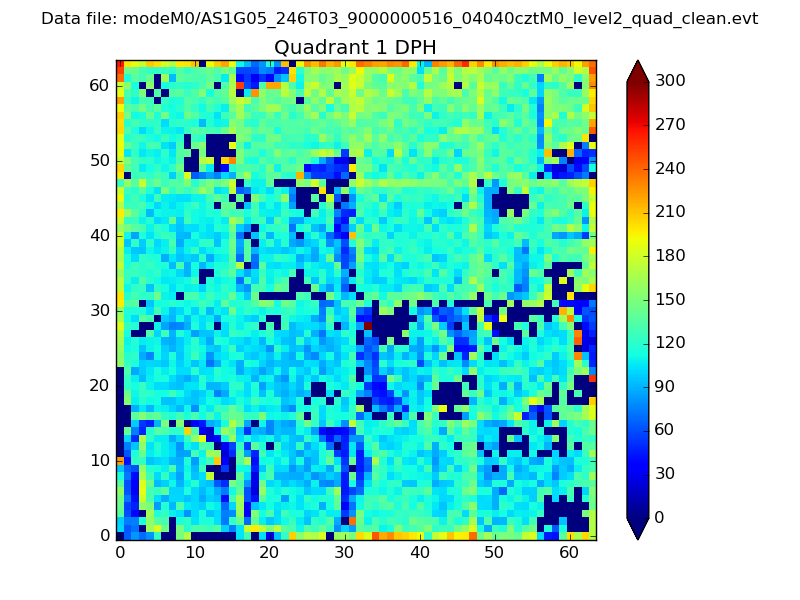 |
Quadrant B |
|---|---|---|---|
| Quadrant D | 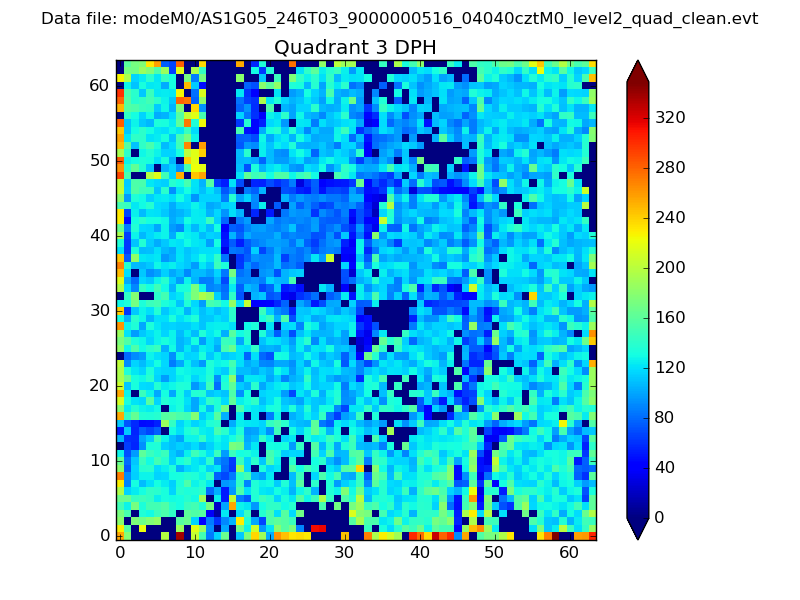 |
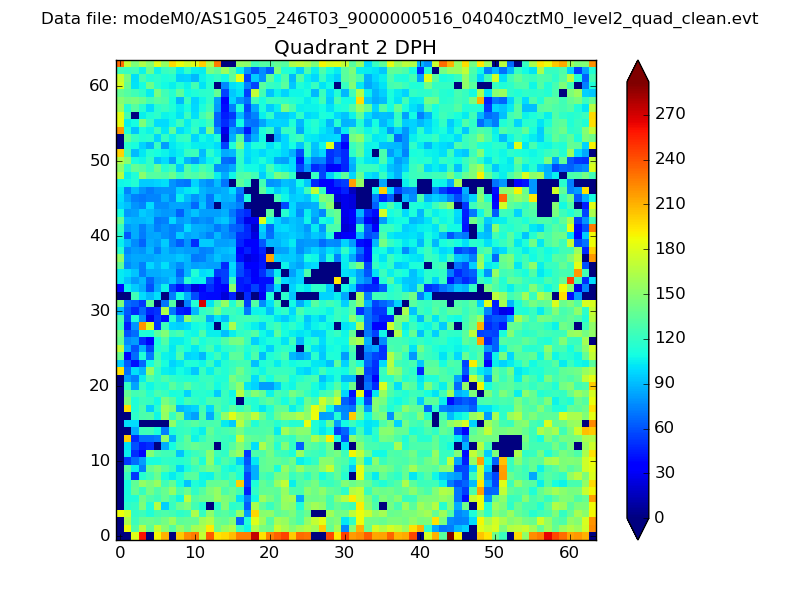 |
Quadrant C |
| Plot type | Count rate plots | Images |
|---|---|---|
| Comparison with Poisson distribution Blue bars denote a histogram of data divided into 1 sec bins. Red curve is a Poisson curve with rate = median count rate of data. |
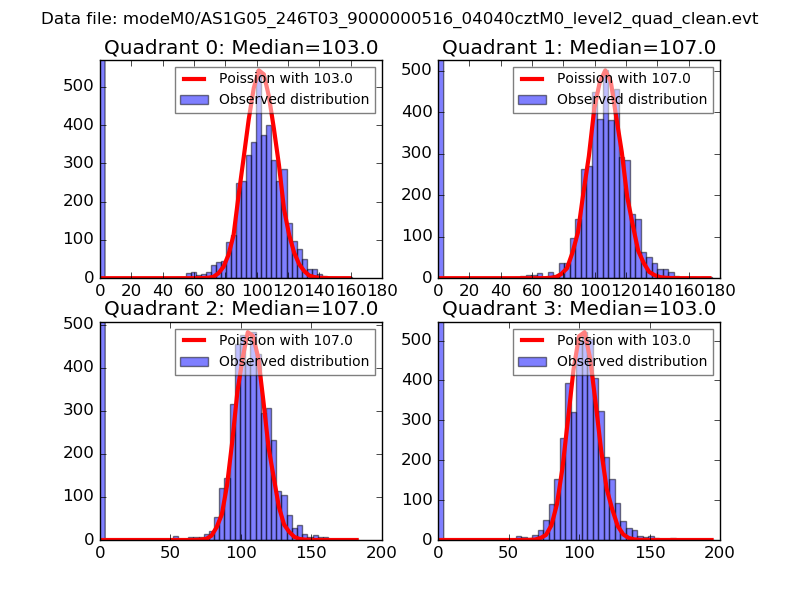 |
 |
| Quadrant-wise count rates Data is divided into 100 sec bins |
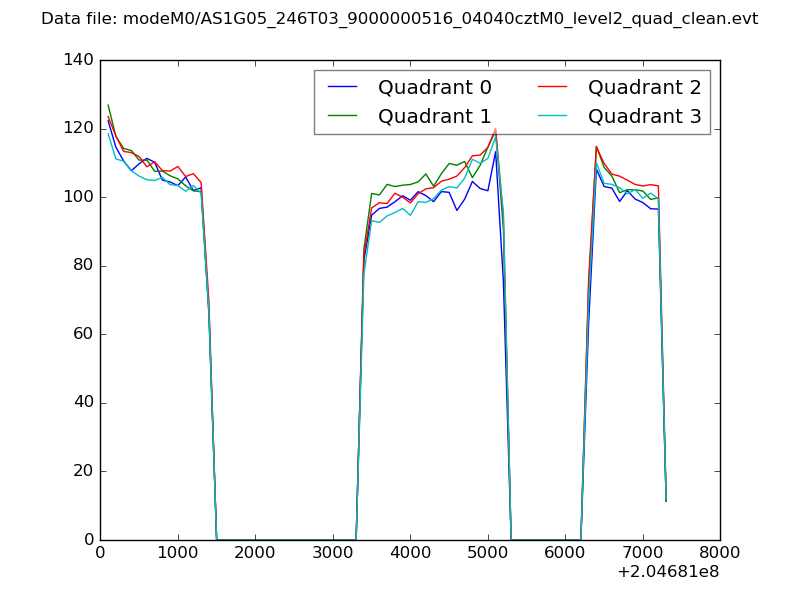 |
|
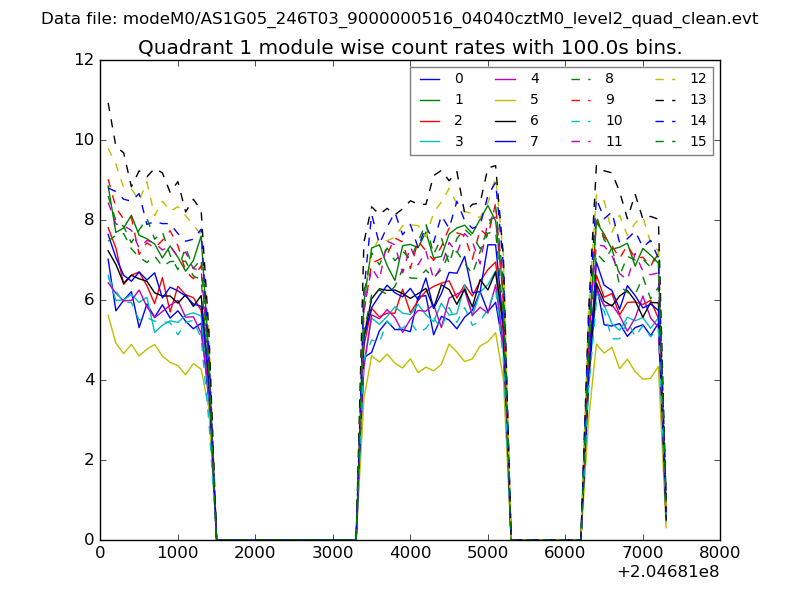
| Module-wise count rates for Quadrant A Data is divided into 100 sec bins |
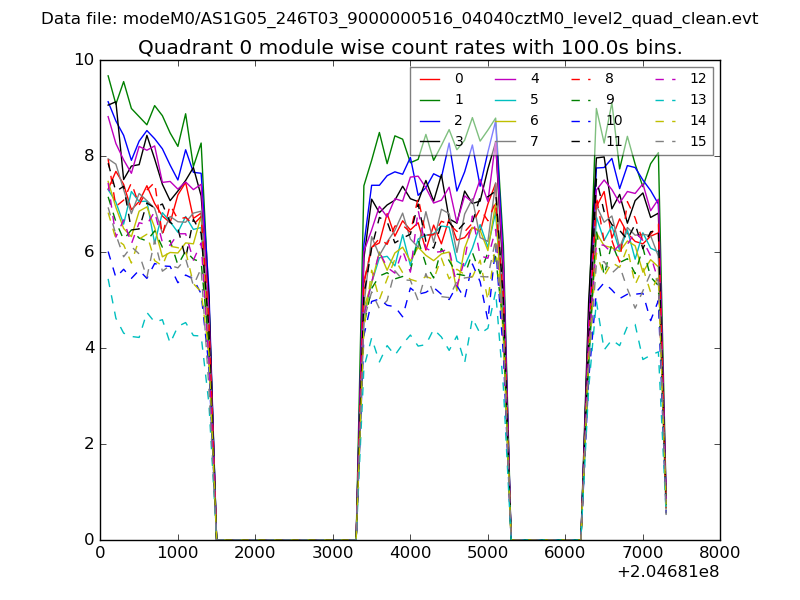 |
 |
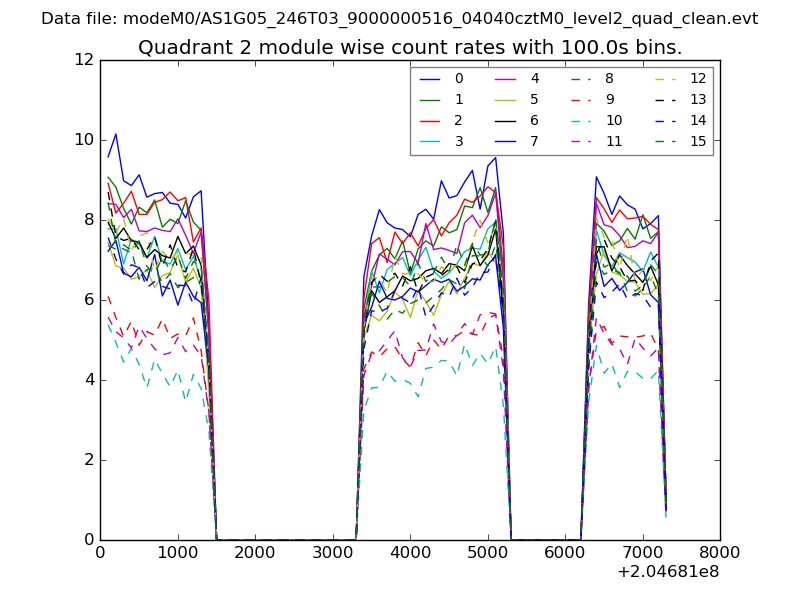
| Module-wise count rates for Quadrant B Data is divided into 100 sec bins |
 |
 |
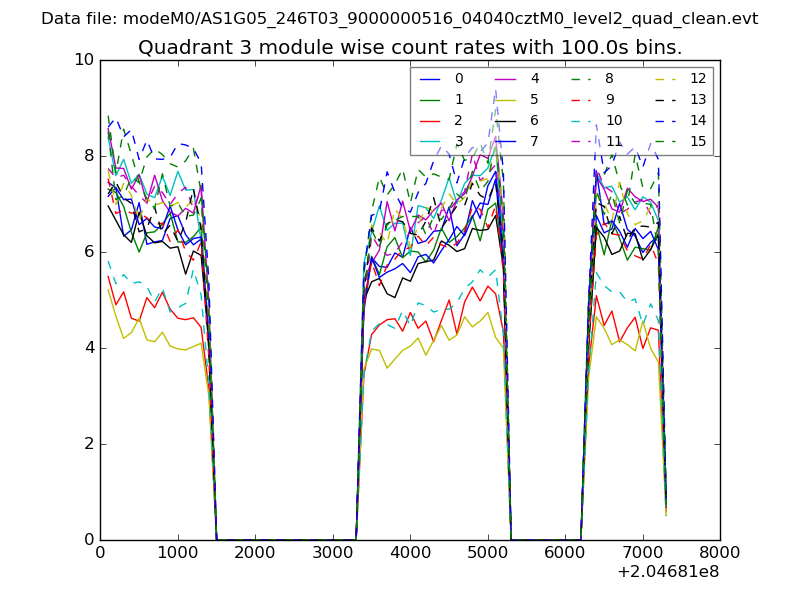
| Module-wise count rates for Quadrant C Data is divided into 100 sec bins |
 |
 |
| Module-wise count rates for Quadrant D Data is divided into 100 sec bins |
 |
 |
| Parameter | Plot |
|---|---|
| CZT HV Monitor | 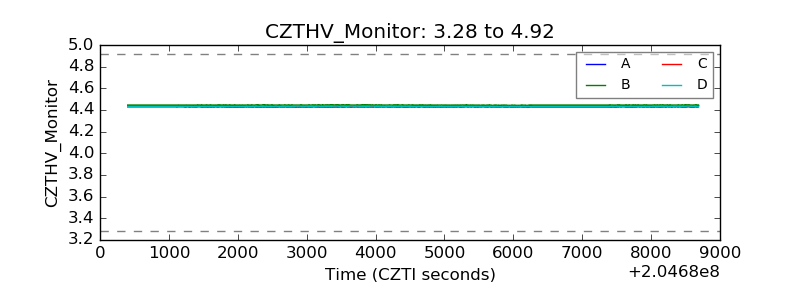 |
| D_VDD | 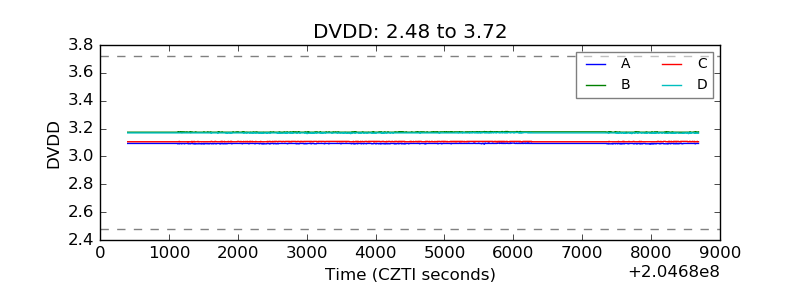 |
| Temperature 1 |  |
| Veto HV Monitor | 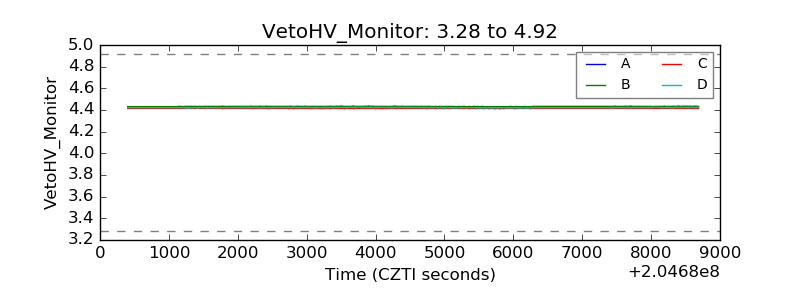 |
| Veto LLD | 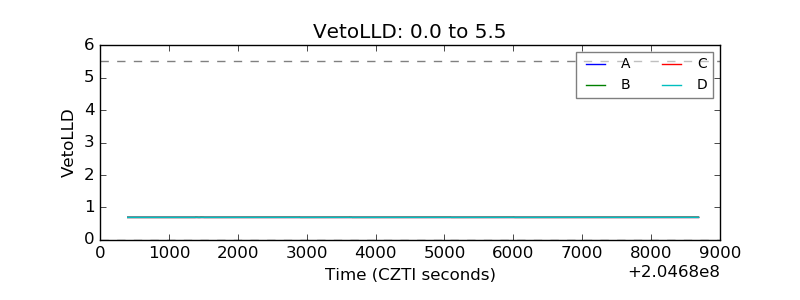 |
| Alpha Counter | 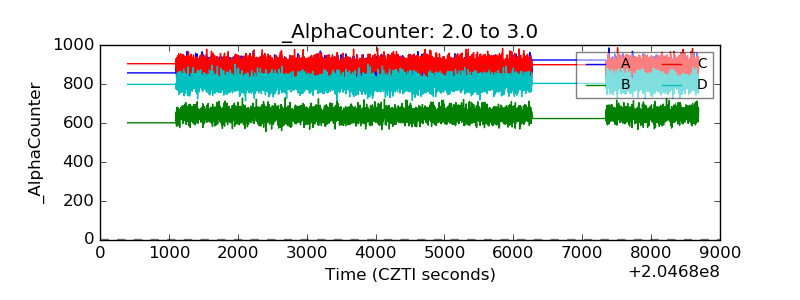 |
| _CPM_Rate |  |
| CZT Counter | 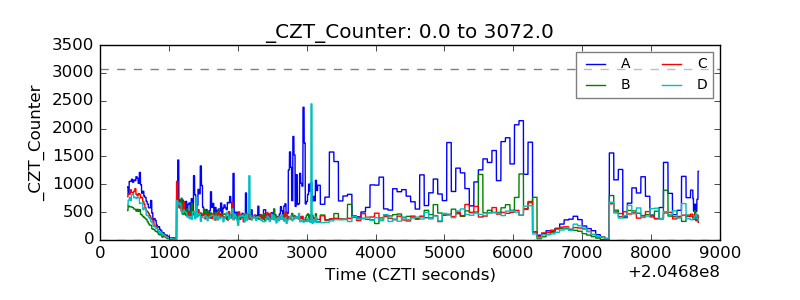 |
| +2.5 Volts monitor |  |
| +5 Volts monitor |  |
| _ROLL_ROT | 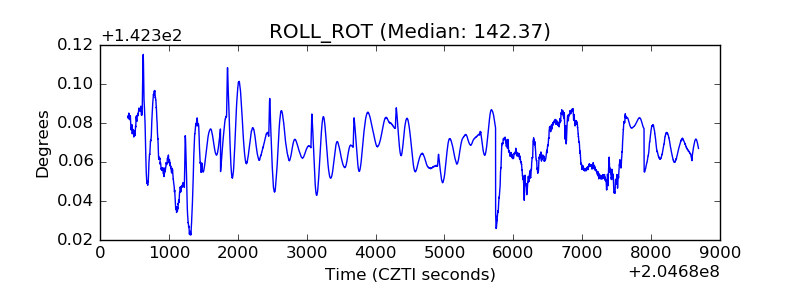 |
| _Roll_DEC | 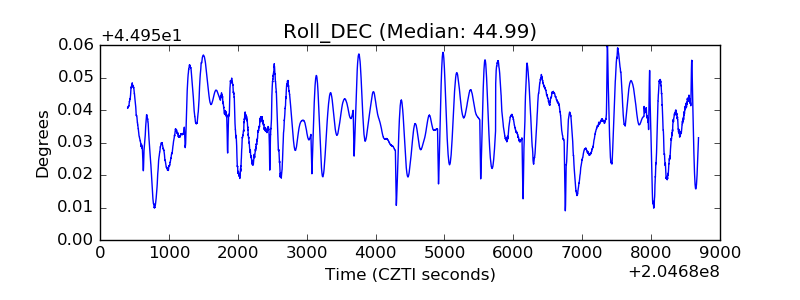 |
| _Roll_RA |  |
| Veto Counter | 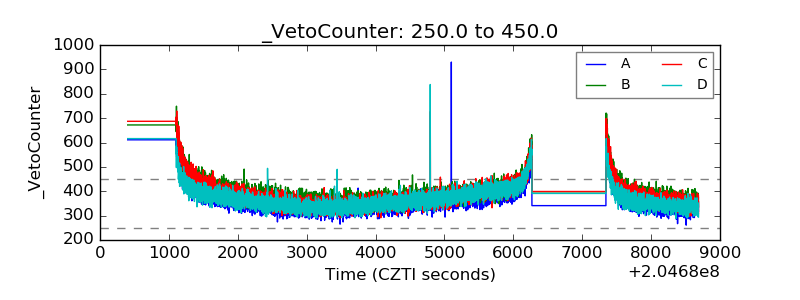 |