| Param | Original file | Final file |
|---|---|---|
| Filename | modeM0/AS1G05_246T03_9000000516_04043cztM0_level2.evt | modeM0/AS1G05_246T03_9000000516_04043cztM0_level2_quad_clean.evt |
| Size (bytes) | 607,063,680 | 73,992,960 |
| Size | 578.9 MB | 70.6 MB |
| Events in quadrant A | 5,918,454 | 404,097 |
| Events in quadrant B | 4,055,292 | 430,680 |
| Events in quadrant C | 3,643,965 | 437,061 |
| Events in quadrant D | 4,231,626 | 419,243 |
| Mode M9 | |||
|---|---|---|---|
| Quadrant | BADHDUFLAG | Total packets | Discarded packets |
| A | 0 | 3 | 0 |
| B | 0 | 3 | 0 |
| C | 0 | 3 | 0 |
| D | 0 | 3 | 0 |
| Mode M0 | |||
|---|---|---|---|
| Quadrant | BADHDUFLAG | Total packets | Discarded packets |
| A | 0 | 23000 | 3 |
| B | 0 | 17474 | 2 |
| C | 0 | 16693 | 2 |
| D | 0 | 18460 | 2 |
| Mode SS | |||
|---|---|---|---|
| Quadrant | BADHDUFLAG | Total packets | Discarded packets |
| A | 0 | 160 | 0 |
| B | 0 | 160 | 0 |
| C | 0 | 160 | 0 |
| D | 0 | 160 | 0 |
| Quadrant | Total seconds | Saturated seconds | Saturation percentage |
|---|---|---|---|
| A | 7900 | 774 | 9.797468% |
| B | 7900 | 463 | 5.860759% |
| C | 7900 | 300 | 3.797468% |
| D | 7901 | 331 | 4.189343% |
Noise dominated data is calculated using 1-second bins in cleaned event files. If a bin has >2000 counts, and if more than 50% of those come from <1% of pixels, then it is considered to be noise-dominated and hence unusable.
| Quadrant | # 1 sec bins | Bins with >0 counts | Bins with >2000 counts | High rate bins dominated by noise | Noise dominated (total time) | Noise dominated (detector-on time) | Marked lightcurve |
|---|---|---|---|---|---|---|---|
| A | 8100 | 7901 | 305 | 305 | 3.77% | 3.86% | 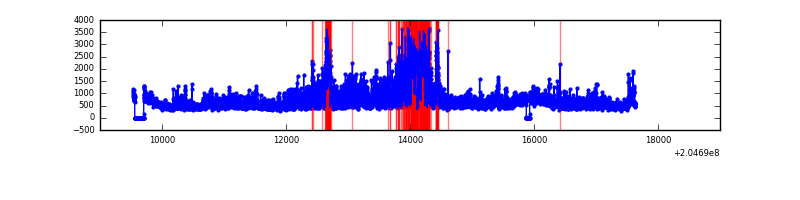 |
| B | 8100 | 7901 | 43 | 43 | 0.53% | 0.54% | 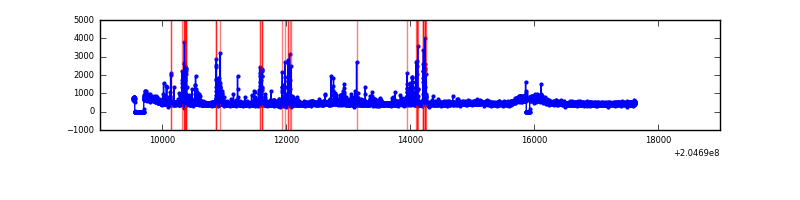 |
| C | 8100 | 7902 | 3 | 3 | 0.04% | 0.04% | 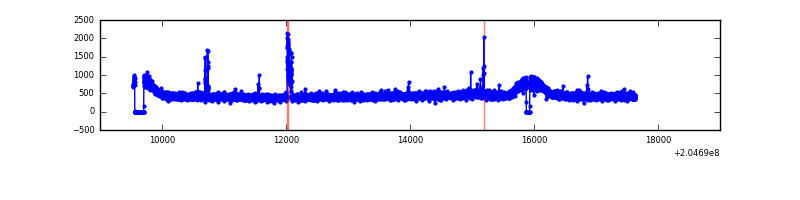 |
| D | 8101 | 7902 | 28 | 28 | 0.35% | 0.35% | 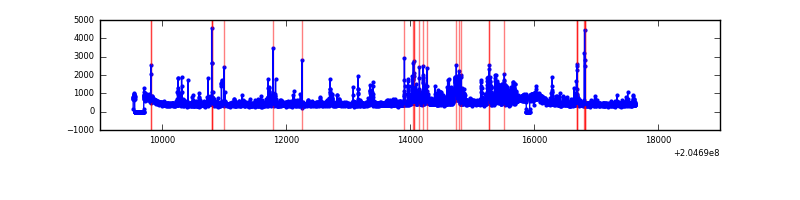 |
Top three noisy pixels from each quadrant. If the there are fewer than three noisy pixels in the level2.evt file, extra rows are filled as -1
| Pixel properties | Quadrant properties | ||||||
|---|---|---|---|---|---|---|---|
| Quadrant | DetID | PixID | Counts | Sigma | Mean | Median | Sigma |
| A | 8 | 15 | 869184 | 4689.22 | 891 | 867 | 185.2 |
| A | 0 | 199 | 760943 | 4104.68 | 891 | 867 | 185.2 |
| A | 0 | 50 | 699520 | 3772.98 | 891 | 867 | 185.2 |
| B | 10 | 16 | 306427 | 1691.92 | 927 | 901 | 180.6 |
| B | 15 | 204 | 50001 | 271.9 | 927 | 901 | 180.6 |
| B | 14 | 167 | 49375 | 268.44 | 927 | 901 | 180.6 |
| C | 9 | 144 | 78117 | 366.69 | 903 | 905 | 210.6 |
| C | 12 | 4 | 20397 | 92.57 | 903 | 905 | 210.6 |
| C | 13 | 61 | 7566 | 31.63 | 903 | 905 | 210.6 |
| D | 10 | 246 | 513902 | 2350.97 | 894 | 863 | 218.2 |
| D | 13 | 239 | 93406 | 424.07 | 894 | 863 | 218.2 |
| D | 13 | 137 | 88351 | 400.91 | 894 | 863 | 218.2 |
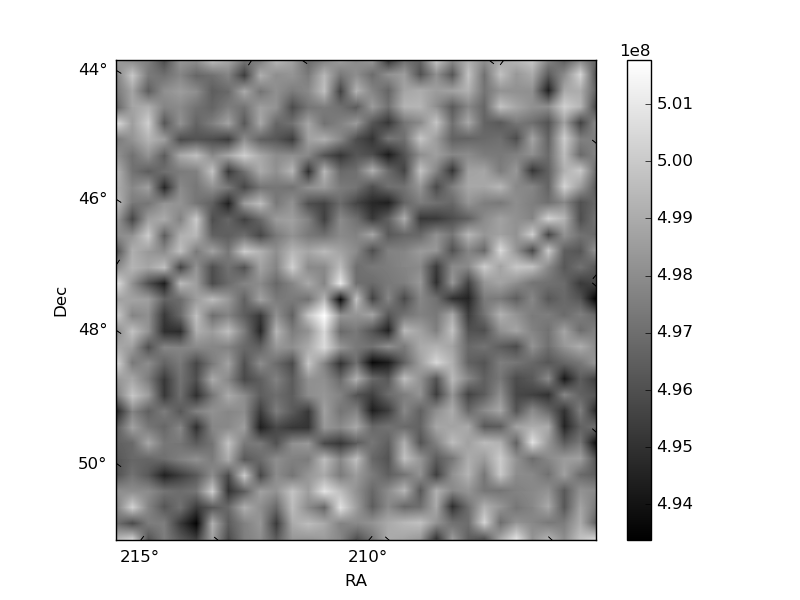
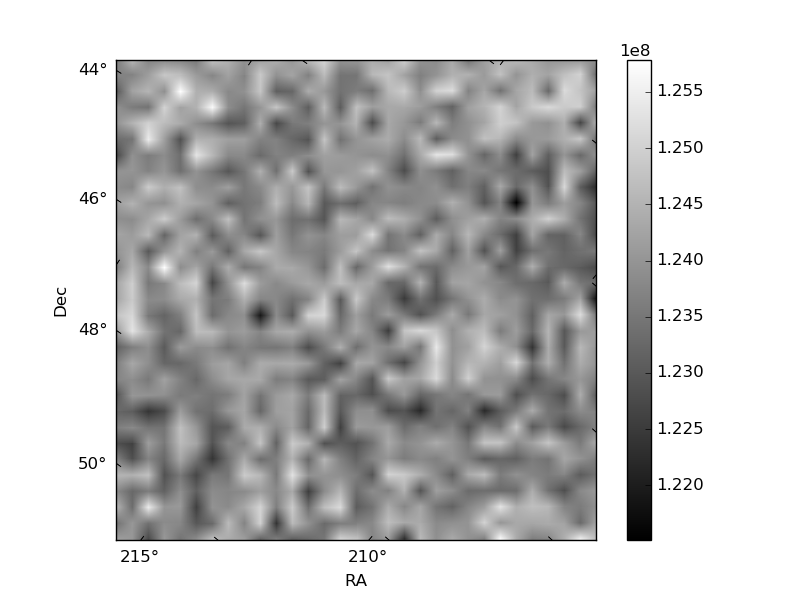
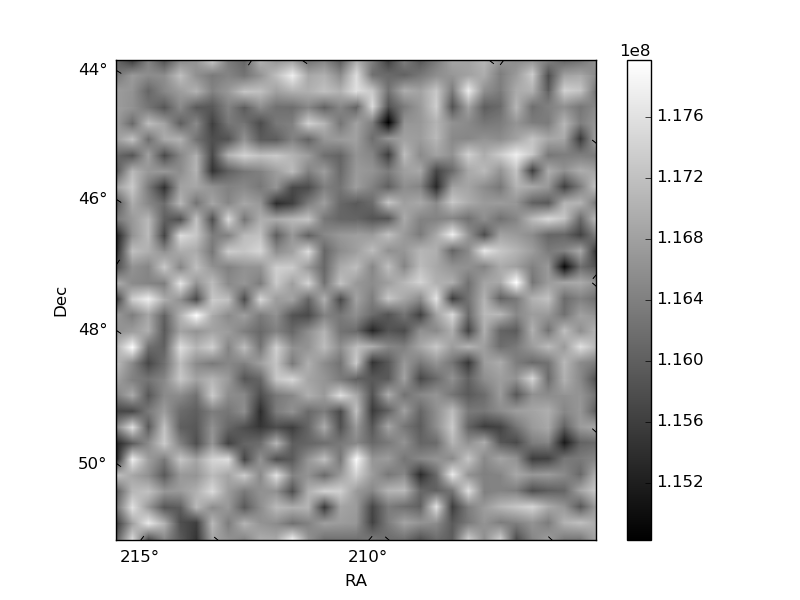
Histogram calculated using DETX and DETY for each event in the final _common_clean file
| Quadrant A | 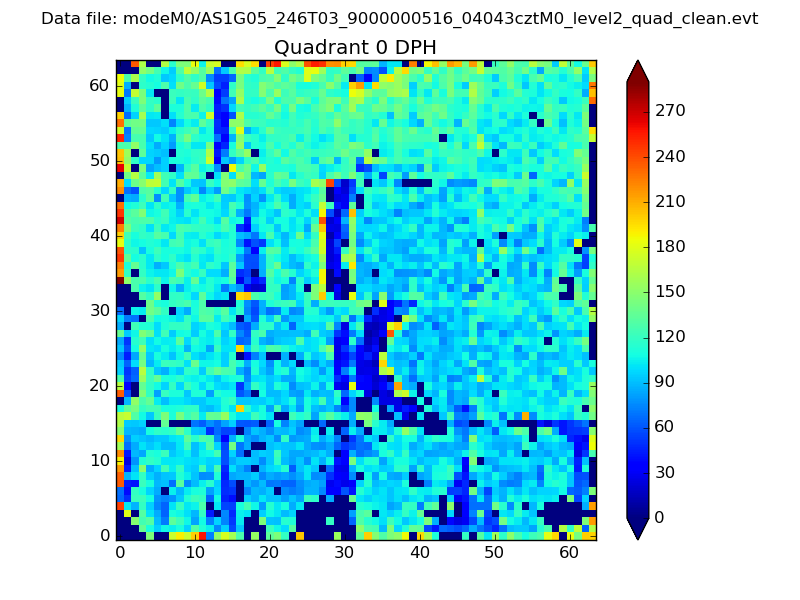 |
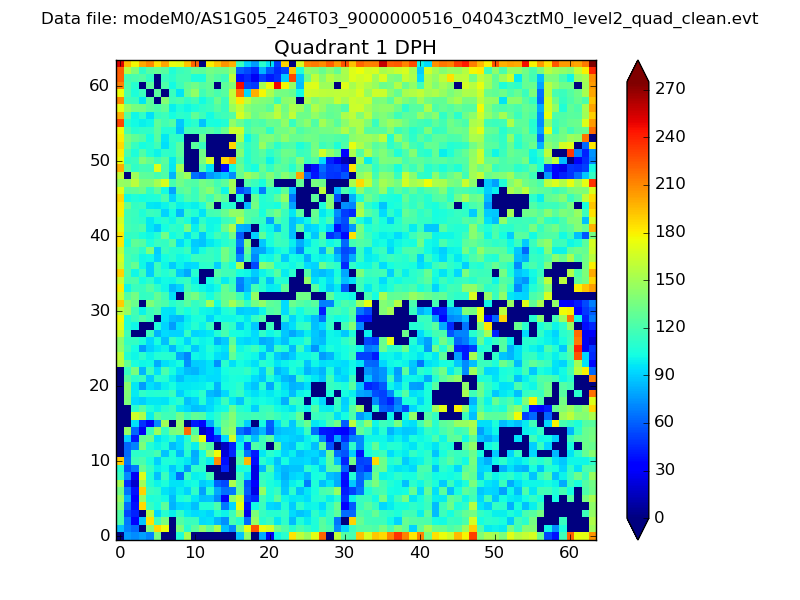 |
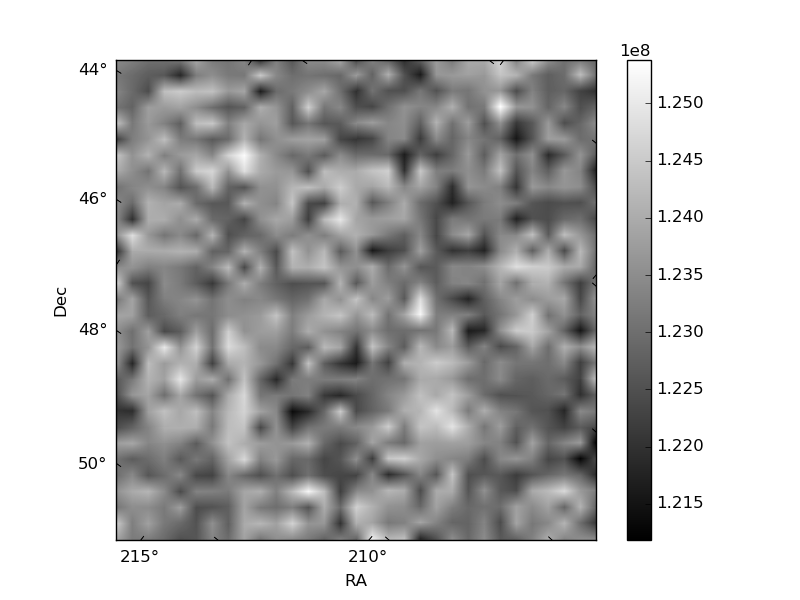
Quadrant B |
|---|---|---|---|
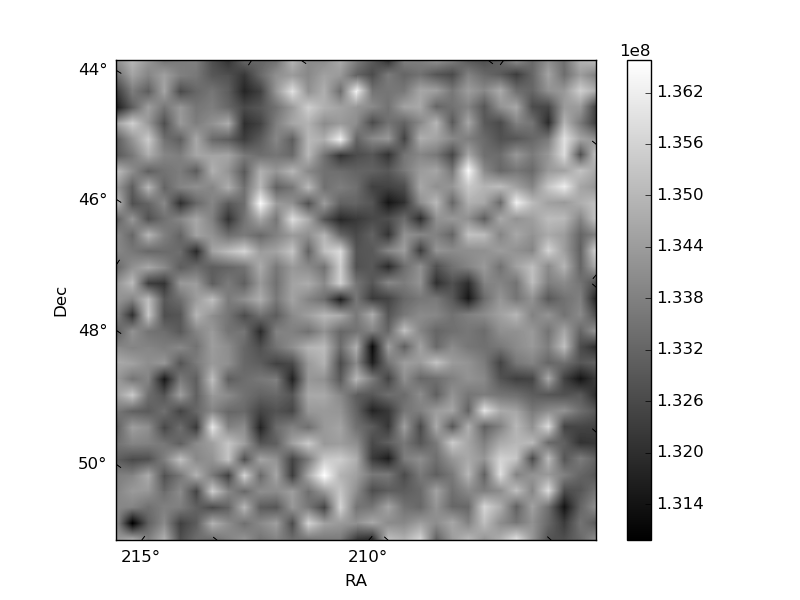
| Quadrant D | 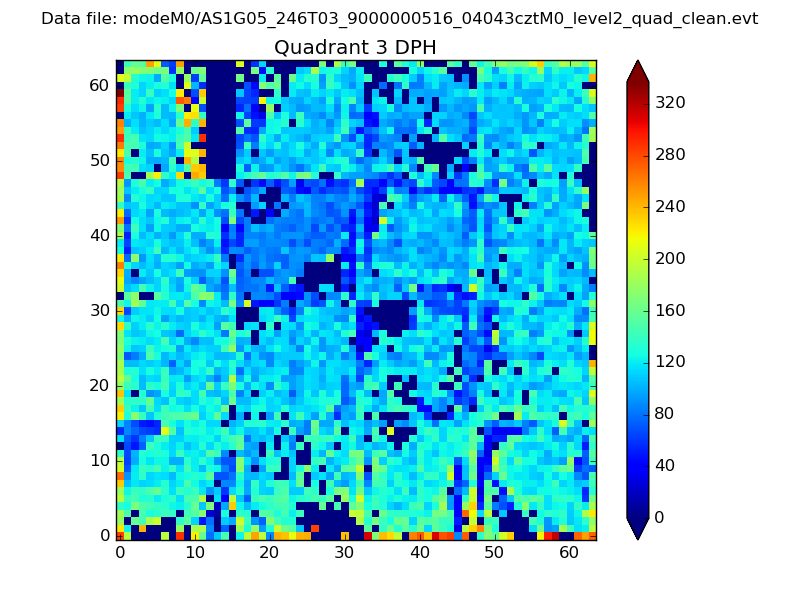 |
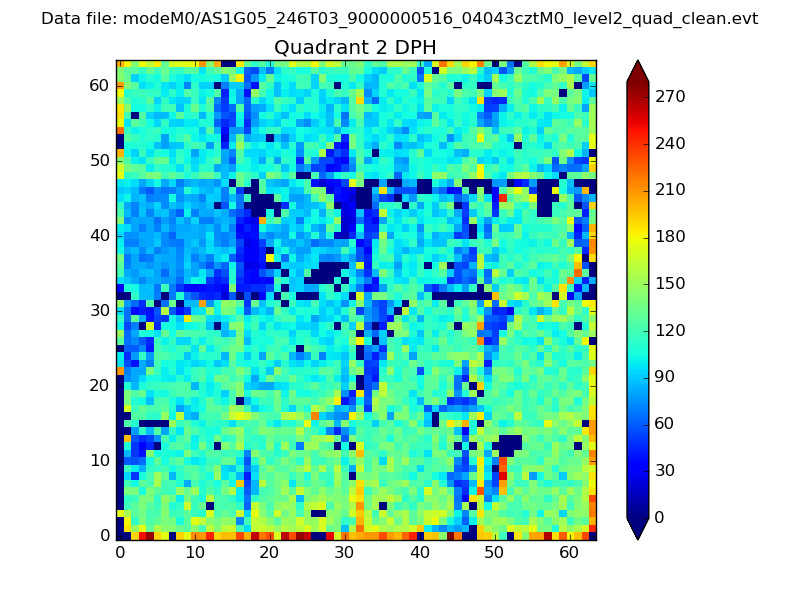 |
Quadrant C |
| Plot type | Count rate plots | Images |
|---|---|---|
| Comparison with Poisson distribution Blue bars denote a histogram of data divided into 1 sec bins. Red curve is a Poisson curve with rate = median count rate of data. |
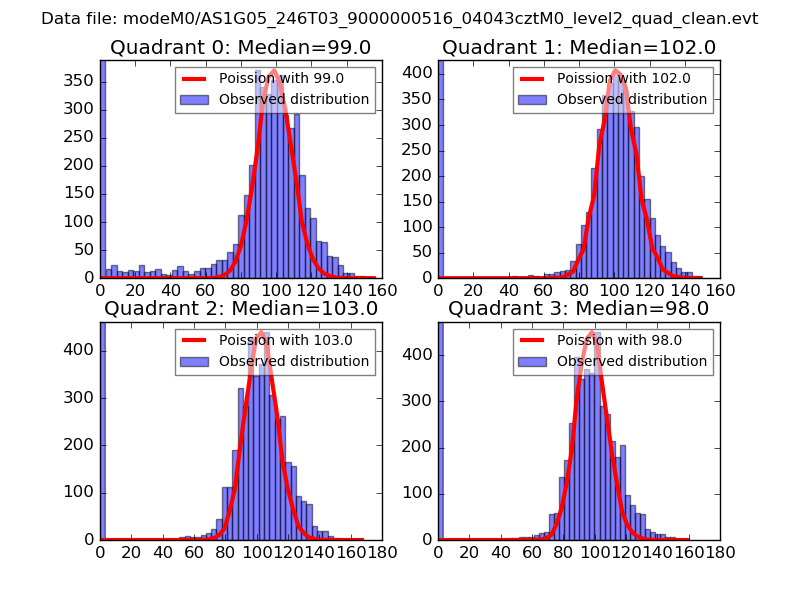 |
 |
| Quadrant-wise count rates Data is divided into 100 sec bins |
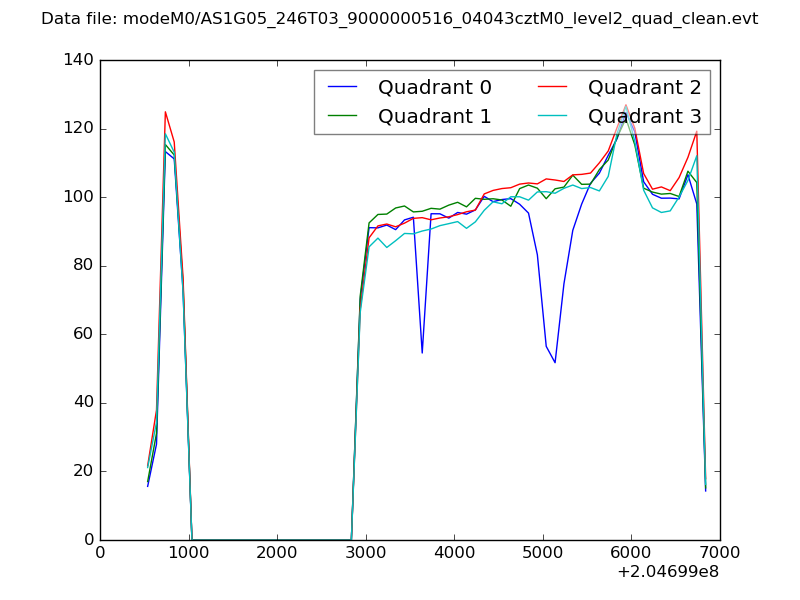 |
|
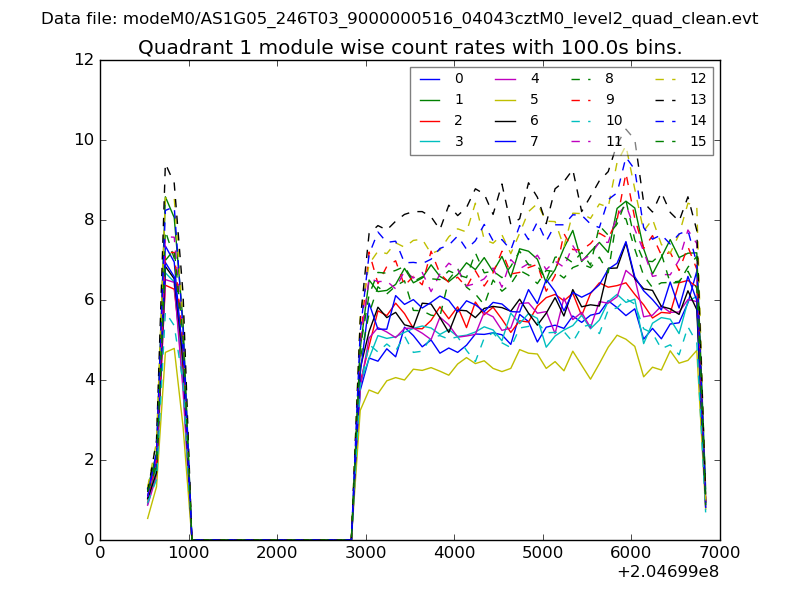
| Module-wise count rates for Quadrant A Data is divided into 100 sec bins |
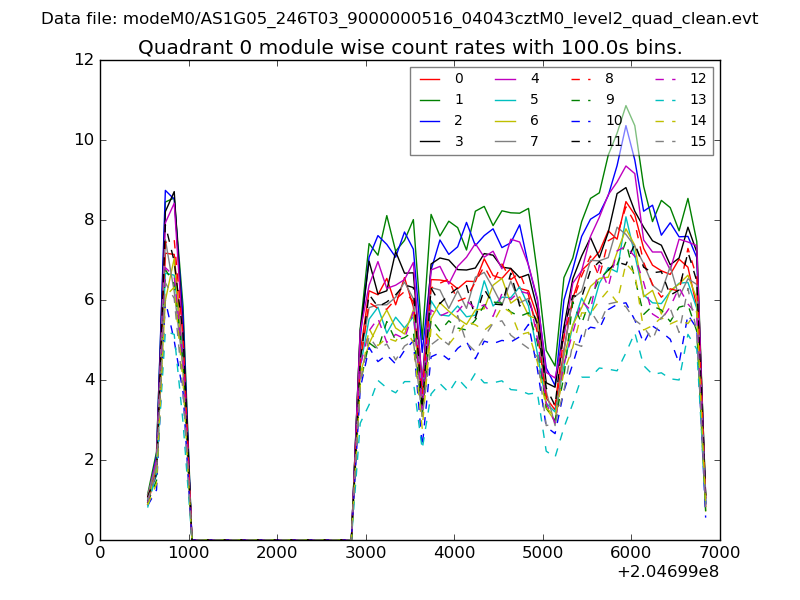 |
 |
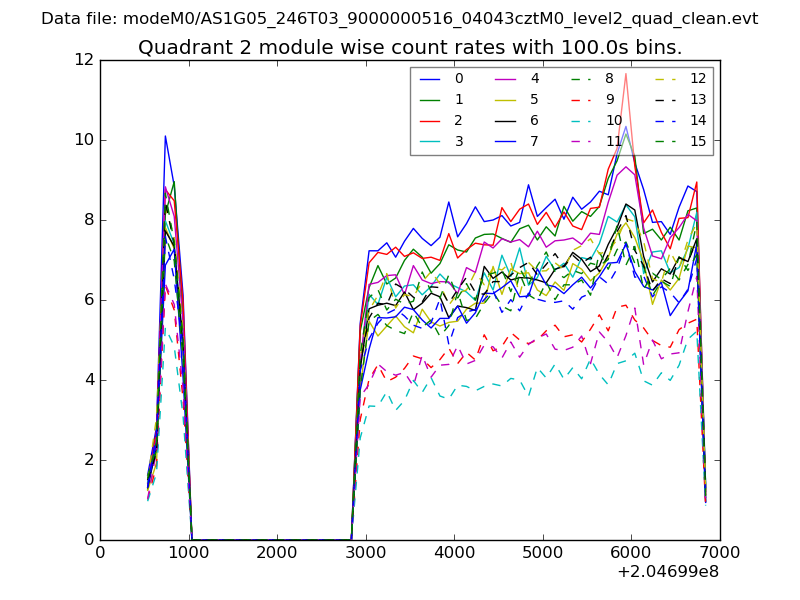
| Module-wise count rates for Quadrant B Data is divided into 100 sec bins |
 |
 |
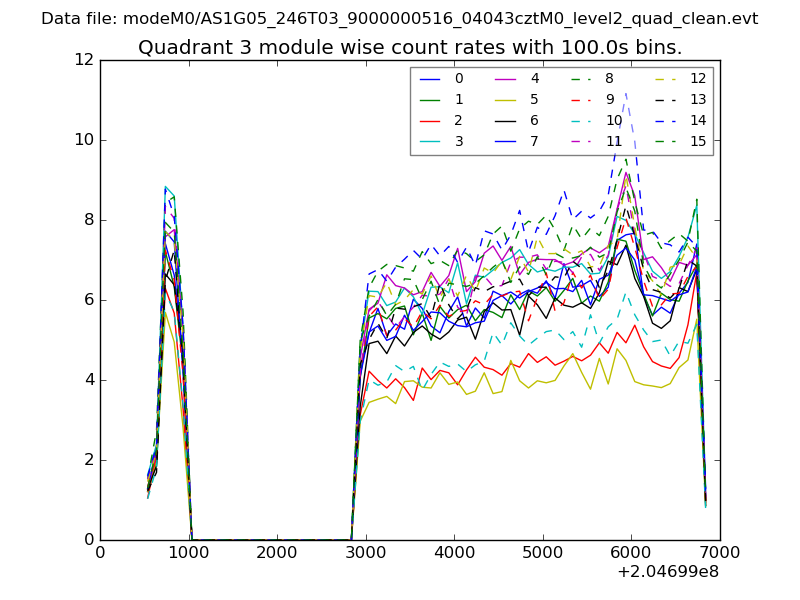
| Module-wise count rates for Quadrant C Data is divided into 100 sec bins |
 |
 |
| Module-wise count rates for Quadrant D Data is divided into 100 sec bins |
 |
 |
| Parameter | Plot |
|---|---|
| CZT HV Monitor | 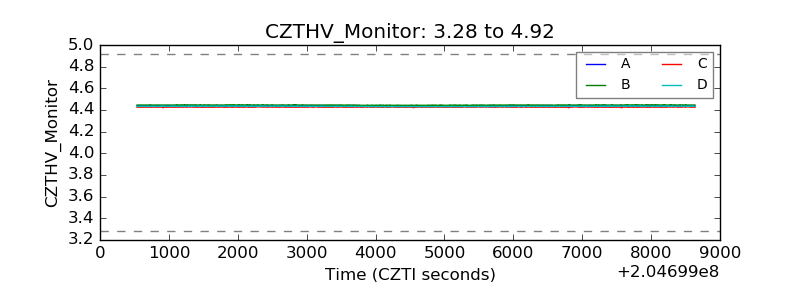 |
| D_VDD |  |
| Temperature 1 | 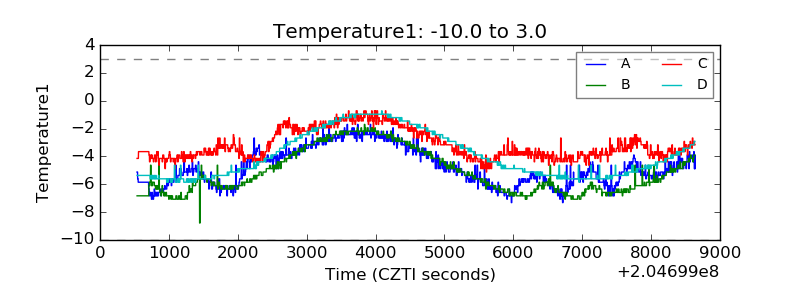 |
| Veto HV Monitor | 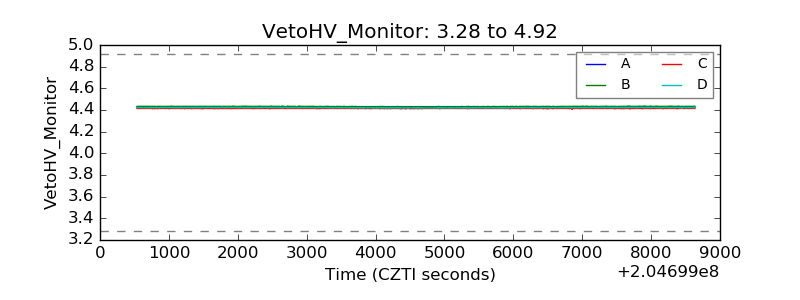 |
| Veto LLD | 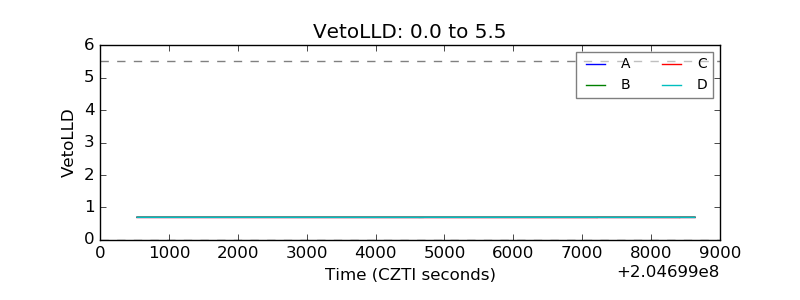 |
| Alpha Counter | 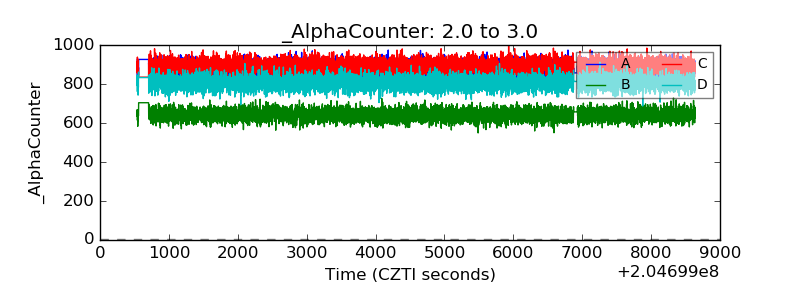 |
| _CPM_Rate | 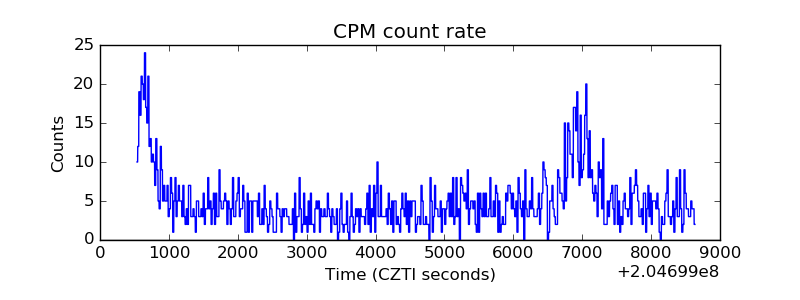 |
| CZT Counter | 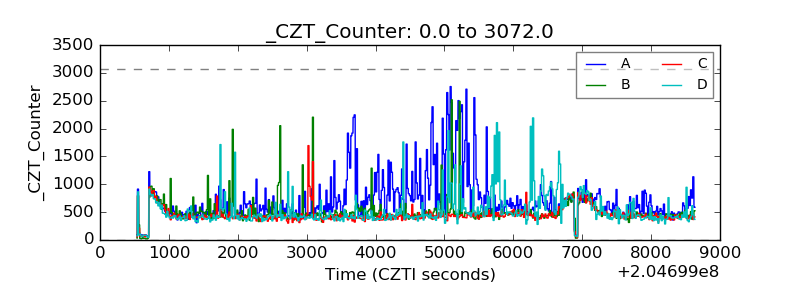 |
| +2.5 Volts monitor |  |
| +5 Volts monitor |  |
| _ROLL_ROT | 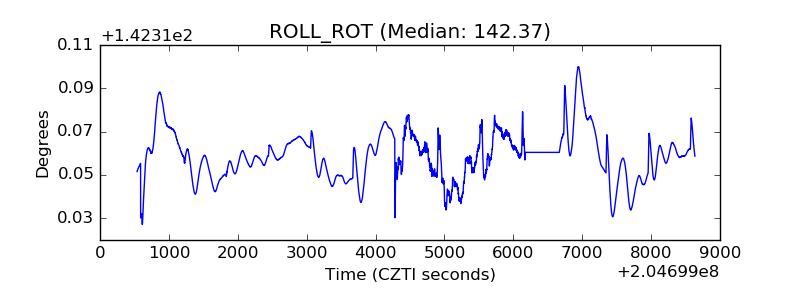 |
| _Roll_DEC | 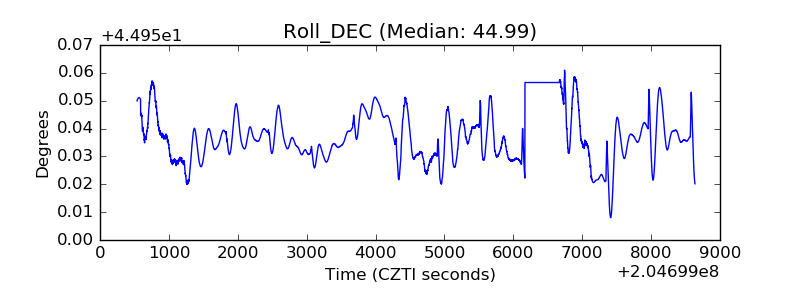 |
| _Roll_RA | 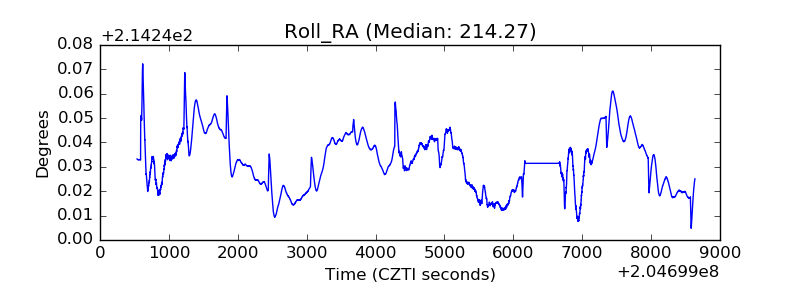 |
| Veto Counter | 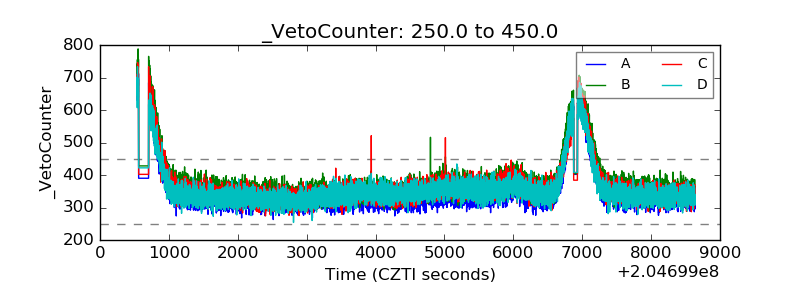 |