| Param | Original file | Final file |
|---|---|---|
| Filename | modeM0/AS1G05_246T03_9000000516_04044cztM0_level2.evt | modeM0/AS1G05_246T03_9000000516_04044cztM0_level2_quad_clean.evt |
| Size (bytes) | 279,135,360 | 31,749,120 |
| Size | 266.2 MB | 30.3 MB |
| Events in quadrant A | 2,763,441 | 171,188 |
| Events in quadrant B | 1,865,393 | 178,585 |
| Events in quadrant C | 1,723,996 | 175,715 |
| Events in quadrant D | 1,844,970 | 171,018 |
| Mode M9 | |||
|---|---|---|---|
| Quadrant | BADHDUFLAG | Total packets | Discarded packets |
| A | 0 | 1 | 0 |
| B | 0 | 1 | 0 |
| C | 0 | 1 | 0 |
| D | 0 | 1 | 0 |
| Mode M0 | |||
|---|---|---|---|
| Quadrant | BADHDUFLAG | Total packets | Discarded packets |
| A | 0 | 10936 | 159 |
| B | 0 | 8174 | 45 |
| C | 0 | 8000 | 46 |
| D | 0 | 8404 | 70 |
| Mode SS | |||
|---|---|---|---|
| Quadrant | BADHDUFLAG | Total packets | Discarded packets |
| A | 0 | 76 | 0 |
| B | 0 | 76 | 2 |
| C | 0 | 76 | 0 |
| D | 0 | 76 | 0 |
| Quadrant | Total seconds | Saturated seconds | Saturation percentage |
|---|---|---|---|
| A | 3732 | 395 | 10.584137% |
| B | 3747 | 285 | 7.606085% |
| C | 3745 | 205 | 5.473965% |
| D | 3735 | 230 | 6.157965% |
Noise dominated data is calculated using 1-second bins in cleaned event files. If a bin has >2000 counts, and if more than 50% of those come from <1% of pixels, then it is considered to be noise-dominated and hence unusable.
| Quadrant | # 1 sec bins | Bins with >0 counts | Bins with >2000 counts | High rate bins dominated by noise | Noise dominated (total time) | Noise dominated (detector-on time) | Marked lightcurve |
|---|---|---|---|---|---|---|---|
| A | 3822 | 3766 | 75 | 75 | 1.96% | 1.99% | 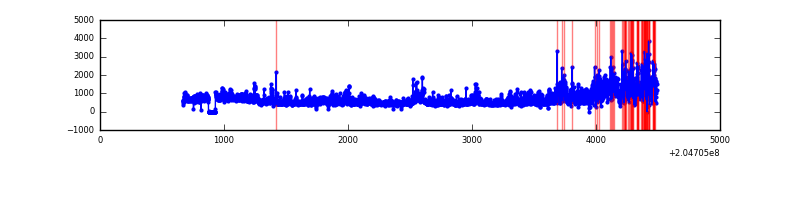 |
| B | 3822 | 3767 | 9 | 9 | 0.24% | 0.24% | 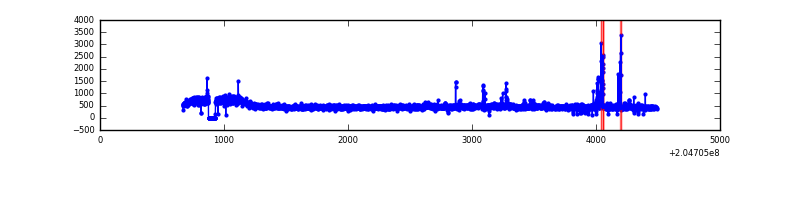 |
| C | 3822 | 3766 | 0 | 0 | 0.00% | 0.00% | 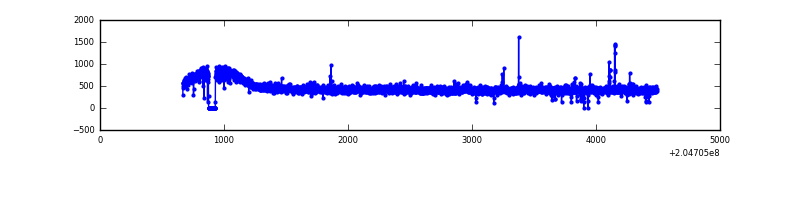 |
| D | 3822 | 3767 | 14 | 14 | 0.37% | 0.37% | 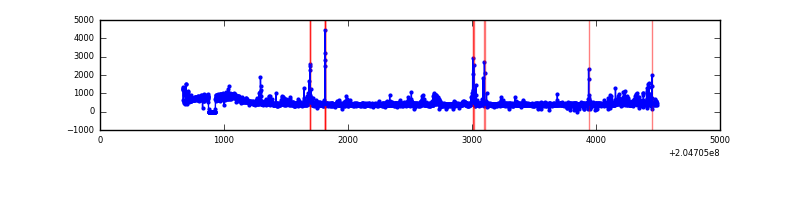 |
Top three noisy pixels from each quadrant. If the there are fewer than three noisy pixels in the level2.evt file, extra rows are filled as -1
| Pixel properties | Quadrant properties | ||||||
|---|---|---|---|---|---|---|---|
| Quadrant | DetID | PixID | Counts | Sigma | Mean | Median | Sigma |
| A | 8 | 15 | 613733 | 6673.04 | 433 | 421 | 91.9 |
| A | 0 | 199 | 207323 | 2251.16 | 433 | 421 | 91.9 |
| A | 0 | 118 | 141035 | 1529.92 | 433 | 421 | 91.9 |
| B | 15 | 204 | 37964 | 427.56 | 444 | 431 | 87.8 |
| B | 10 | 246 | 37127 | 418.02 | 444 | 431 | 87.8 |
| B | 14 | 167 | 24518 | 274.39 | 444 | 431 | 87.8 |
| C | 9 | 144 | 18768 | 181.46 | 429 | 429 | 101.1 |
| C | 8 | 128 | 12759 | 122.0 | 429 | 429 | 101.1 |
| C | 8 | 112 | 5402 | 49.21 | 429 | 429 | 101.1 |
| D | 13 | 239 | 63058 | 593.59 | 429 | 413 | 105.5 |
| D | 2 | 63 | 62716 | 590.35 | 429 | 413 | 105.5 |
| D | 10 | 246 | 44236 | 415.25 | 429 | 413 | 105.5 |
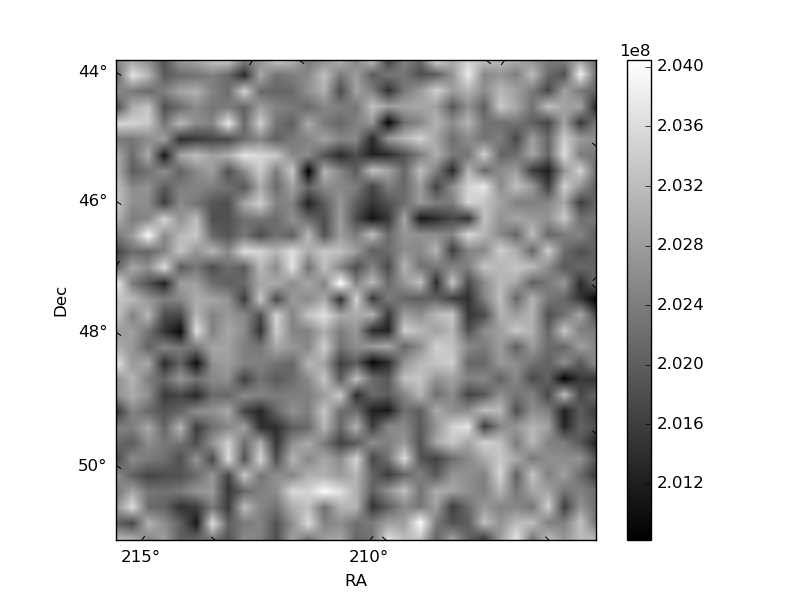
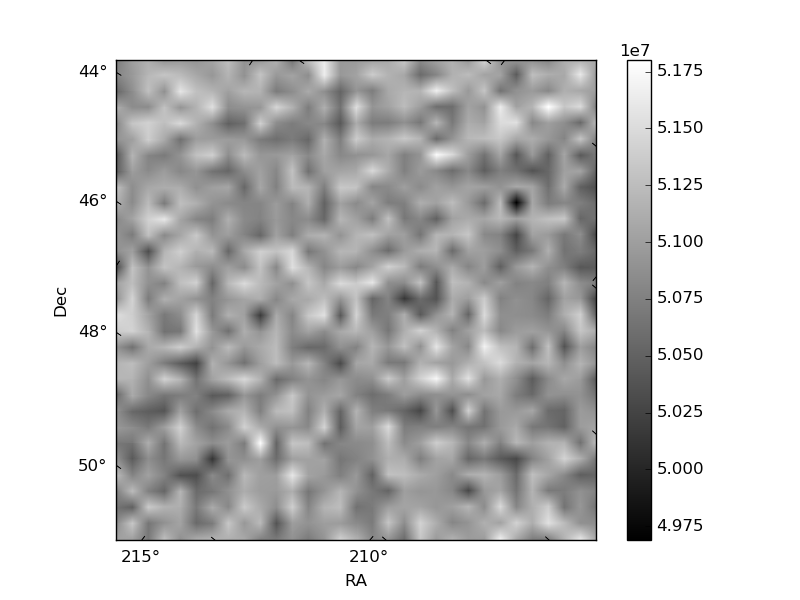
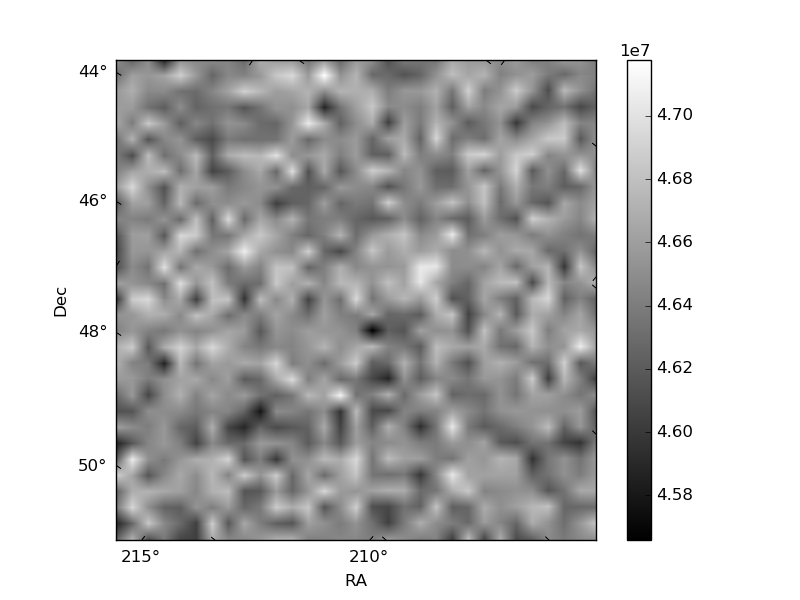
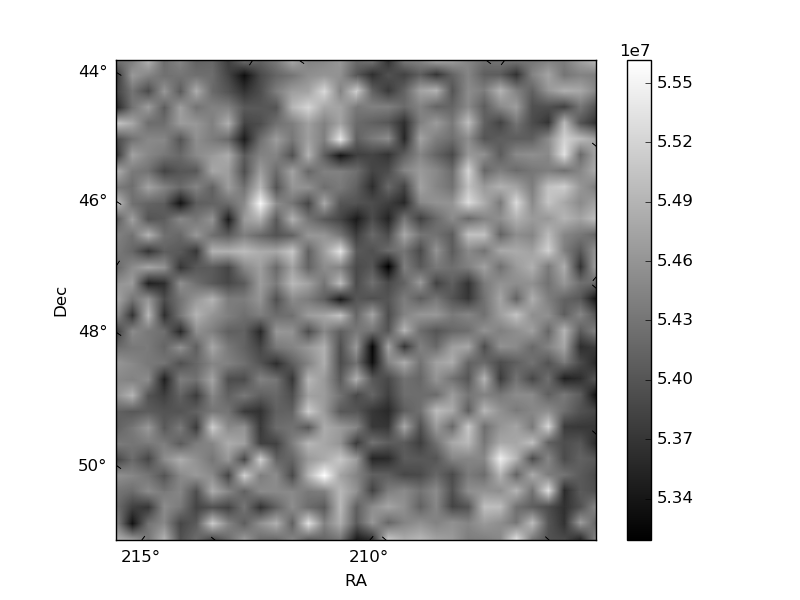
Histogram calculated using DETX and DETY for each event in the final _common_clean file
| Quadrant A | 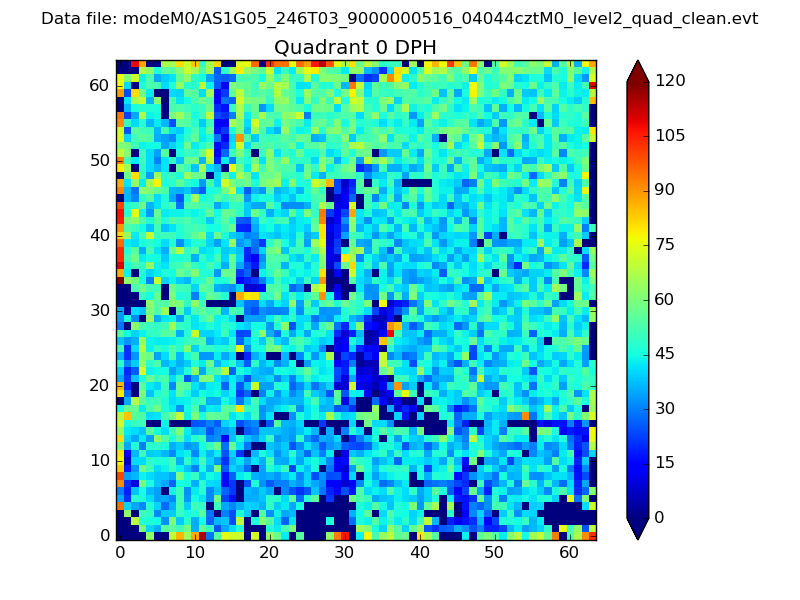 |
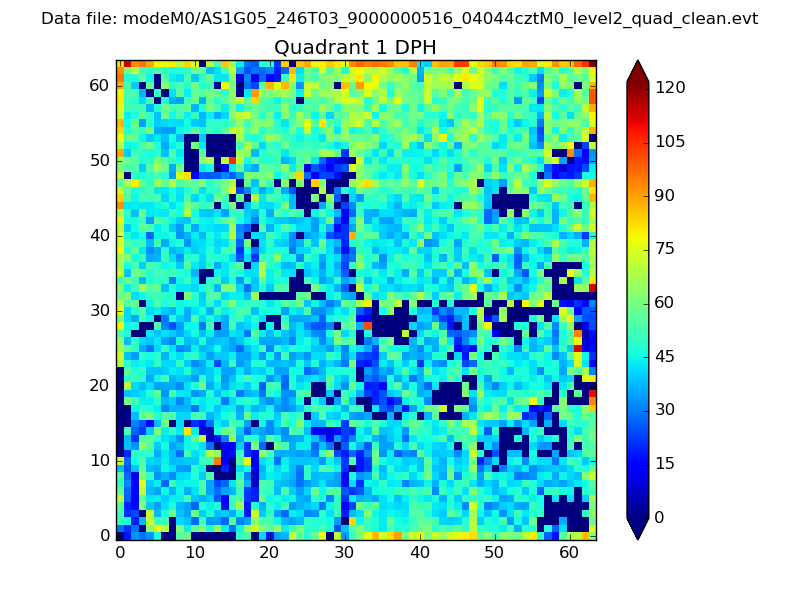 |
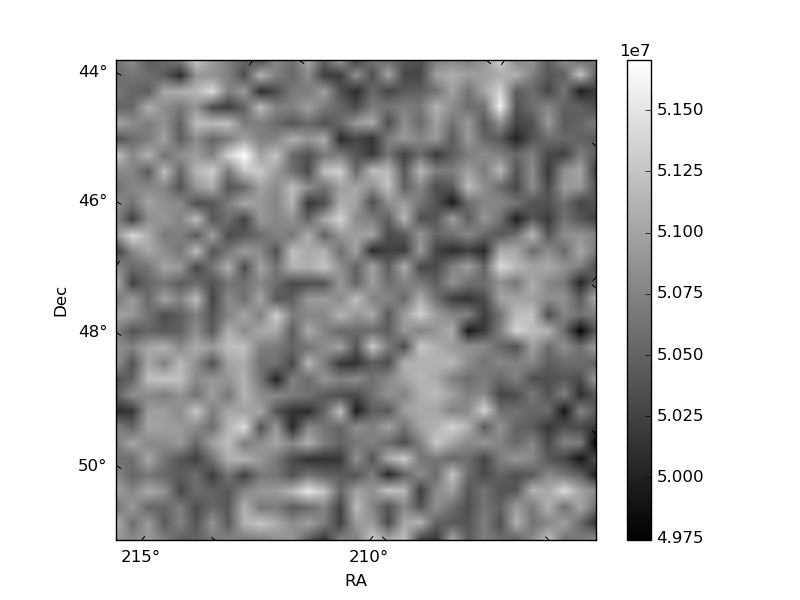
Quadrant B |
|---|---|---|---|
| Quadrant D | 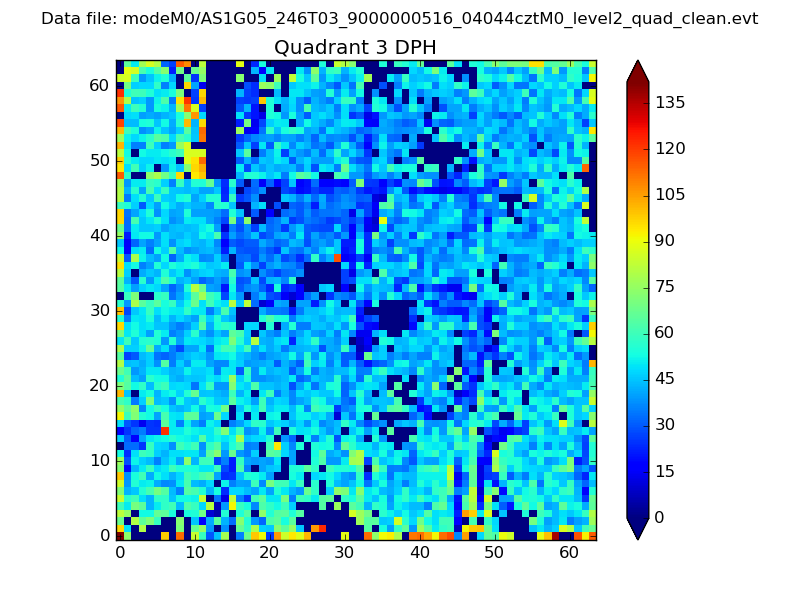 |
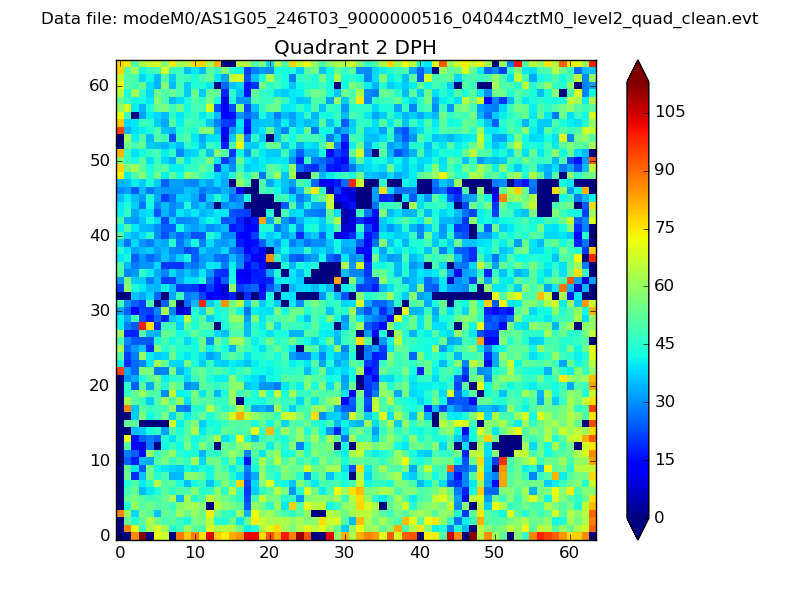 |
Quadrant C |
| Plot type | Count rate plots | Images |
|---|---|---|
| Comparison with Poisson distribution Blue bars denote a histogram of data divided into 1 sec bins. Red curve is a Poisson curve with rate = median count rate of data. |
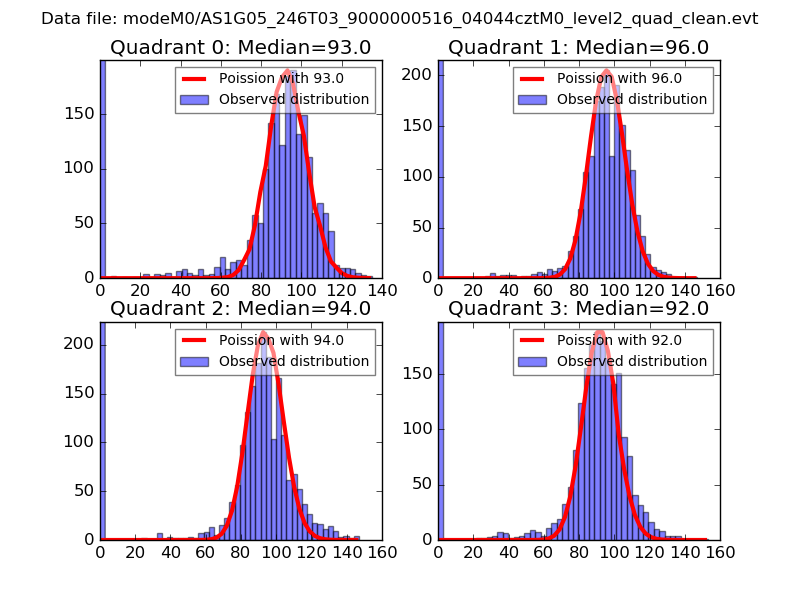 |
 |
| Quadrant-wise count rates Data is divided into 100 sec bins |
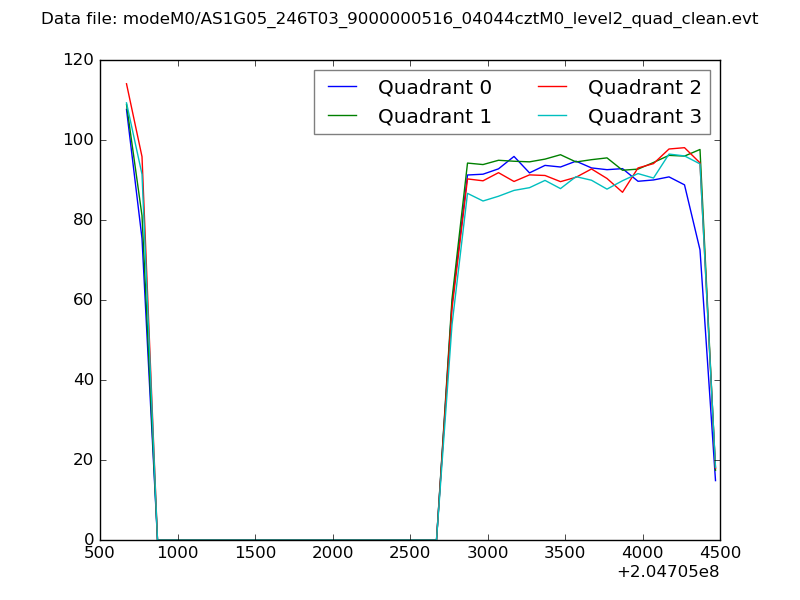 |
|
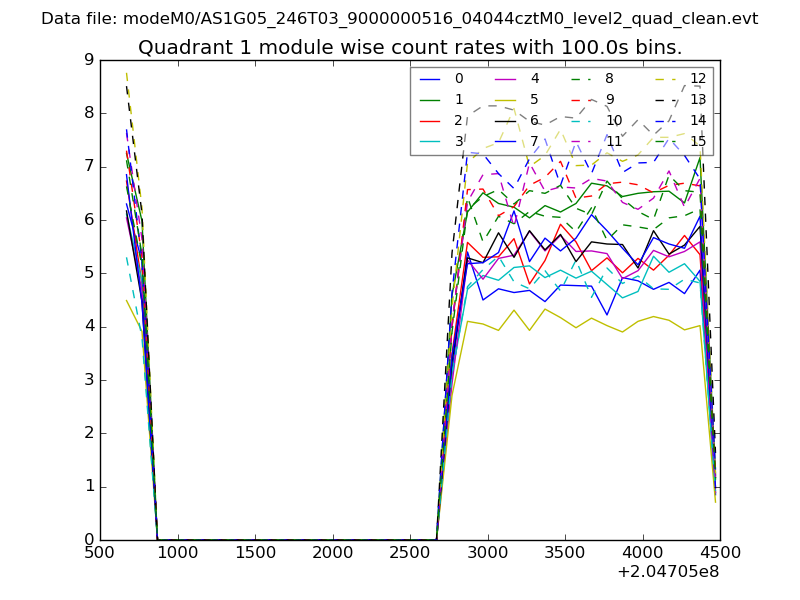
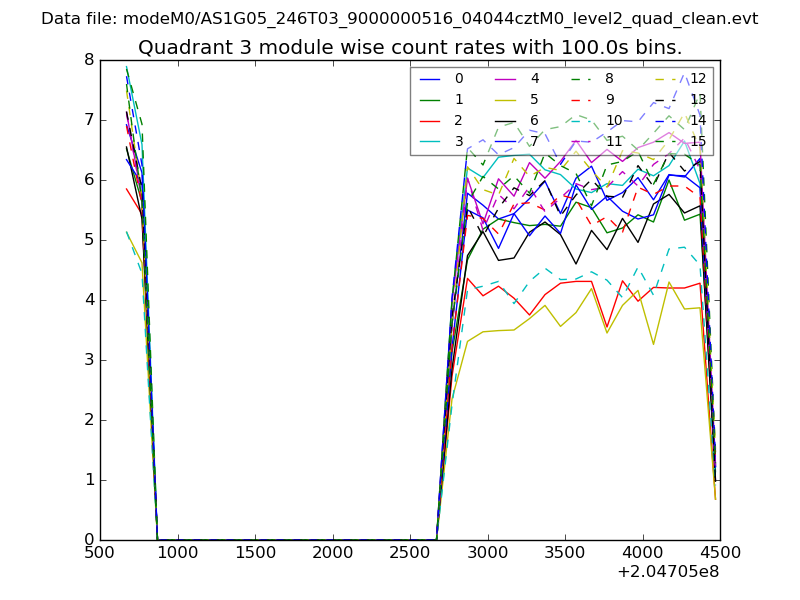
| Module-wise count rates for Quadrant A Data is divided into 100 sec bins |
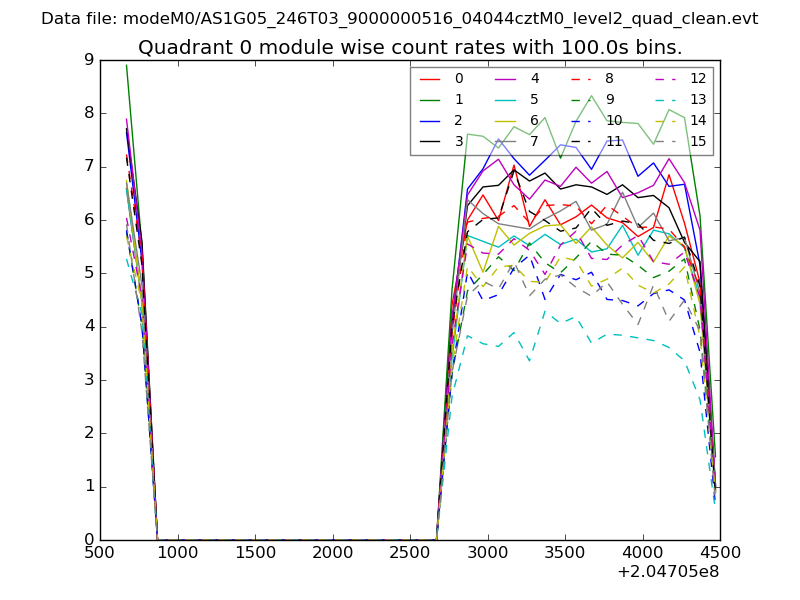 |
 |
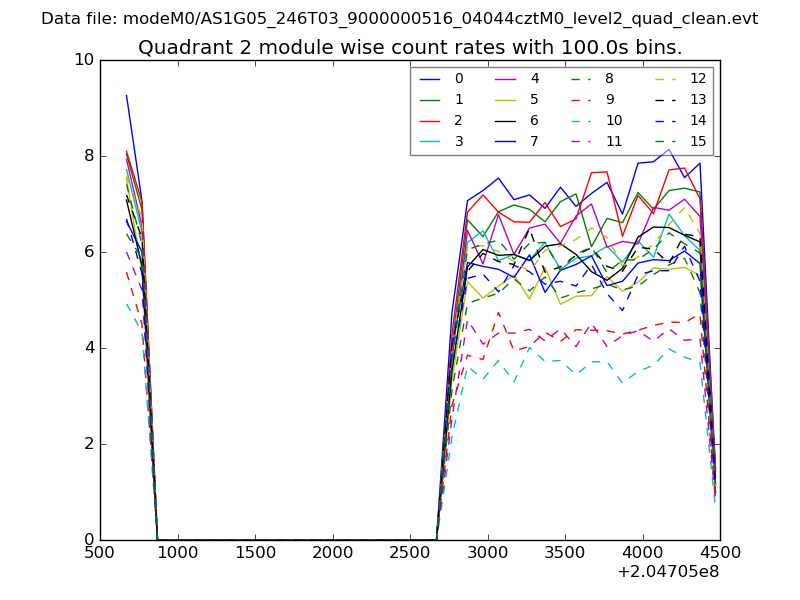
| Module-wise count rates for Quadrant B Data is divided into 100 sec bins |
 |
 |
| Module-wise count rates for Quadrant C Data is divided into 100 sec bins |
 |
 |
| Module-wise count rates for Quadrant D Data is divided into 100 sec bins |
 |
 |
| Parameter | Plot |
|---|---|
| CZT HV Monitor | 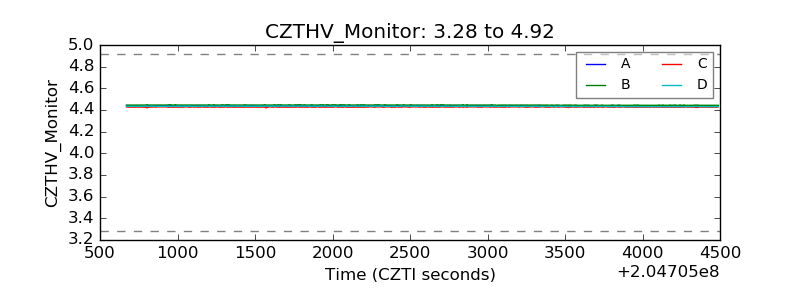 |
| D_VDD | 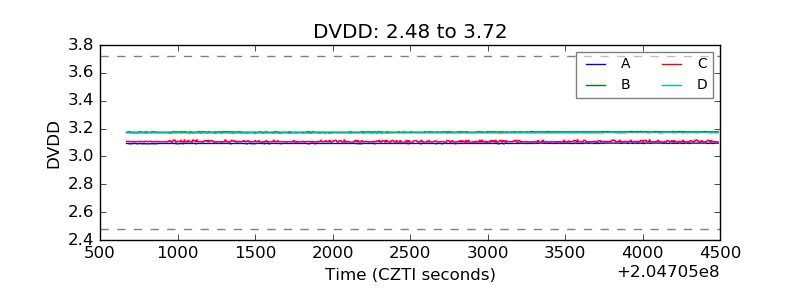 |
| Temperature 1 | 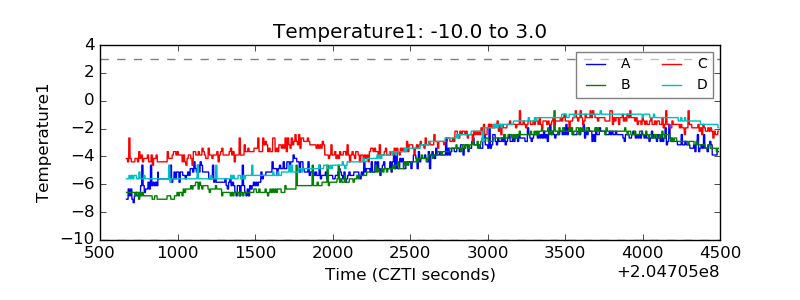 |
| Veto HV Monitor | 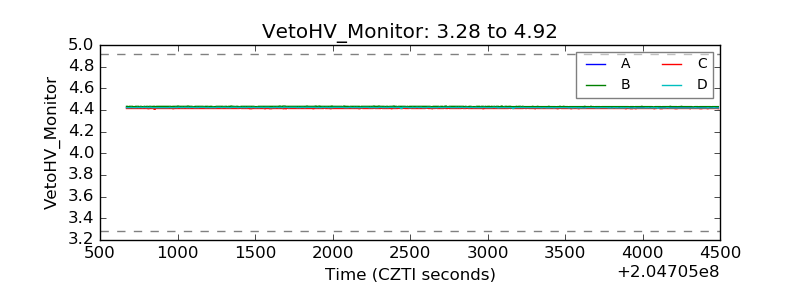 |
| Veto LLD | 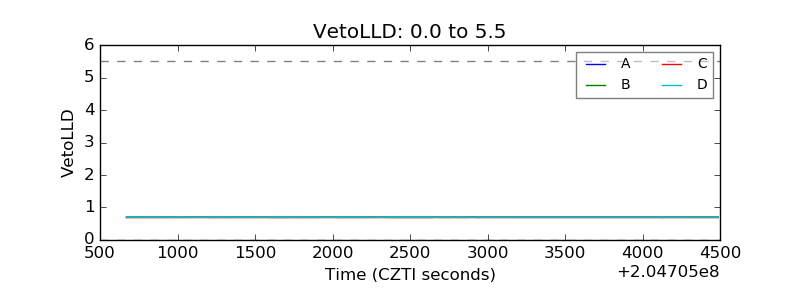 |
| Alpha Counter | 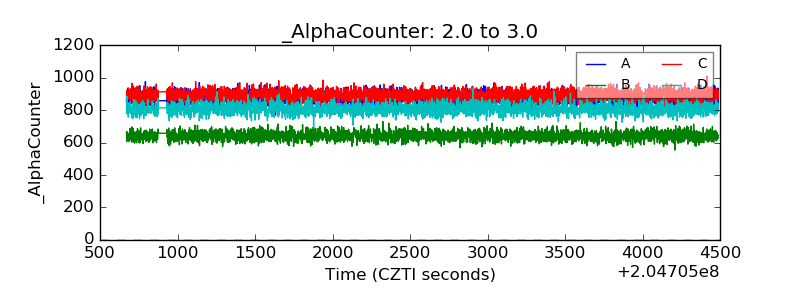 |
| _CPM_Rate | 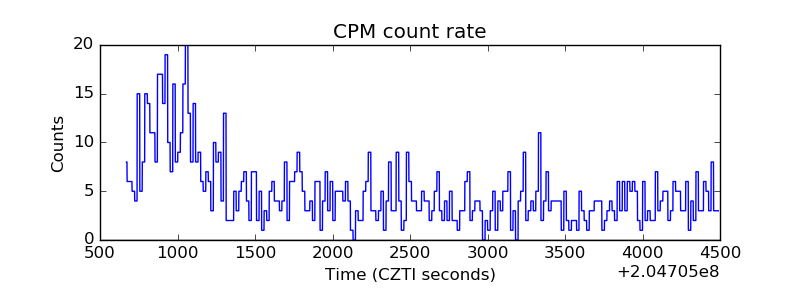 |
| CZT Counter | 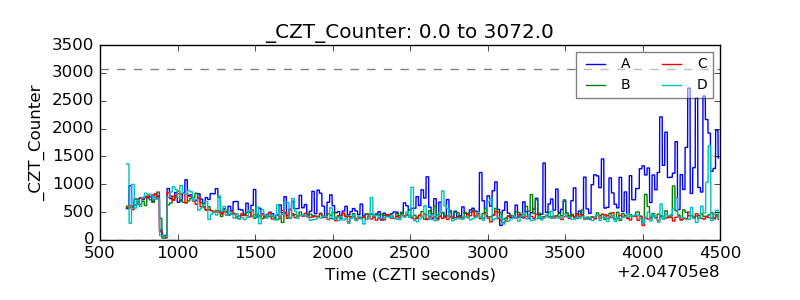 |
| +2.5 Volts monitor | 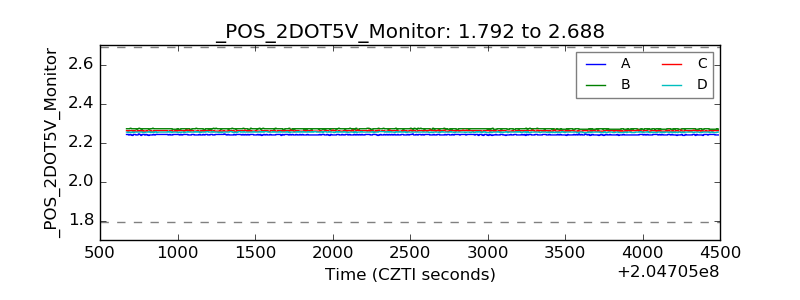 |
| +5 Volts monitor |  |
| _ROLL_ROT | 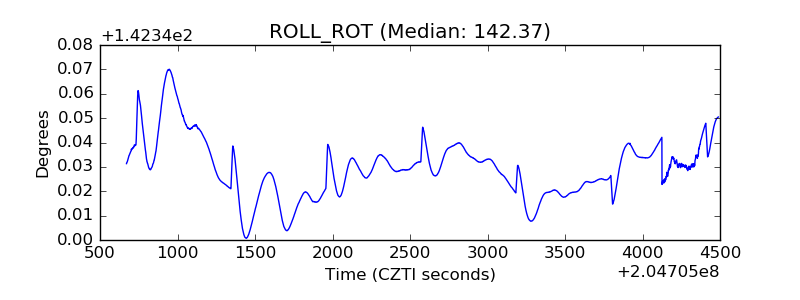 |
| _Roll_DEC | 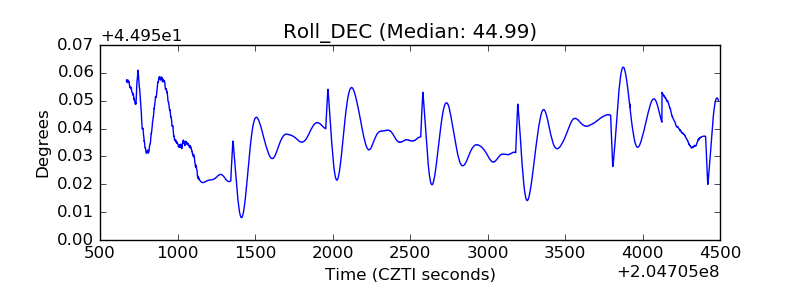 |
| _Roll_RA | 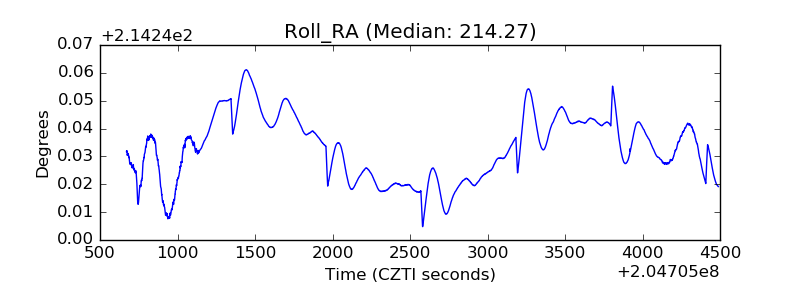 |
| Veto Counter | 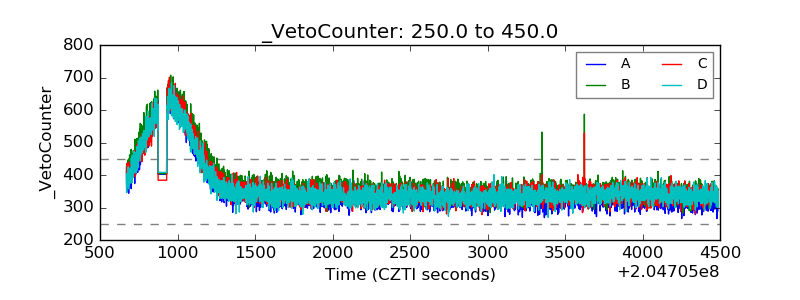 |