| Param | Original file | Final file |
|---|---|---|
| Filename | modeM0/AS1G05_241T04_9000000518cztM0_level2.fits | modeM0/AS1G05_241T04_9000000518cztM0_level2_quad_clean.evt |
| Size (bytes) | 1,055,721,600 | 1,062,512,640 |
| Size | 1006.8 MB | 1013.3 MB |
| Events in quadrant A | 6,265,374 | 6,284,131 |
| Events in quadrant B | 6,127,762 | 6,369,848 |
| Events in quadrant C | 6,272,406 | 6,057,678 |
| Events in quadrant D | 5,394,166 | 5,557,522 |
| Mode SS | |||
|---|---|---|---|
| Quadrant | BADHDUFLAG | Total packets | Discarded packets |
| A | 0 | 2342 | 0 |
| B | 0 | 2340 | 0 |
| C | 0 | 2342 | 0 |
| D | 0 | 2342 | 0 |
| Mode M0 | |||
|---|---|---|---|
| Quadrant | BADHDUFLAG | Total packets | Discarded packets |
| A | 0 | 259446 | 0 |
| B | 0 | 249521 | 0 |
| C | 0 | 237280 | 0 |
| D | 0 | 260652 | 0 |
| Mode M9 | |||
|---|---|---|---|
| Quadrant | BADHDUFLAG | Total packets | Discarded packets |
| A | 0 | 194 | 0 |
| B | 0 | 194 | 0 |
| C | 0 | 194 | 0 |
| D | 0 | 194 | 0 |
| Quadrant | Total seconds | Saturated seconds | Saturation percentage |
|---|---|---|---|
| A | 115462 | 3360 | 2.910048% |
| B | 115469 | 1954 | 1.692229% |
| C | 115460 | 981 | 0.849645% |
| D | 115478 | 2506 | 2.170110% |
Noise dominated data is calculated using 1-second bins in cleaned event files. If a bin has >2000 counts, and if more than 50% of those come from <1% of pixels, then it is considered to be noise-dominated and hence unusable.
| Quadrant | # 1 sec bins | Bins with >0 counts | Bins with >2000 counts | High rate bins dominated by noise | Noise dominated (total time) | Noise dominated (detector-on time) | Marked lightcurve |
|---|---|---|---|---|---|---|---|
| A | 134515 | 115323 | 0 | 0 | 0.00% | 0.00% |  |
| B | 134515 | 115510 | 0 | 0 | 0.00% | 0.00% |  |
| C | 134515 | 115514 | 0 | 0 | 0.00% | 0.00% |  |
| D | 134515 | 115490 | 0 | 0 | 0.00% | 0.00% |  |
Top three noisy pixels from each quadrant. If the there are fewer than three noisy pixels in the level2.evt file, extra rows are filled as -1
| Pixel properties | Quadrant properties | ||||||
|---|---|---|---|---|---|---|---|
| Quadrant | DetID | PixID | Counts | Sigma | Mean | Median | Sigma |
| A | 14 | 188 | 6041 | 10.8 | 1627 | 1515 | 419.2 |
| A | 0 | 29 | 6036 | 10.79 | 1627 | 1515 | 419.2 |
| A | 14 | 204 | 5398 | 9.26 | 1627 | 1515 | 419.2 |
| B | 2 | 9 | 5375 | 11.69 | 1620 | 1536 | 328.4 |
| B | 12 | 226 | 4433 | 8.82 | 1620 | 1536 | 328.4 |
| B | 14 | 254 | 4231 | 8.21 | 1620 | 1536 | 328.4 |
| C | 1 | 80 | 4506 | 6.72 | 1655 | 1527 | 443.1 |
| C | 12 | 241 | 4487 | 6.68 | 1655 | 1527 | 443.1 |
| C | 1 | 81 | 4337 | 6.34 | 1655 | 1527 | 443.1 |
| D | 11 | 82 | 4555 | 7.64 | 1536 | 1391 | 414.1 |
| D | 3 | 14 | 4035 | 6.38 | 1536 | 1391 | 414.1 |
| D | 6 | 83 | 3939 | 6.15 | 1536 | 1391 | 414.1 |
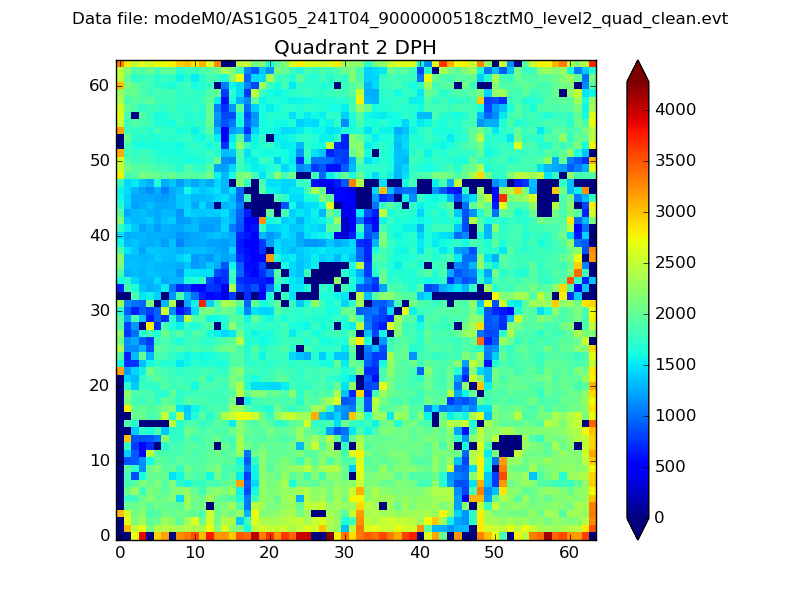
Histogram calculated using DETX and DETY for each event in the final _common_clean file
| Quadrant A |  |
 |
Quadrant B |
|---|---|---|---|
| Quadrant D | 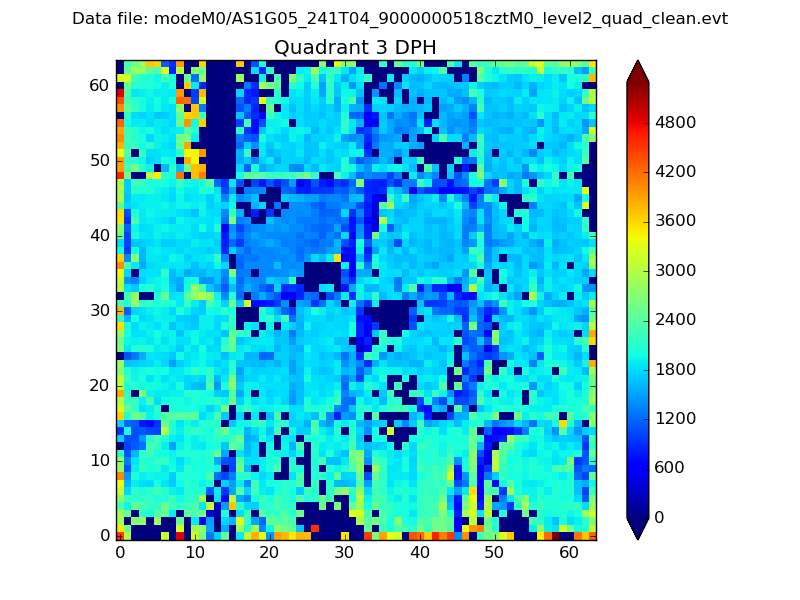 |
 |
Quadrant C |
| Plot type | Count rate plots | Images |
|---|---|---|
| Comparison with Poisson distribution Blue bars denote a histogram of data divided into 1 sec bins. Red curve is a Poisson curve with rate = median count rate of data. |
 |
 |
| Quadrant-wise count rates Data is divided into 100 sec bins |
 |
|
| Module-wise count rates for Quadrant A Data is divided into 100 sec bins |
 |
 |
| Module-wise count rates for Quadrant B Data is divided into 100 sec bins |
 |
 |
| Module-wise count rates for Quadrant C Data is divided into 100 sec bins |
 |
 |
| Module-wise count rates for Quadrant D Data is divided into 100 sec bins |
 |
 |
| Parameter | Plot |
|---|---|
| CZT HV Monitor |  |
| D_VDD | 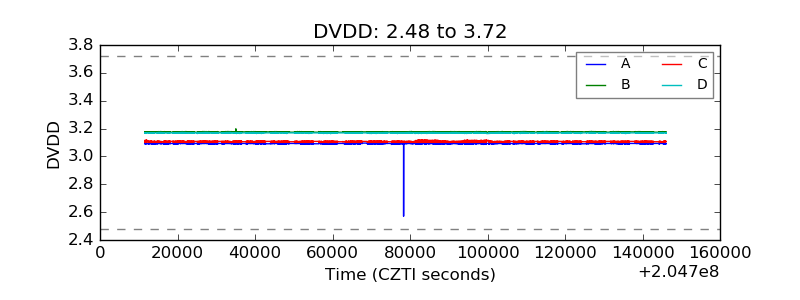 |
| Temperature 1 |  |
| Veto HV Monitor |  |
| Veto LLD |  |
| Alpha Counter |  |
| _CPM_Rate |  |
| CZT Counter |  |
| +2.5 Volts monitor |  |
| +5 Volts monitor |  |
| _ROLL_ROT |  |
| _Roll_DEC |  |
| _Roll_RA |  |
| Veto Counter |  |