| Param | Original file | Final file |
|---|---|---|
| Filename | modeM0/AS1G05_241T04_9000000518_04046cztM0_level2.evt | modeM0/AS1G05_241T04_9000000518_04046cztM0_level2_quad_clean.evt |
| Size (bytes) | 869,863,680 | 140,132,160 |
| Size | 829.6 MB | 133.6 MB |
| Events in quadrant A | 6,908,578 | 833,332 |
| Events in quadrant B | 6,979,589 | 851,149 |
| Events in quadrant C | 5,714,469 | 848,567 |
| Events in quadrant D | 5,869,002 | 820,851 |
| Mode SS | |||
|---|---|---|---|
| Quadrant | BADHDUFLAG | Total packets | Discarded packets |
| A | 0 | 262 | 0 |
| B | 0 | 262 | 2 |
| C | 0 | 262 | 0 |
| D | 0 | 262 | 0 |
| Mode M0 | |||
|---|---|---|---|
| Quadrant | BADHDUFLAG | Total packets | Discarded packets |
| A | 0 | 29307 | 147 |
| B | 0 | 29552 | 142 |
| C | 0 | 26537 | 138 |
| D | 0 | 27285 | 109 |
| Mode M9 | |||
|---|---|---|---|
| Quadrant | BADHDUFLAG | Total packets | Discarded packets |
| A | 0 | 15 | 0 |
| B | 0 | 15 | 0 |
| C | 0 | 15 | 0 |
| D | 0 | 15 | 0 |
| Quadrant | Total seconds | Saturated seconds | Saturation percentage |
|---|---|---|---|
| A | 12866 | 426 | 3.311052% |
| B | 12874 | 411 | 3.192481% |
| C | 12864 | 186 | 1.445896% |
| D | 12881 | 253 | 1.964133% |
Noise dominated data is calculated using 1-second bins in cleaned event files. If a bin has >2000 counts, and if more than 50% of those come from <1% of pixels, then it is considered to be noise-dominated and hence unusable.
| Quadrant | # 1 sec bins | Bins with >0 counts | Bins with >2000 counts | High rate bins dominated by noise | Noise dominated (total time) | Noise dominated (detector-on time) | Marked lightcurve |
|---|---|---|---|---|---|---|---|
| A | 14454 | 12928 | 135 | 135 | 0.93% | 1.04% | 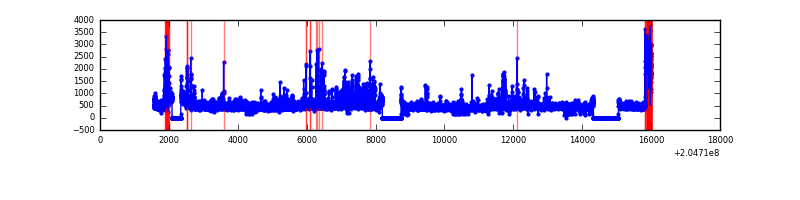 |
| B | 14454 | 12929 | 149 | 149 | 1.03% | 1.15% | 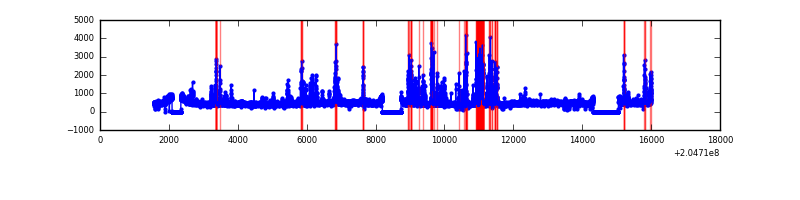 |
| C | 14454 | 12928 | 6 | 6 | 0.04% | 0.05% | 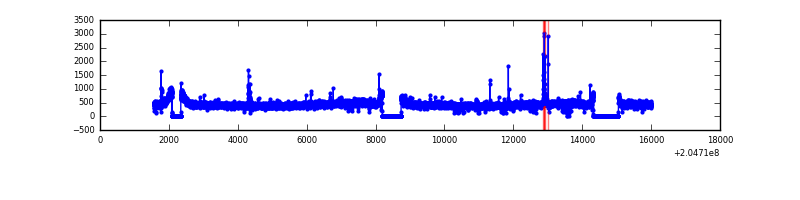 |
| D | 14453 | 12927 | 60 | 60 | 0.42% | 0.46% | 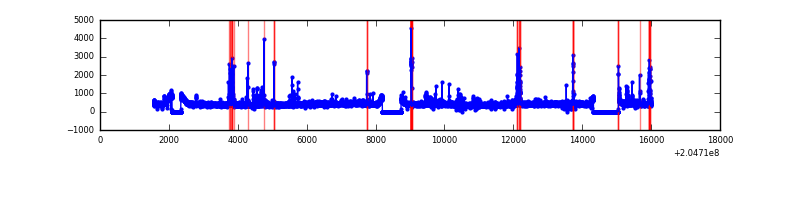 |
Top three noisy pixels from each quadrant. If the there are fewer than three noisy pixels in the level2.evt file, extra rows are filled as -1
| Pixel properties | Quadrant properties | ||||||
|---|---|---|---|---|---|---|---|
| Quadrant | DetID | PixID | Counts | Sigma | Mean | Median | Sigma |
| A | 0 | 199 | 279881 | 926.02 | 1466 | 1431 | 300.7 |
| A | 0 | 5 | 270762 | 895.7 | 1466 | 1431 | 300.7 |
| A | 14 | 111 | 230543 | 761.94 | 1466 | 1431 | 300.7 |
| B | 14 | 167 | 840300 | 2889.0 | 1485 | 1443 | 290.4 |
| B | 7 | 252 | 266493 | 912.82 | 1485 | 1443 | 290.4 |
| B | 15 | 204 | 57956 | 194.63 | 1485 | 1443 | 290.4 |
| C | 1 | 16 | 54042 | 156.48 | 1439 | 1448 | 336.1 |
| C | 9 | 144 | 26598 | 74.83 | 1439 | 1448 | 336.1 |
| C | 13 | 61 | 11940 | 31.22 | 1439 | 1448 | 336.1 |
| D | 13 | 239 | 139978 | 392.2 | 1443 | 1393 | 353.4 |
| D | 2 | 14 | 90582 | 252.41 | 1443 | 1393 | 353.4 |
| D | 12 | 110 | 50882 | 140.05 | 1443 | 1393 | 353.4 |
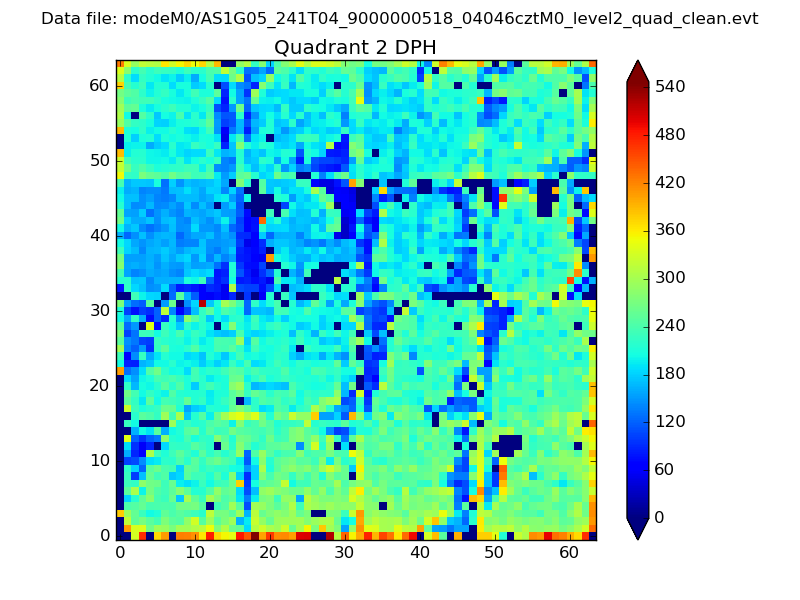
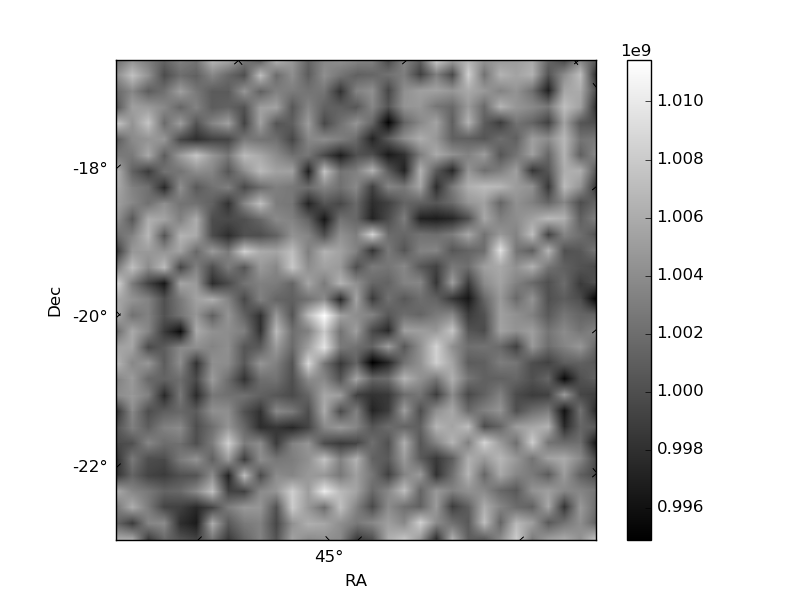
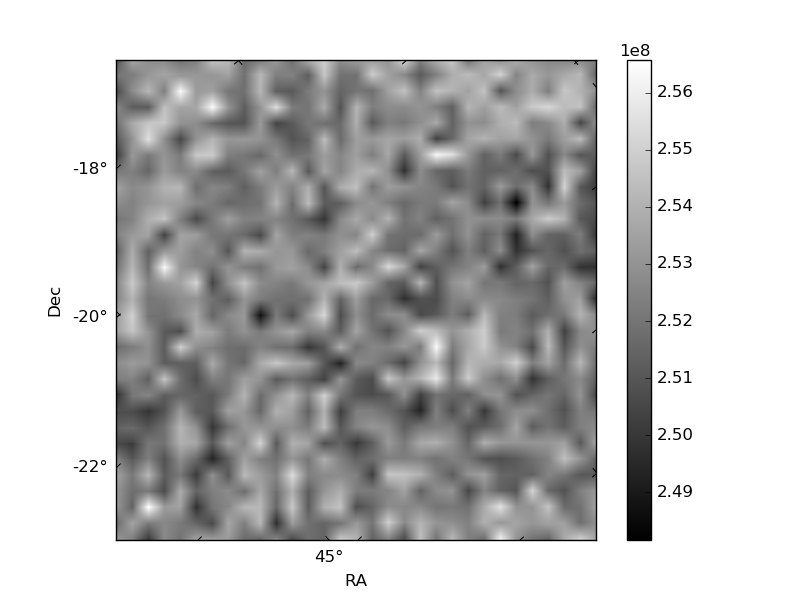
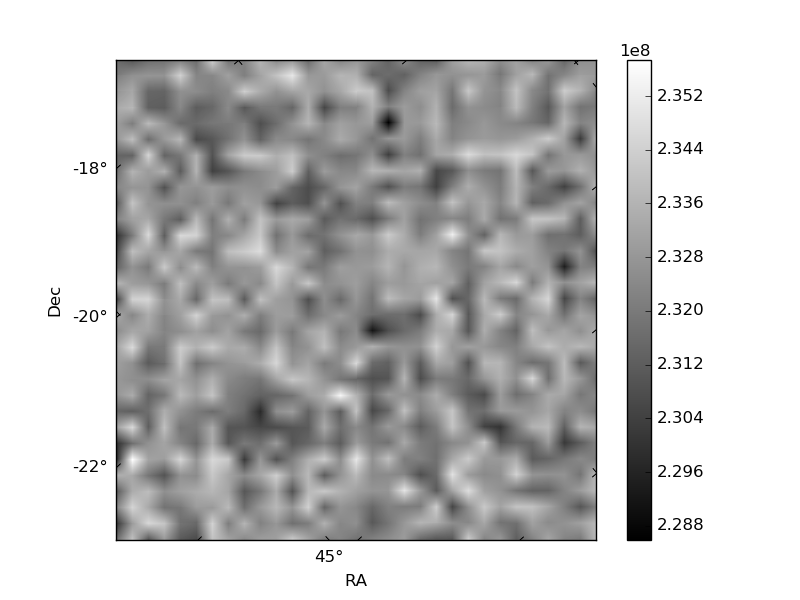
Histogram calculated using DETX and DETY for each event in the final _common_clean file
| Quadrant A | 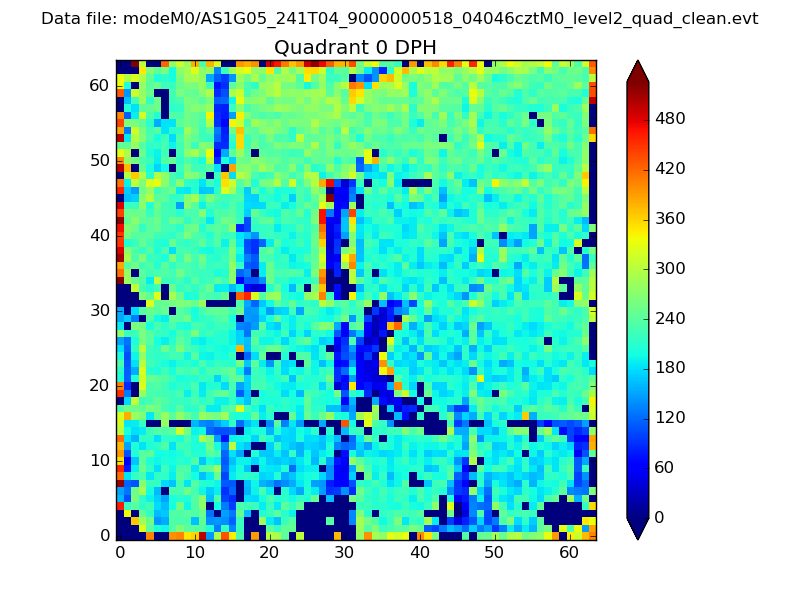 |
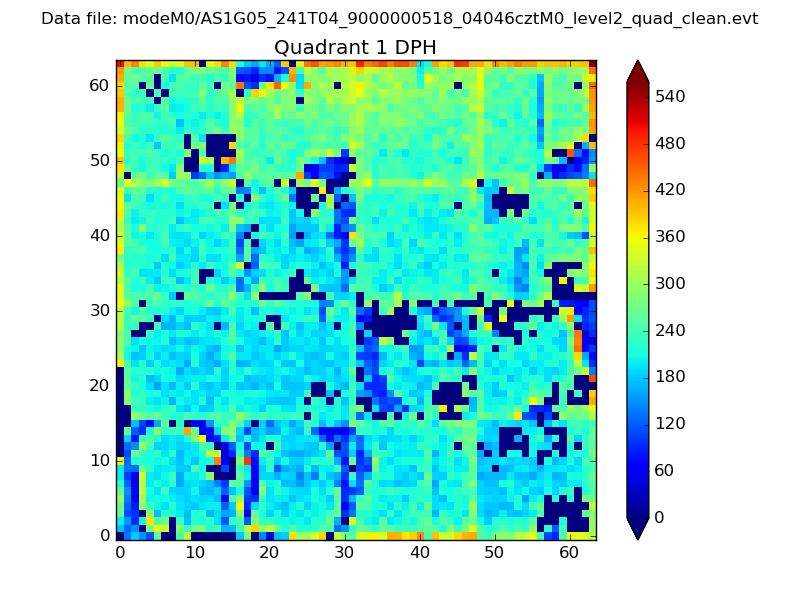 |
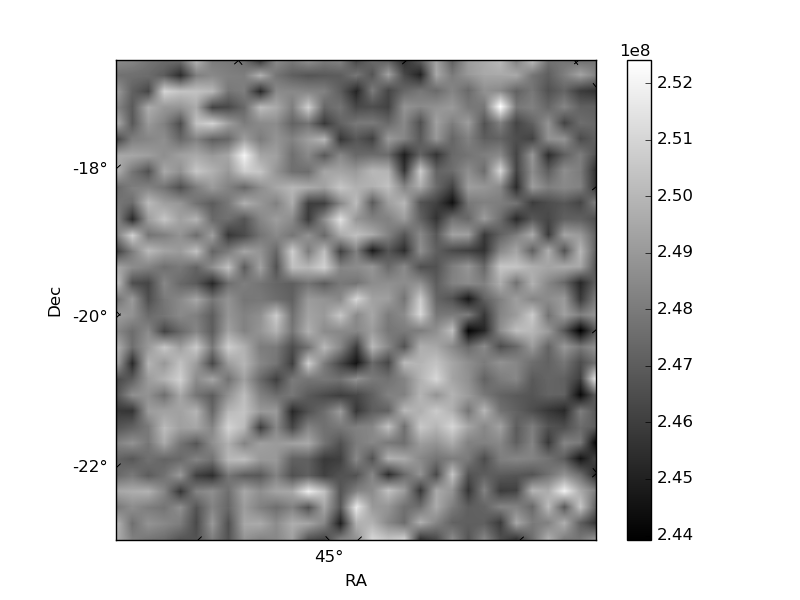
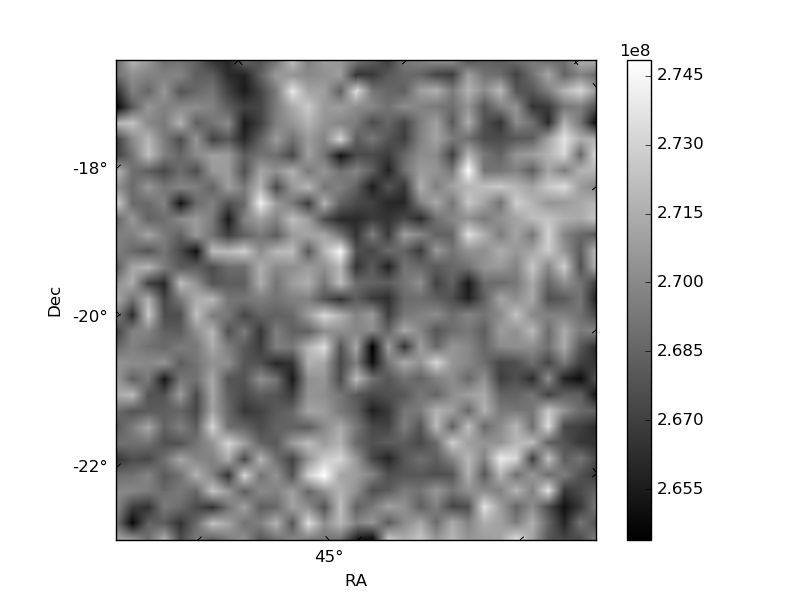
Quadrant B |
|---|---|---|---|
| Quadrant D | 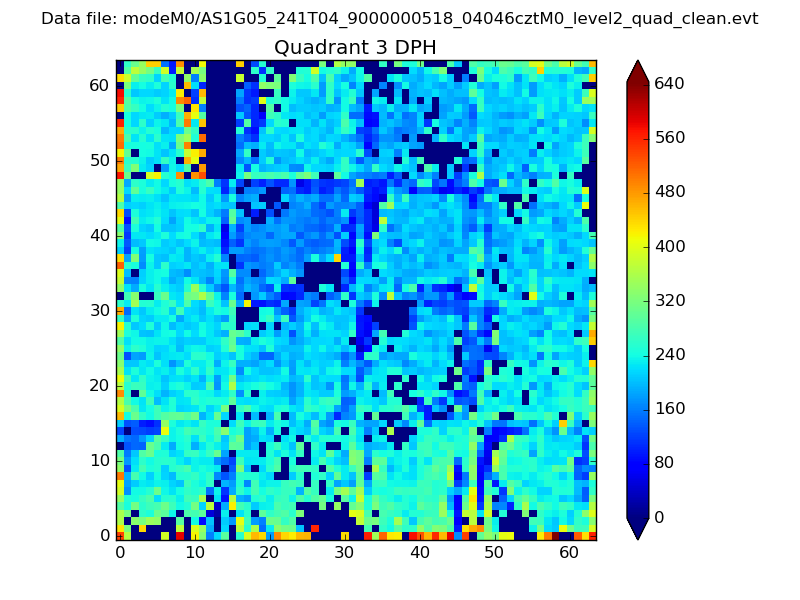 |
 |
Quadrant C |
| Plot type | Count rate plots | Images |
|---|---|---|
| Comparison with Poisson distribution Blue bars denote a histogram of data divided into 1 sec bins. Red curve is a Poisson curve with rate = median count rate of data. |
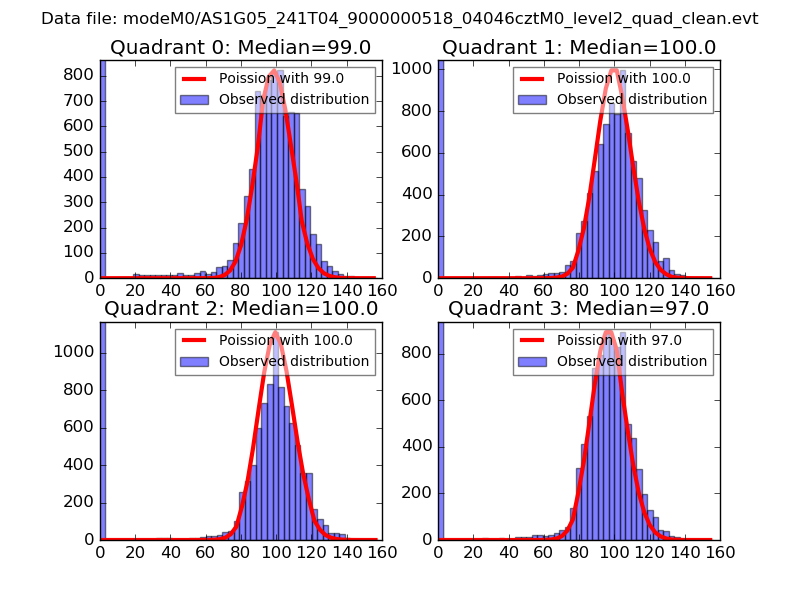 |
 |
| Quadrant-wise count rates Data is divided into 100 sec bins |
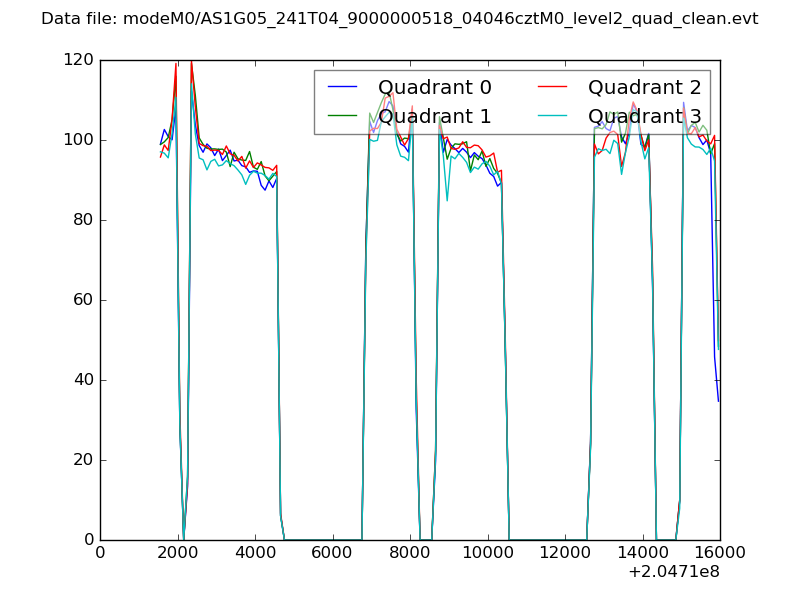 |
|
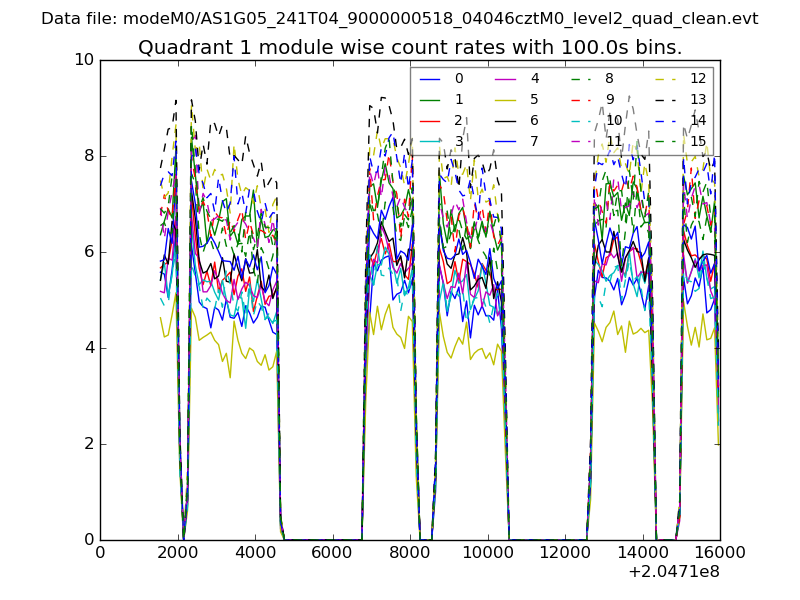
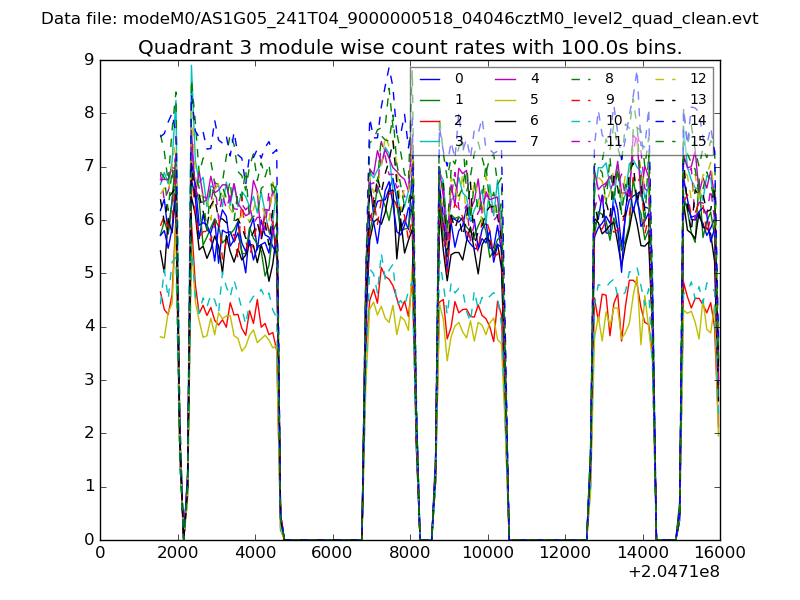
| Module-wise count rates for Quadrant A Data is divided into 100 sec bins |
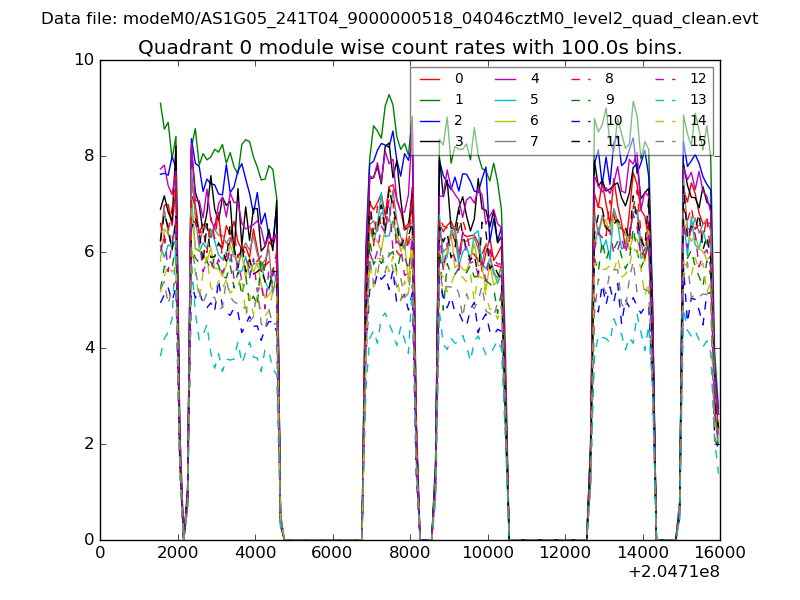 |
 |
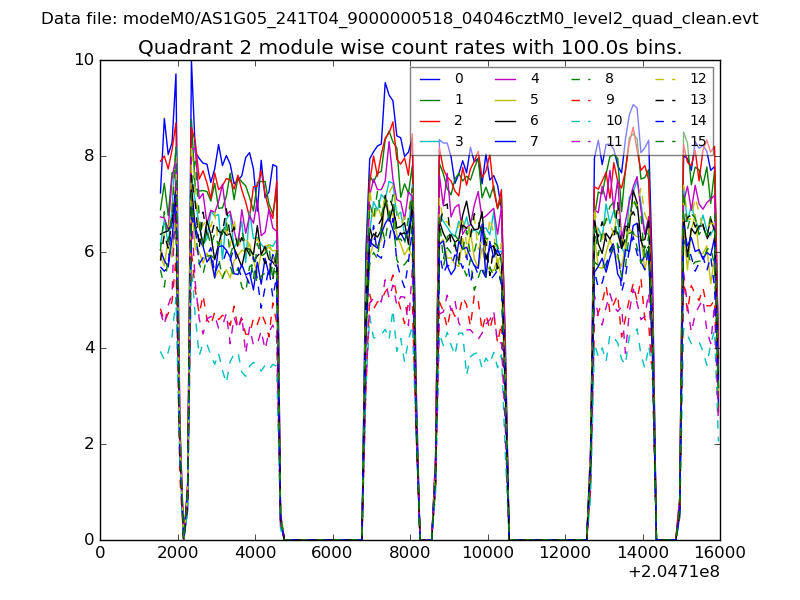
| Module-wise count rates for Quadrant B Data is divided into 100 sec bins |
 |
 |
| Module-wise count rates for Quadrant C Data is divided into 100 sec bins |
 |
 |
| Module-wise count rates for Quadrant D Data is divided into 100 sec bins |
 |
 |
| Parameter | Plot |
|---|---|
| CZT HV Monitor | 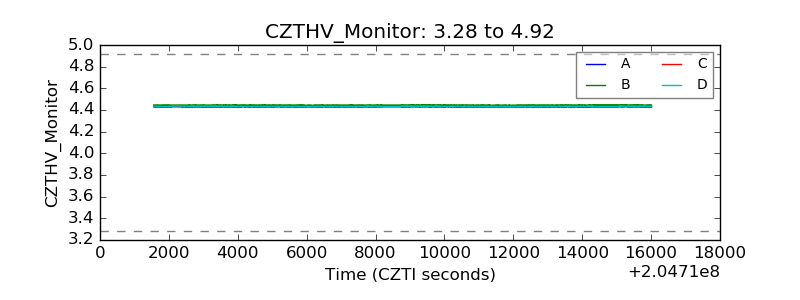 |
| D_VDD | 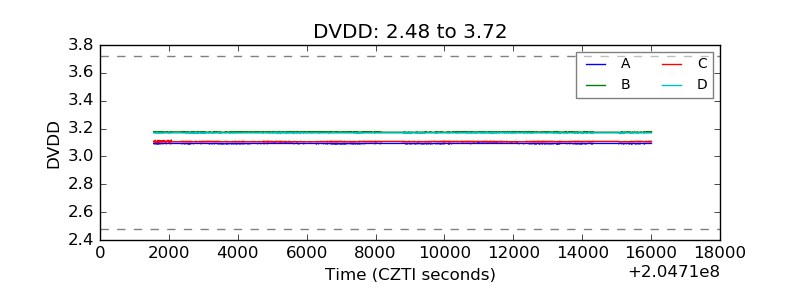 |
| Temperature 1 | 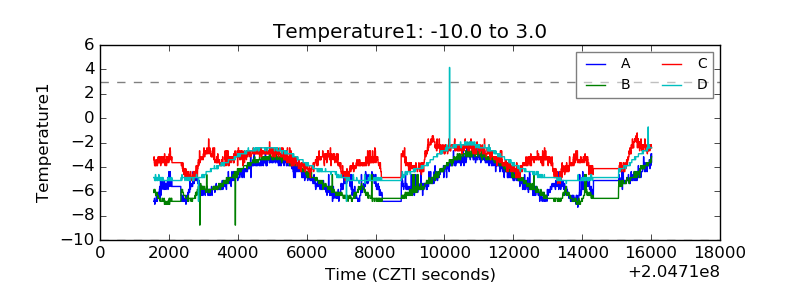 |
| Veto HV Monitor | 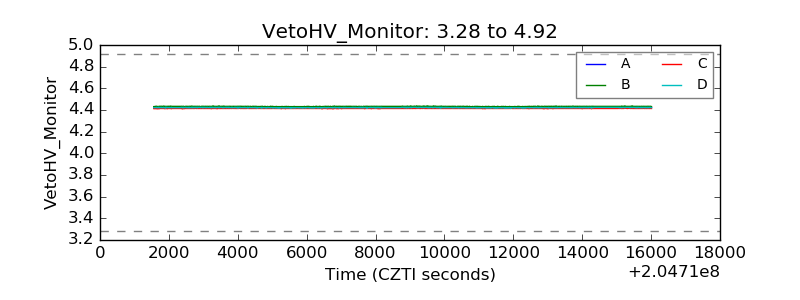 |
| Veto LLD | 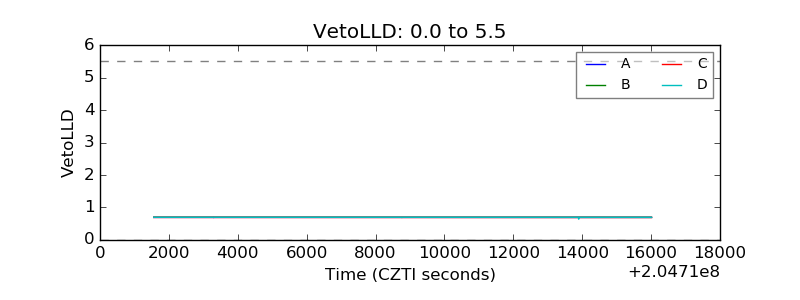 |
| Alpha Counter | 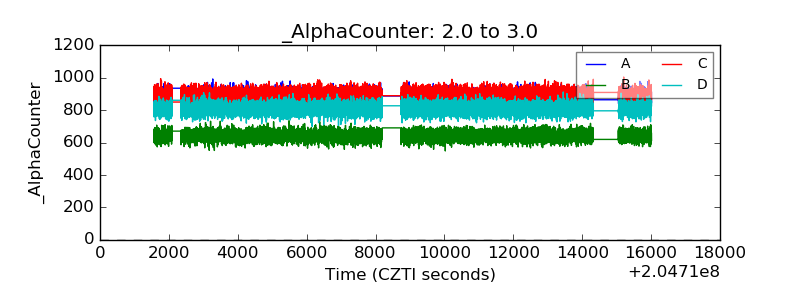 |
| _CPM_Rate | 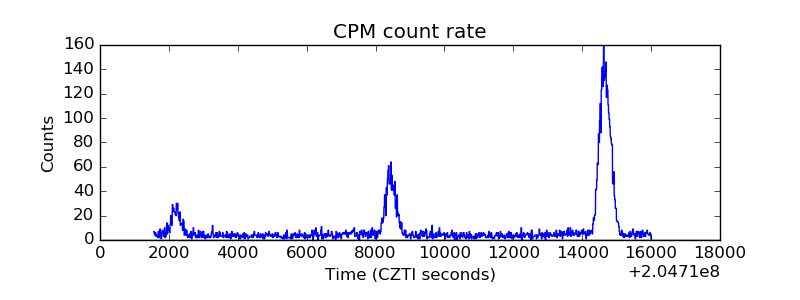 |
| CZT Counter | 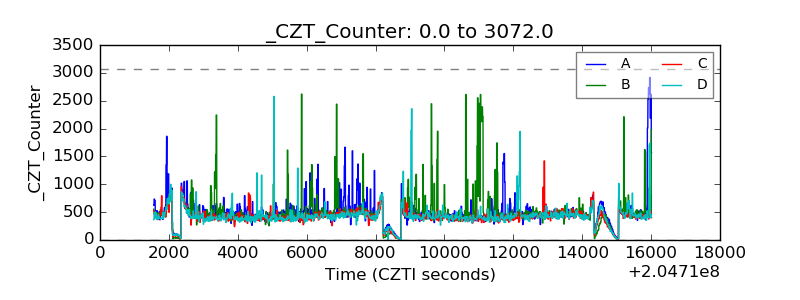 |
| +2.5 Volts monitor | 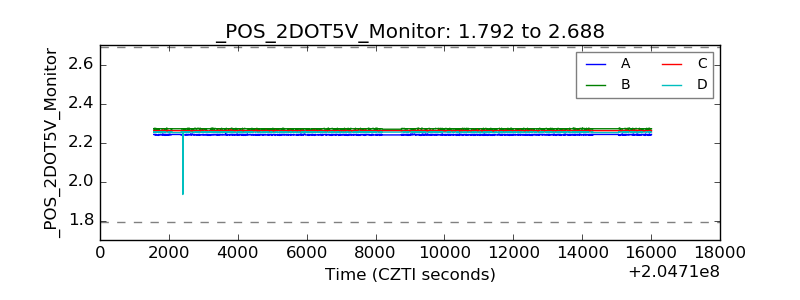 |
| +5 Volts monitor |  |
| _ROLL_ROT | 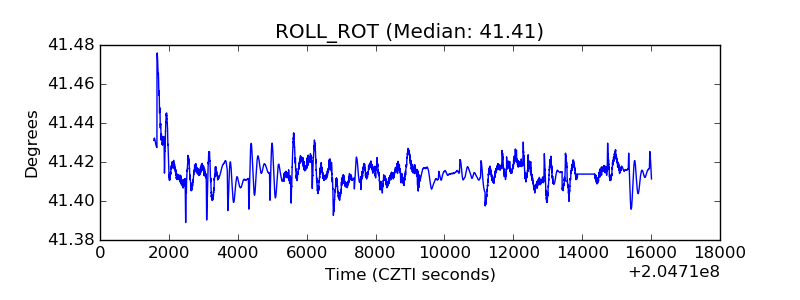 |
| _Roll_DEC | 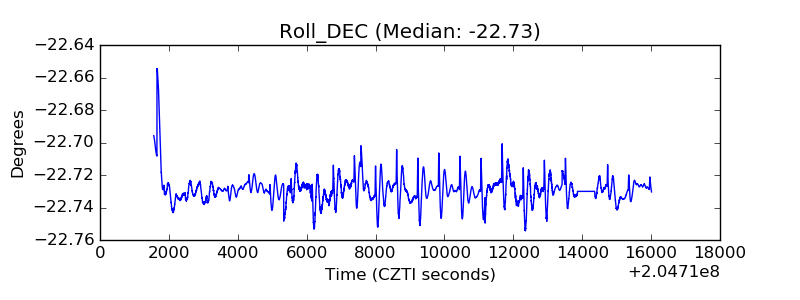 |
| _Roll_RA | 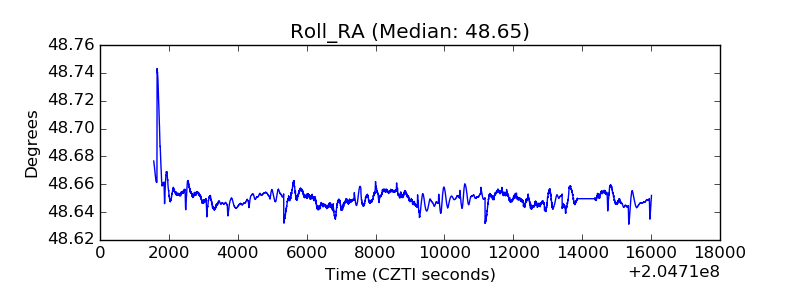 |
| Veto Counter | 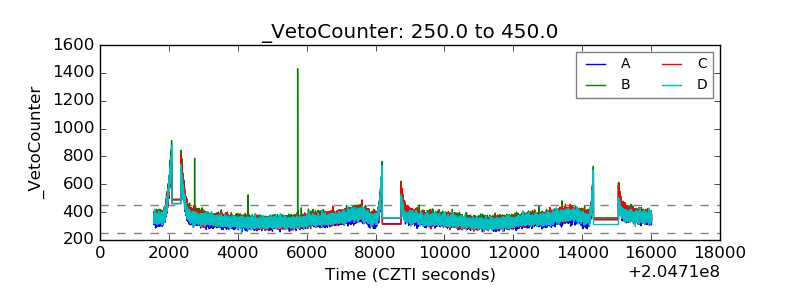 |