| Param | Original file | Final file |
|---|---|---|
| Filename | modeM0/AS1G05_241T04_9000000518_04047cztM0_level2.evt | modeM0/AS1G05_241T04_9000000518_04047cztM0_level2_quad_clean.evt |
| Size (bytes) | 440,262,720 | 64,376,640 |
| Size | 419.9 MB | 61.4 MB |
| Events in quadrant A | 3,738,453 | 372,354 |
| Events in quadrant B | 3,479,906 | 381,055 |
| Events in quadrant C | 2,794,753 | 378,172 |
| Events in quadrant D | 2,884,274 | 370,096 |
| Mode SS | |||
|---|---|---|---|
| Quadrant | BADHDUFLAG | Total packets | Discarded packets |
| A | 0 | 130 | 0 |
| B | 0 | 130 | 0 |
| C | 0 | 130 | 0 |
| D | 0 | 130 | 0 |
| Mode M0 | |||
|---|---|---|---|
| Quadrant | BADHDUFLAG | Total packets | Discarded packets |
| A | 0 | 15318 | 2 |
| B | 0 | 14414 | 1 |
| C | 0 | 12988 | 1 |
| D | 0 | 13353 | 1 |
| Mode M9 | |||
|---|---|---|---|
| Quadrant | BADHDUFLAG | Total packets | Discarded packets |
| A | 0 | 9 | 0 |
| B | 0 | 9 | 0 |
| C | 0 | 9 | 0 |
| D | 0 | 9 | 0 |
| Quadrant | Total seconds | Saturated seconds | Saturation percentage |
|---|---|---|---|
| A | 6411 | 242 | 3.774762% |
| B | 6411 | 128 | 1.996568% |
| C | 6411 | 31 | 0.483544% |
| D | 6411 | 48 | 0.748713% |
Noise dominated data is calculated using 1-second bins in cleaned event files. If a bin has >2000 counts, and if more than 50% of those come from <1% of pixels, then it is considered to be noise-dominated and hence unusable.
| Quadrant | # 1 sec bins | Bins with >0 counts | Bins with >2000 counts | High rate bins dominated by noise | Noise dominated (total time) | Noise dominated (detector-on time) | Marked lightcurve |
|---|---|---|---|---|---|---|---|
| A | 7271 | 6411 | 177 | 177 | 2.43% | 2.76% |  |
| B | 7271 | 6411 | 52 | 52 | 0.72% | 0.81% |  |
| C | 7271 | 6412 | 1 | 1 | 0.01% | 0.02% | 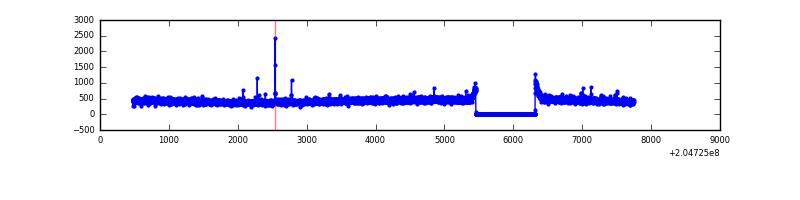 |
| D | 7271 | 6412 | 18 | 18 | 0.25% | 0.28% |  |
Top three noisy pixels from each quadrant. If the there are fewer than three noisy pixels in the level2.evt file, extra rows are filled as -1
| Pixel properties | Quadrant properties | ||||||
|---|---|---|---|---|---|---|---|
| Quadrant | DetID | PixID | Counts | Sigma | Mean | Median | Sigma |
| A | 0 | 5 | 450631 | 3035.55 | 725 | 709 | 148.2 |
| A | 8 | 15 | 184690 | 1241.29 | 725 | 709 | 148.2 |
| A | 0 | 199 | 131830 | 884.65 | 725 | 709 | 148.2 |
| B | 14 | 167 | 434445 | 2990.69 | 738 | 720 | 145.0 |
| B | 15 | 204 | 153695 | 1054.82 | 738 | 720 | 145.0 |
| B | 4 | 81 | 22428 | 149.68 | 738 | 720 | 145.0 |
| C | 1 | 16 | 13112 | 74.82 | 708 | 709 | 165.8 |
| C | 9 | 144 | 8562 | 47.37 | 708 | 709 | 165.8 |
| C | 12 | 4 | 5937 | 31.54 | 708 | 709 | 165.8 |
| D | 13 | 239 | 63381 | 361.68 | 713 | 690 | 173.3 |
| D | 2 | 232 | 54725 | 311.74 | 713 | 690 | 173.3 |
| D | 12 | 110 | 48114 | 273.6 | 713 | 690 | 173.3 |
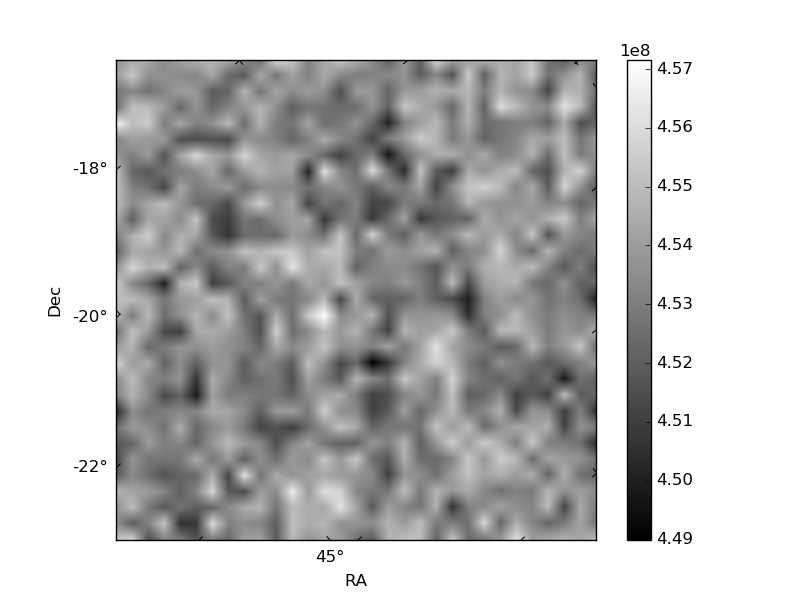
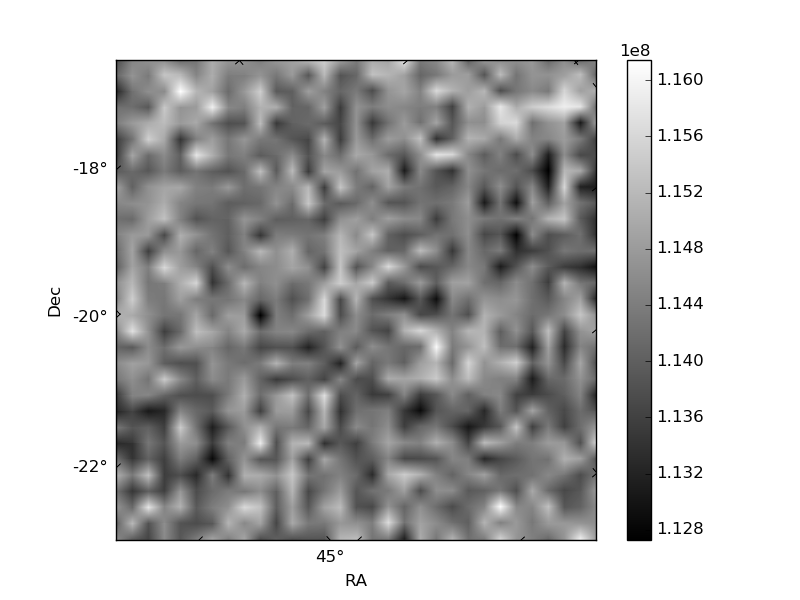
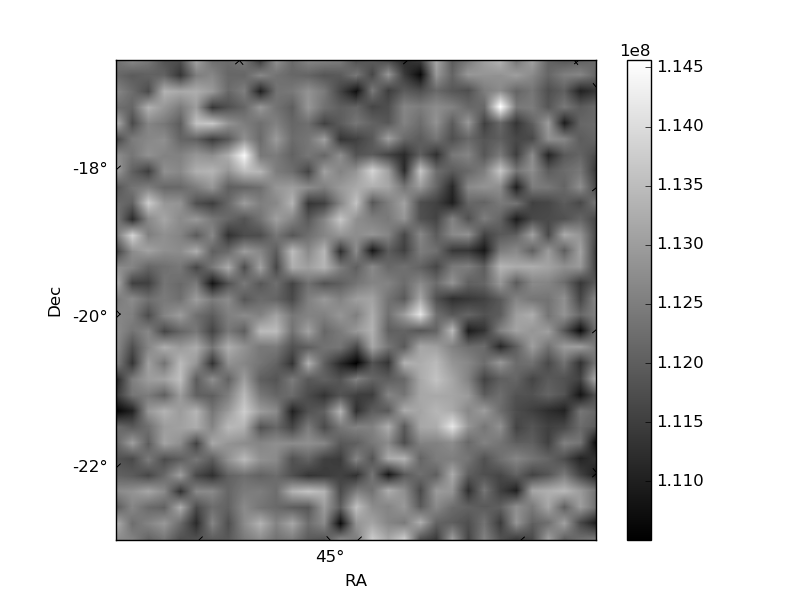
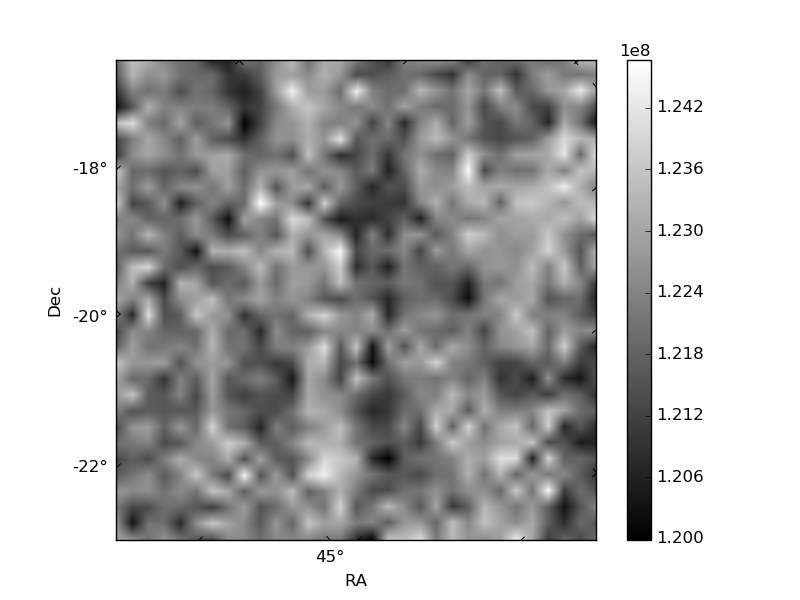
Histogram calculated using DETX and DETY for each event in the final _common_clean file
| Quadrant A | 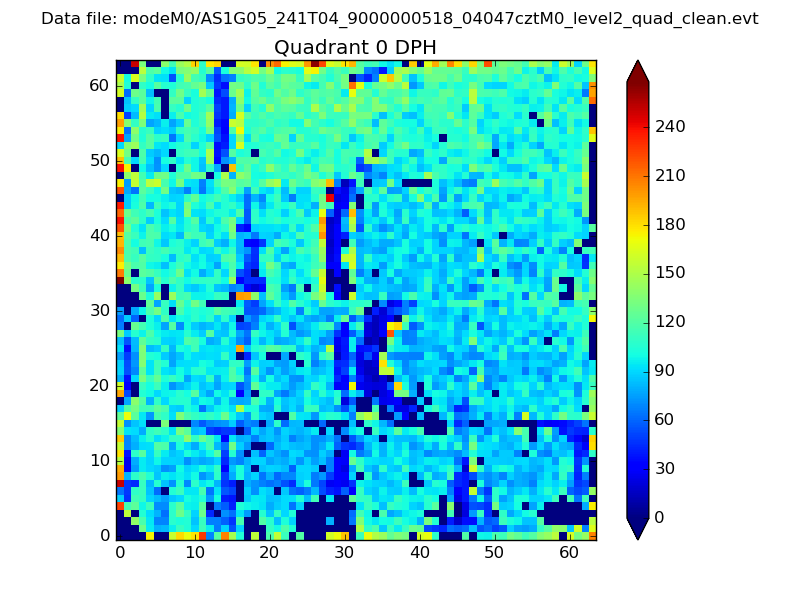 |
 |
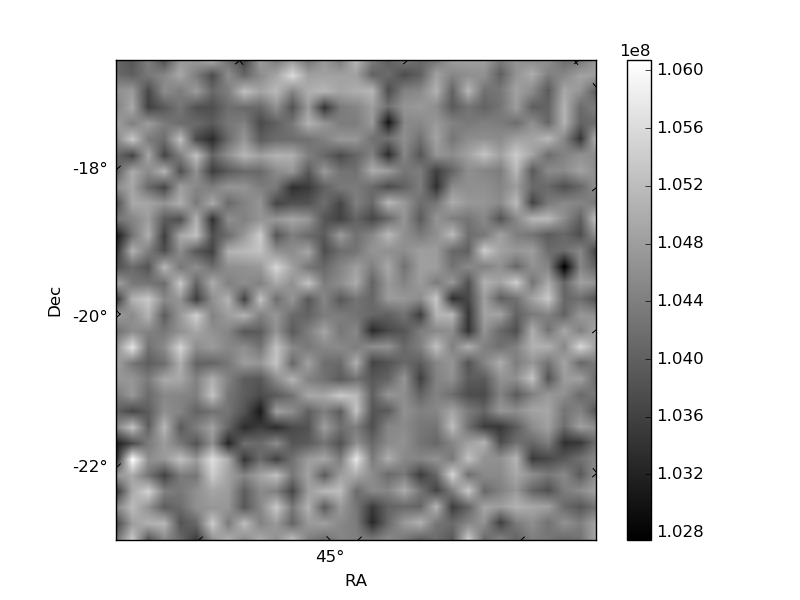
Quadrant B |
|---|---|---|---|
| Quadrant D |  |
 |
Quadrant C |
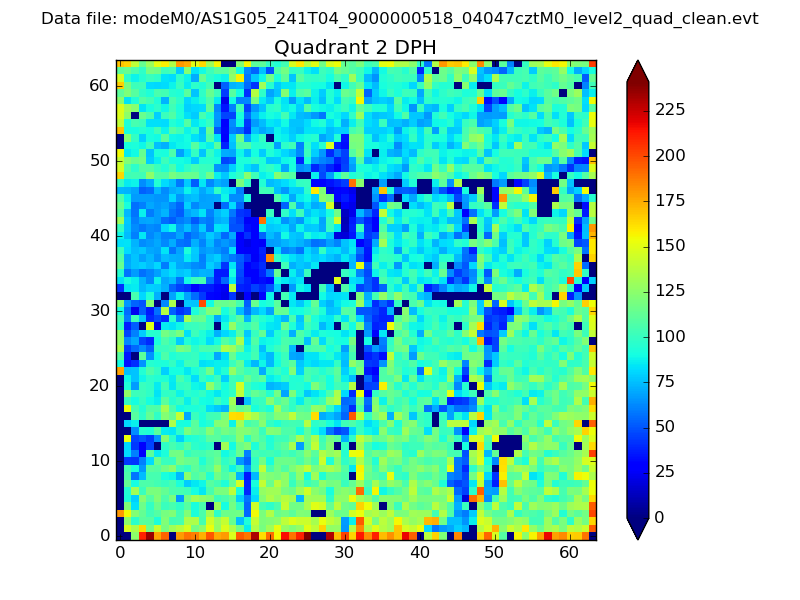
| Plot type | Count rate plots | Images |
|---|---|---|
| Comparison with Poisson distribution Blue bars denote a histogram of data divided into 1 sec bins. Red curve is a Poisson curve with rate = median count rate of data. |
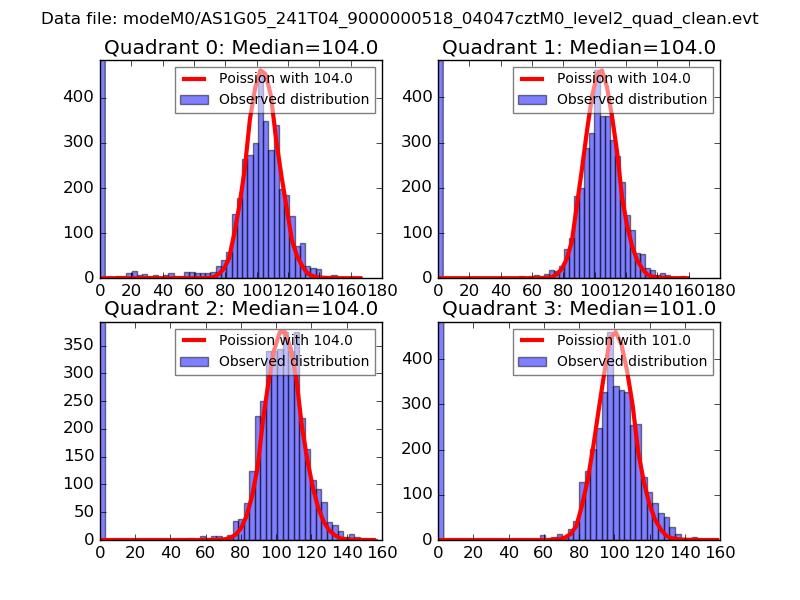 |
 |
| Quadrant-wise count rates Data is divided into 100 sec bins |
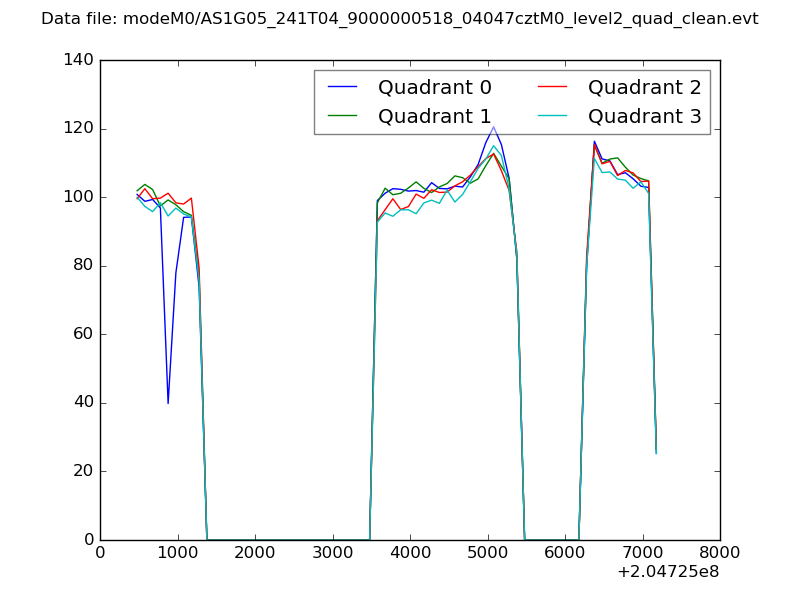 |
|
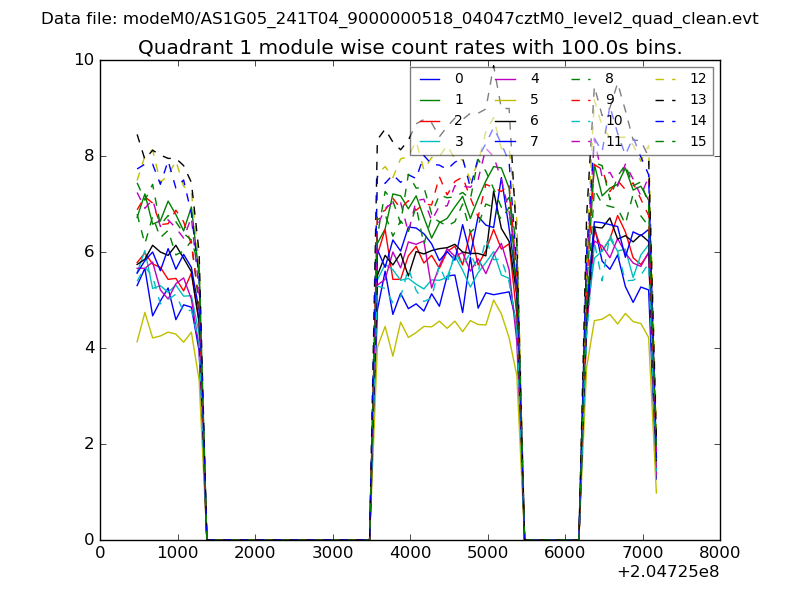
| Module-wise count rates for Quadrant A Data is divided into 100 sec bins |
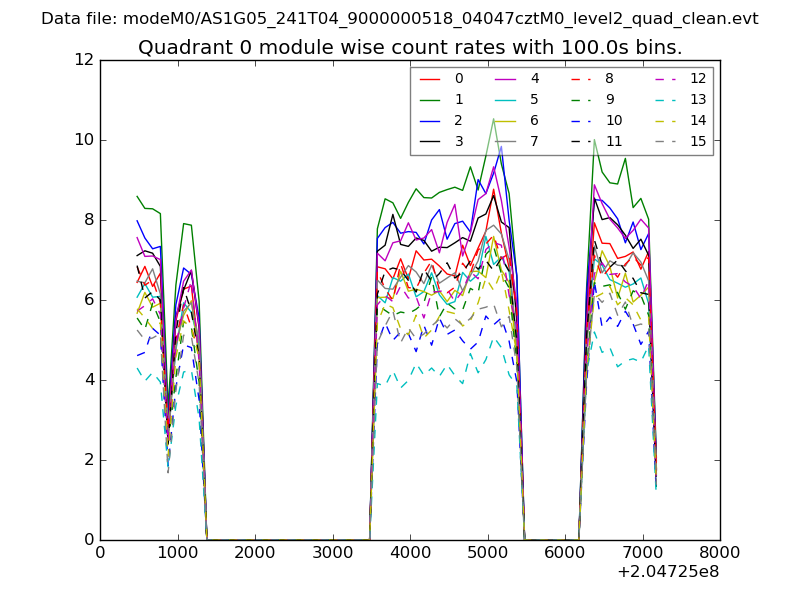 |
 |
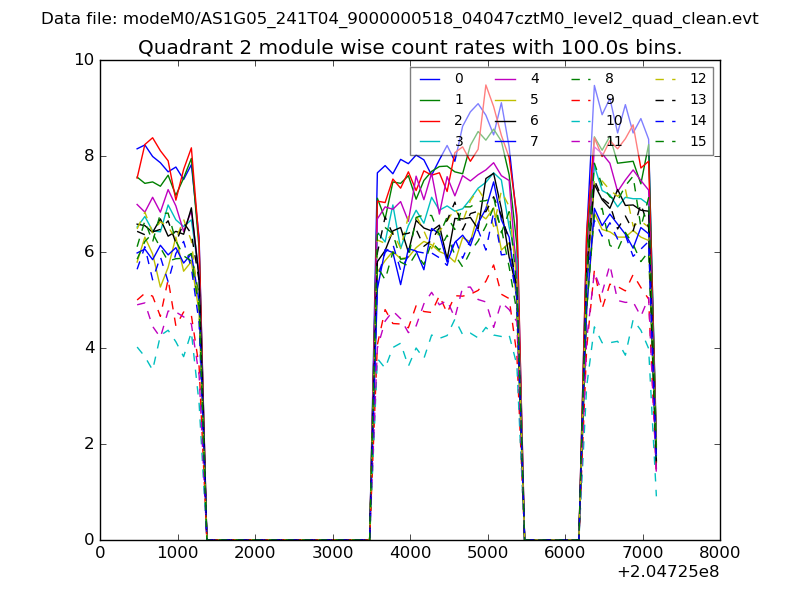
| Module-wise count rates for Quadrant B Data is divided into 100 sec bins |
 |
 |
| Module-wise count rates for Quadrant C Data is divided into 100 sec bins |
 |
 |
| Module-wise count rates for Quadrant D Data is divided into 100 sec bins |
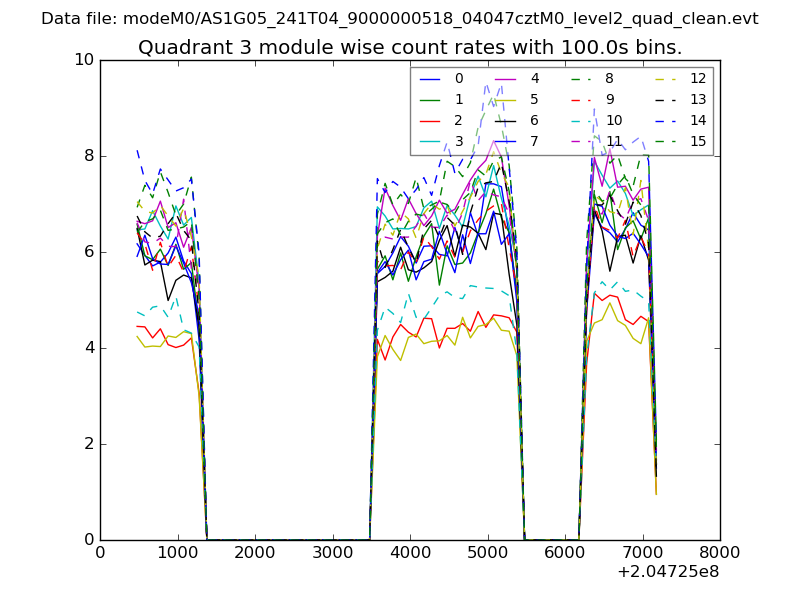 |
 |
| Parameter | Plot |
|---|---|
| CZT HV Monitor | 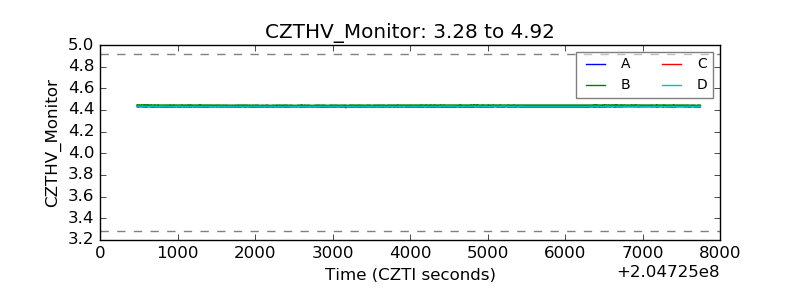 |
| D_VDD | 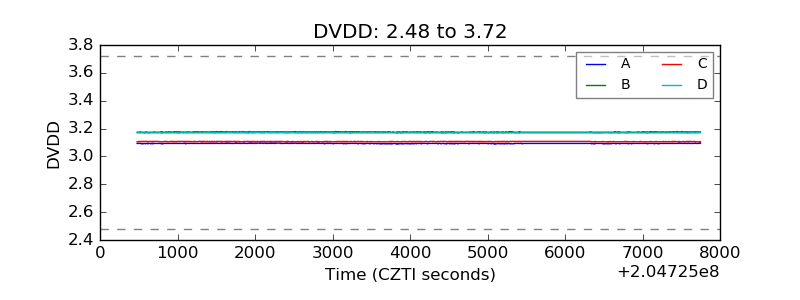 |
| Temperature 1 | 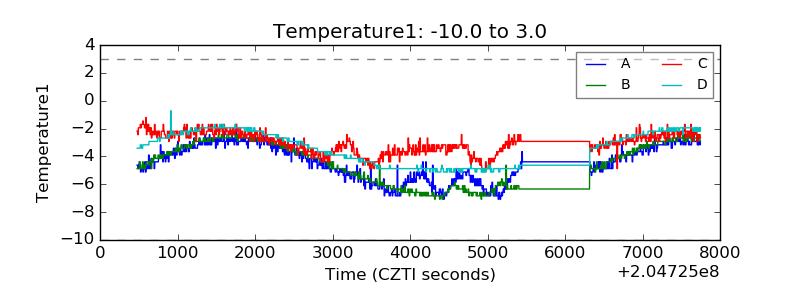 |
| Veto HV Monitor | 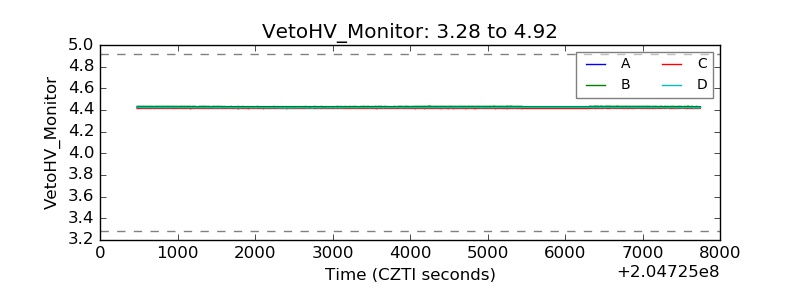 |
| Veto LLD | 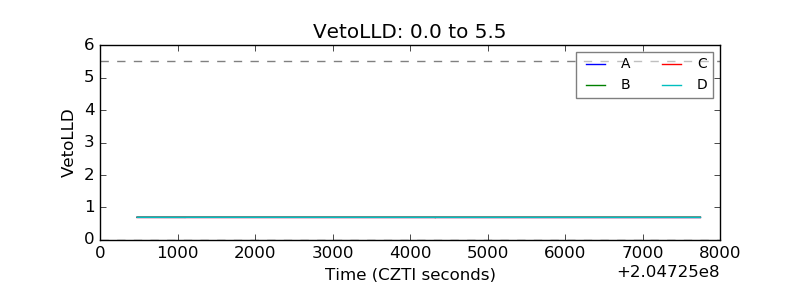 |
| Alpha Counter | 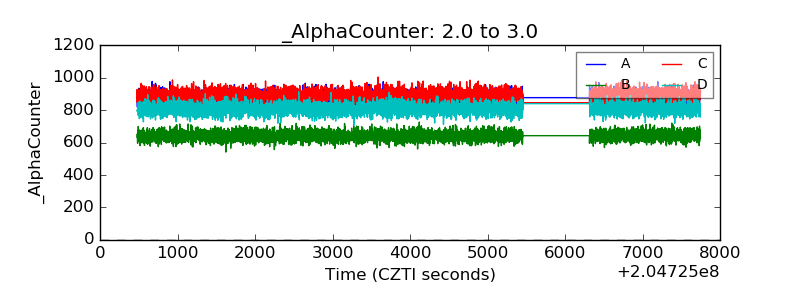 |
| _CPM_Rate | 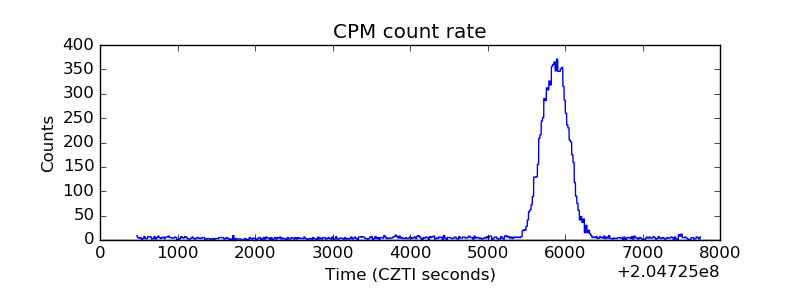 |
| CZT Counter | 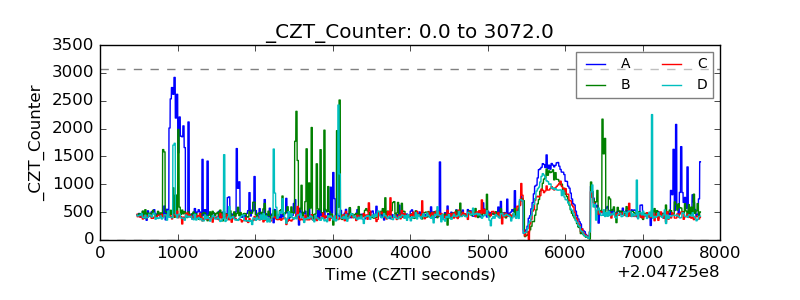 |
| +2.5 Volts monitor | 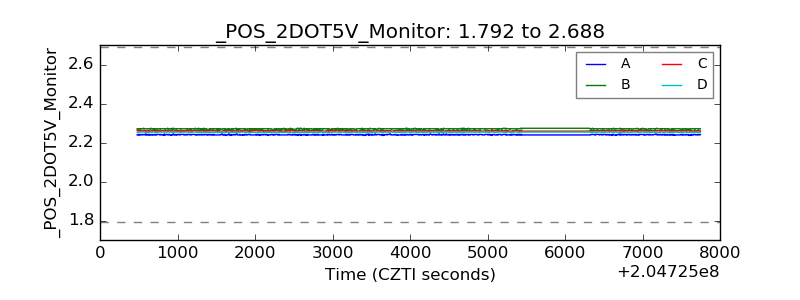 |
| +5 Volts monitor |  |
| _ROLL_ROT | 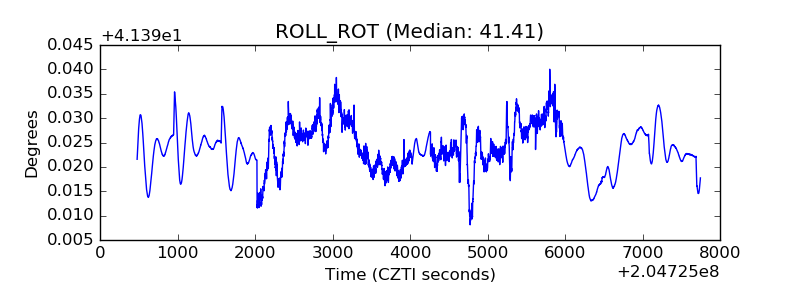 |
| _Roll_DEC | 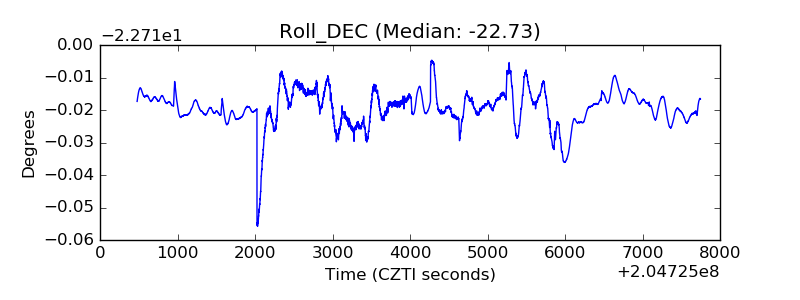 |
| _Roll_RA | 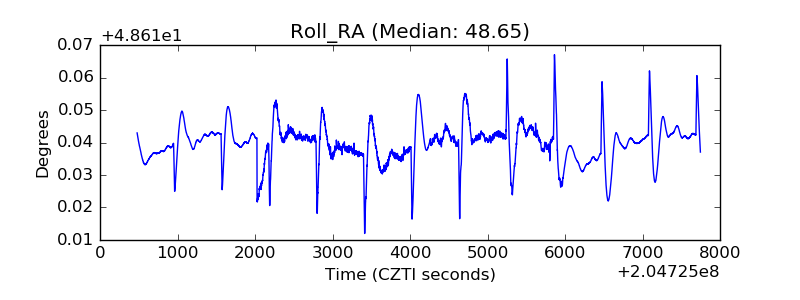 |
| Veto Counter | 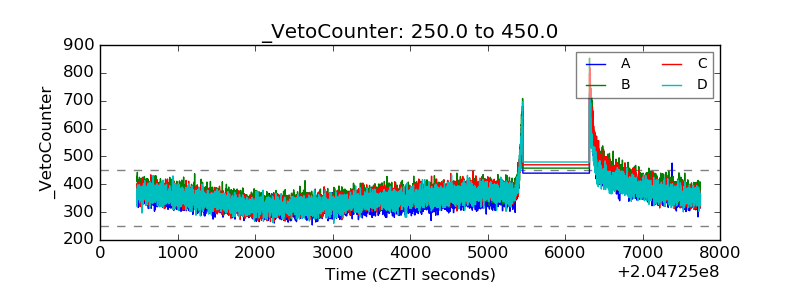 |