| Param | Original file | Final file |
|---|---|---|
| Filename | modeM0/AS1G05_241T04_9000000518_04048cztM0_level2.evt | modeM0/AS1G05_241T04_9000000518_04048cztM0_level2_quad_clean.evt |
| Size (bytes) | 433,661,760 | 59,829,120 |
| Size | 413.6 MB | 57.1 MB |
| Events in quadrant A | 3,371,612 | 345,989 |
| Events in quadrant B | 3,513,364 | 346,184 |
| Events in quadrant C | 2,939,287 | 338,984 |
| Events in quadrant D | 2,873,370 | 332,981 |
| Mode SS | |||
|---|---|---|---|
| Quadrant | BADHDUFLAG | Total packets | Discarded packets |
| A | 0 | 128 | 0 |
| B | 0 | 128 | 0 |
| C | 0 | 128 | 0 |
| D | 0 | 128 | 0 |
| Mode M0 | |||
|---|---|---|---|
| Quadrant | BADHDUFLAG | Total packets | Discarded packets |
| A | 0 | 13995 | 2 |
| B | 0 | 14482 | 1 |
| C | 0 | 13295 | 1 |
| D | 0 | 13290 | 1 |
| Mode M9 | |||
|---|---|---|---|
| Quadrant | BADHDUFLAG | Total packets | Discarded packets |
| A | 0 | 11 | 0 |
| B | 0 | 11 | 0 |
| C | 0 | 11 | 0 |
| D | 0 | 11 | 0 |
| Quadrant | Total seconds | Saturated seconds | Saturation percentage |
|---|---|---|---|
| A | 6415 | 80 | 1.247077% |
| B | 6415 | 92 | 1.434139% |
| C | 6415 | 40 | 0.623539% |
| D | 6415 | 46 | 0.717069% |
Noise dominated data is calculated using 1-second bins in cleaned event files. If a bin has >2000 counts, and if more than 50% of those come from <1% of pixels, then it is considered to be noise-dominated and hence unusable.
| Quadrant | # 1 sec bins | Bins with >0 counts | Bins with >2000 counts | High rate bins dominated by noise | Noise dominated (total time) | Noise dominated (detector-on time) | Marked lightcurve |
|---|---|---|---|---|---|---|---|
| A | 7435 | 6415 | 23 | 23 | 0.31% | 0.36% |  |
| B | 7435 | 6415 | 28 | 28 | 0.38% | 0.44% |  |
| C | 7435 | 6415 | 7 | 7 | 0.09% | 0.11% |  |
| D | 7435 | 6416 | 9 | 9 | 0.12% | 0.14% | 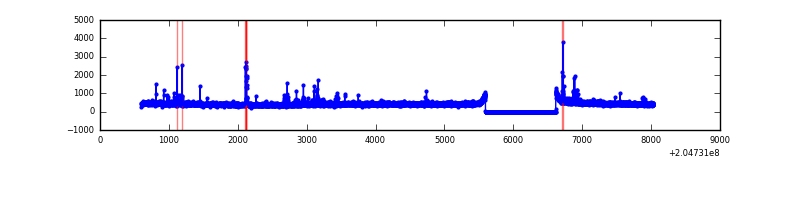 |
Top three noisy pixels from each quadrant. If the there are fewer than three noisy pixels in the level2.evt file, extra rows are filled as -1
| Pixel properties | Quadrant properties | ||||||
|---|---|---|---|---|---|---|---|
| Quadrant | DetID | PixID | Counts | Sigma | Mean | Median | Sigma |
| A | 8 | 15 | 309221 | 2006.79 | 747 | 730 | 153.7 |
| A | 0 | 118 | 69074 | 444.59 | 747 | 730 | 153.7 |
| A | 0 | 50 | 49914 | 319.95 | 747 | 730 | 153.7 |
| B | 15 | 204 | 288647 | 1975.6 | 752 | 735 | 145.7 |
| B | 14 | 167 | 199180 | 1361.69 | 752 | 735 | 145.7 |
| B | 4 | 81 | 68602 | 465.69 | 752 | 735 | 145.7 |
| C | 9 | 144 | 59339 | 350.04 | 719 | 722 | 167.5 |
| C | 10 | 65 | 43831 | 257.43 | 719 | 722 | 167.5 |
| C | 12 | 4 | 23769 | 137.63 | 719 | 722 | 167.5 |
| D | 2 | 122 | 46723 | 264.78 | 722 | 701 | 173.8 |
| D | 2 | 232 | 45198 | 256.0 | 722 | 701 | 173.8 |
| D | 13 | 239 | 38378 | 216.77 | 722 | 701 | 173.8 |
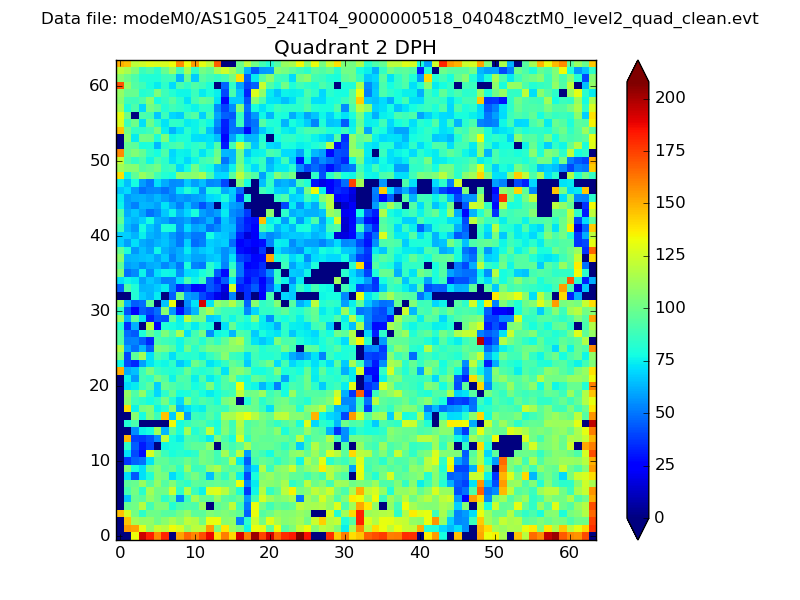
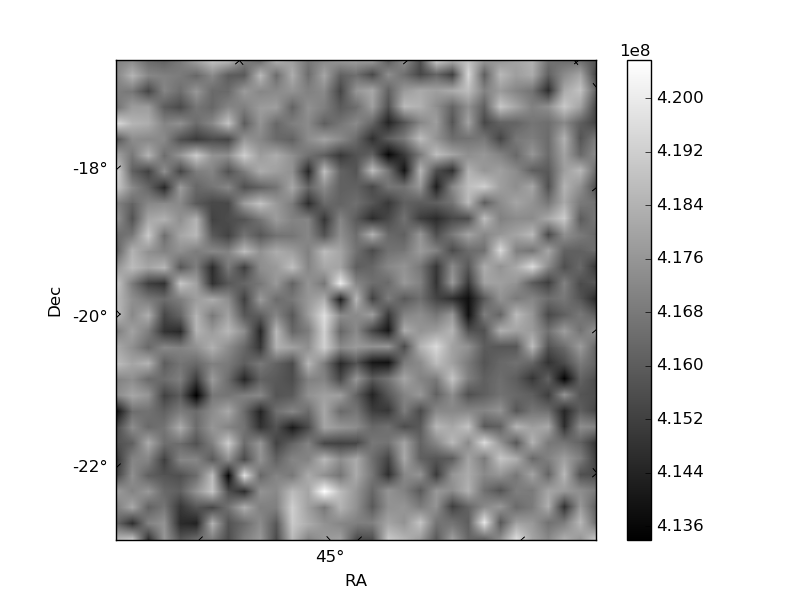
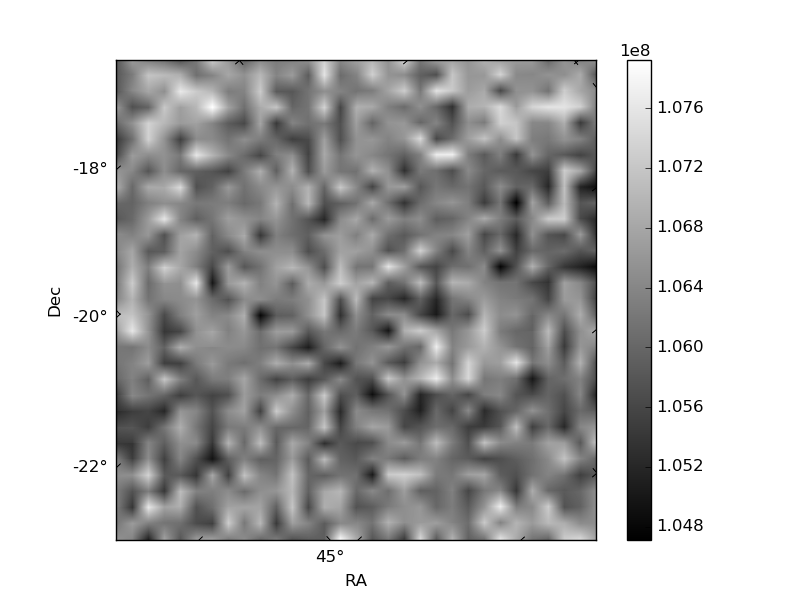
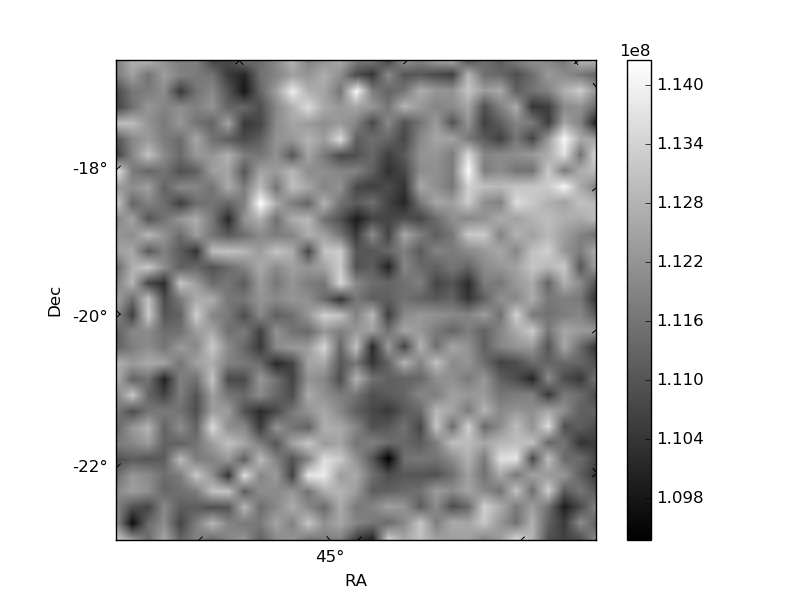
Histogram calculated using DETX and DETY for each event in the final _common_clean file
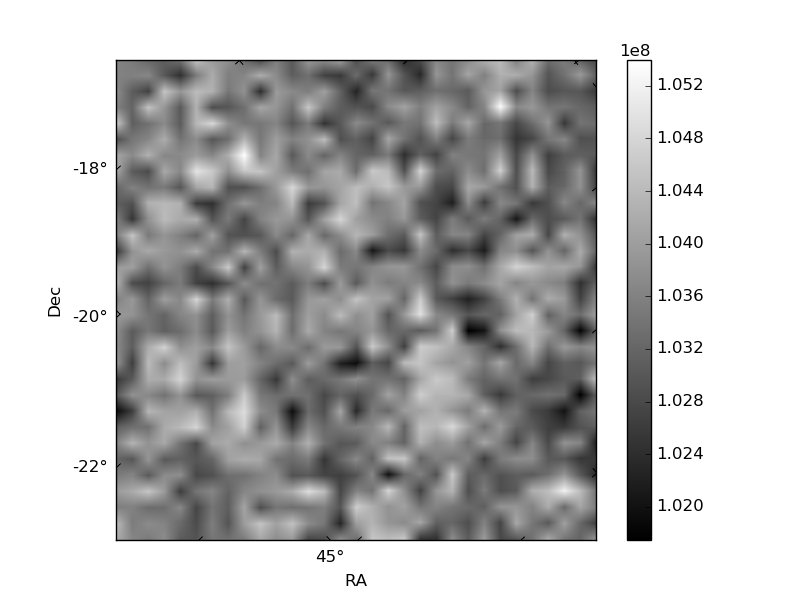
| Quadrant A |  |
 |
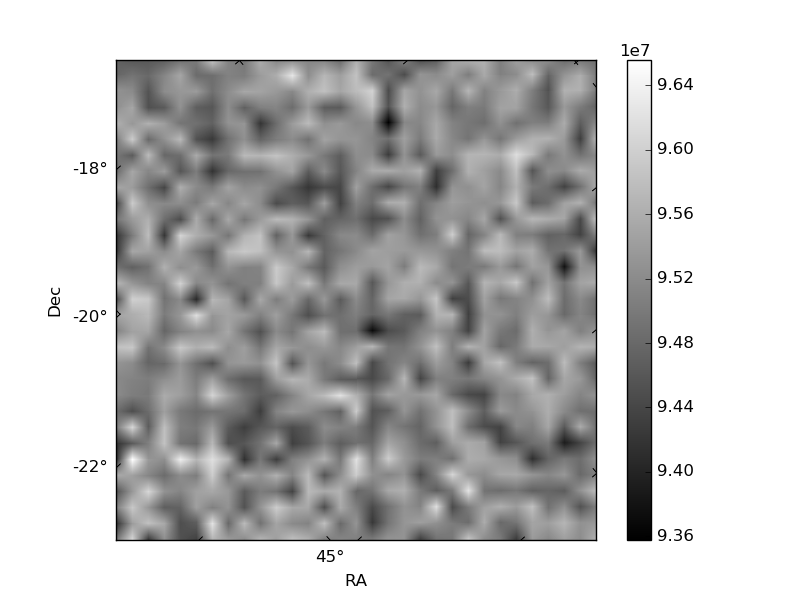
Quadrant B |
|---|---|---|---|
| Quadrant D | 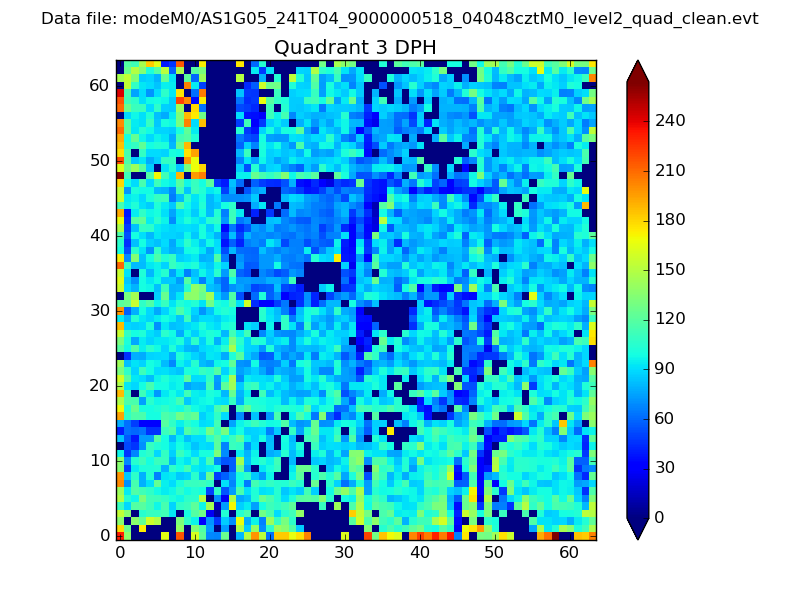 |
 |
Quadrant C |
| Plot type | Count rate plots | Images |
|---|---|---|
| Comparison with Poisson distribution Blue bars denote a histogram of data divided into 1 sec bins. Red curve is a Poisson curve with rate = median count rate of data. |
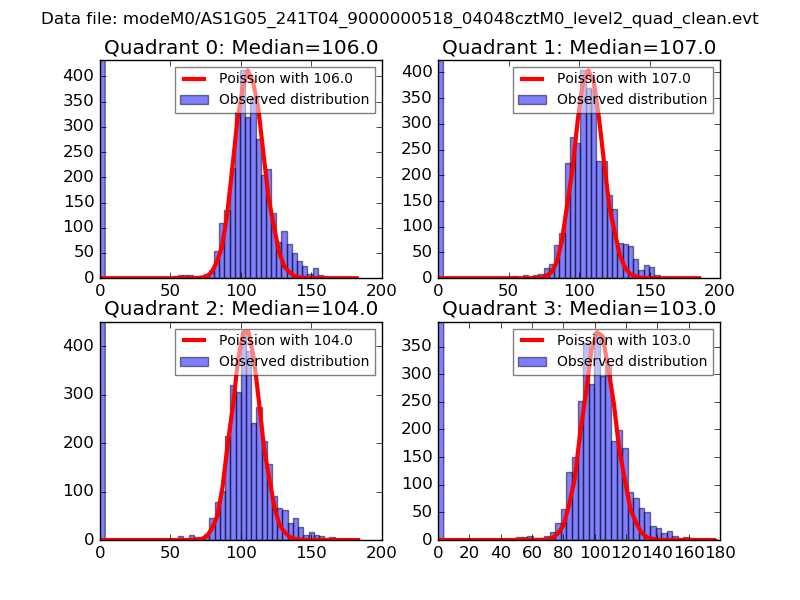 |
 |
| Quadrant-wise count rates Data is divided into 100 sec bins |
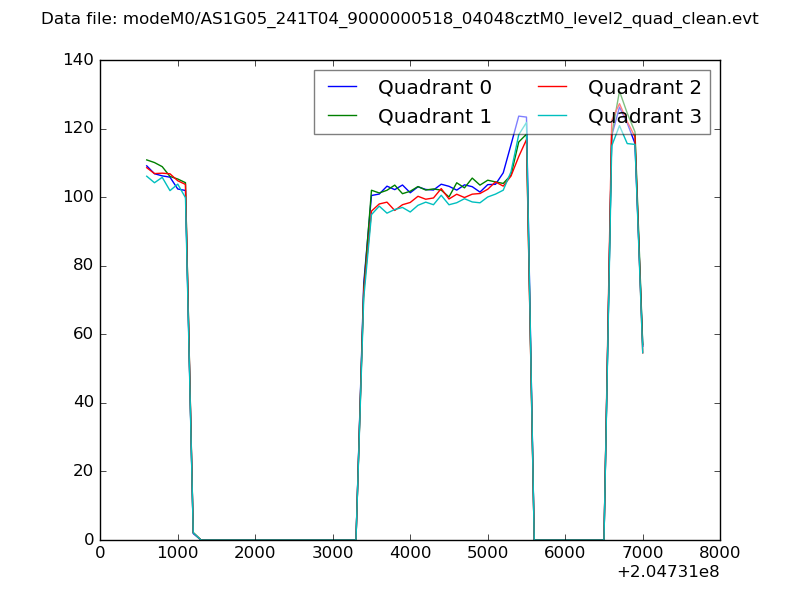 |
|
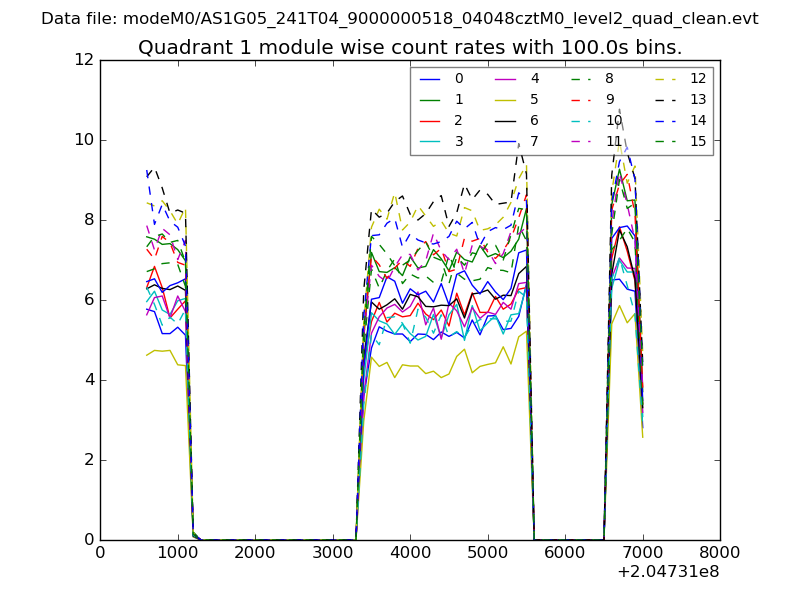
| Module-wise count rates for Quadrant A Data is divided into 100 sec bins |
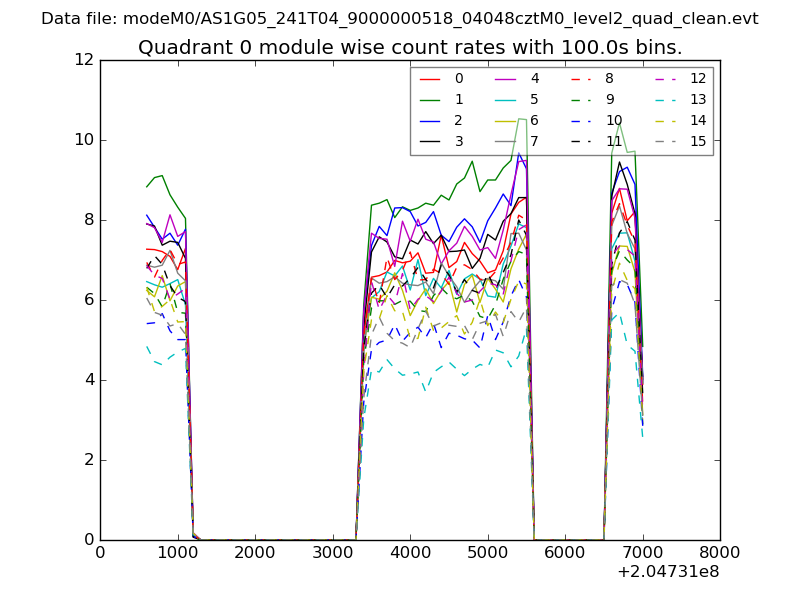 |
 |
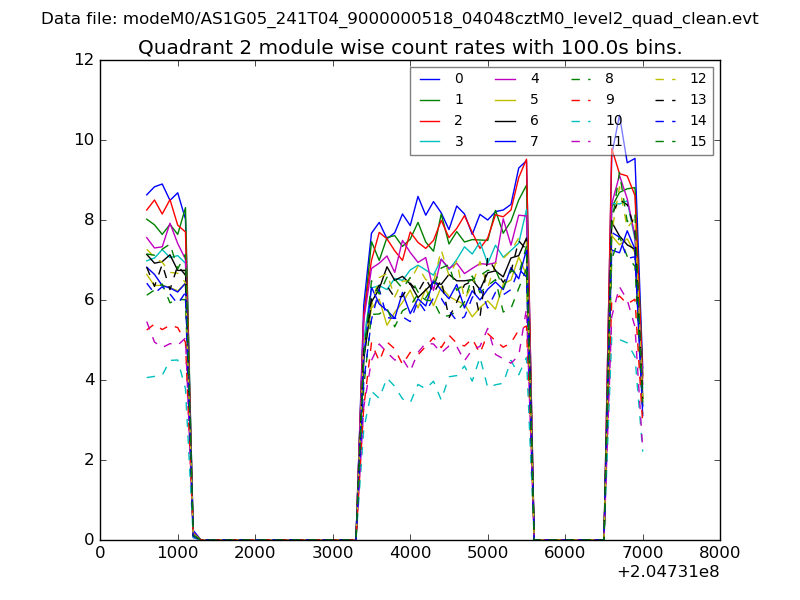
| Module-wise count rates for Quadrant B Data is divided into 100 sec bins |
 |
 |
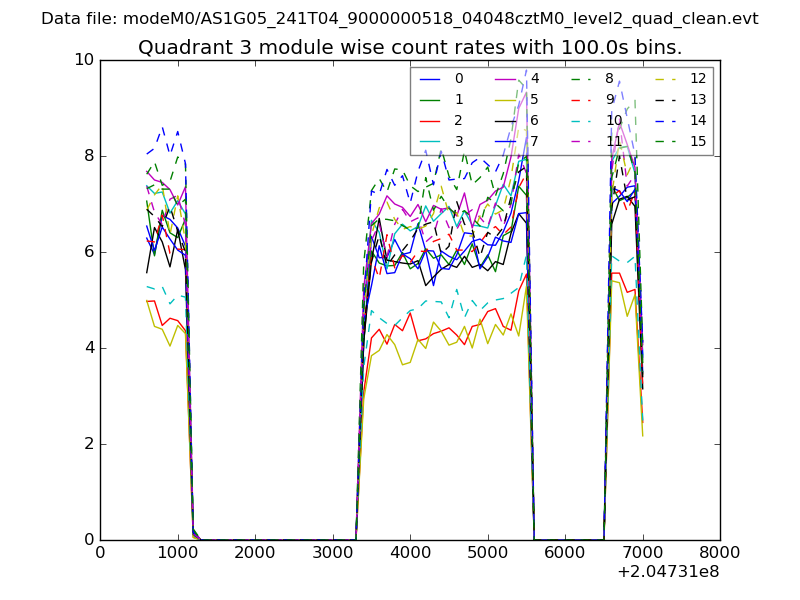
| Module-wise count rates for Quadrant C Data is divided into 100 sec bins |
 |
 |
| Module-wise count rates for Quadrant D Data is divided into 100 sec bins |
 |
 |
| Parameter | Plot |
|---|---|
| CZT HV Monitor | 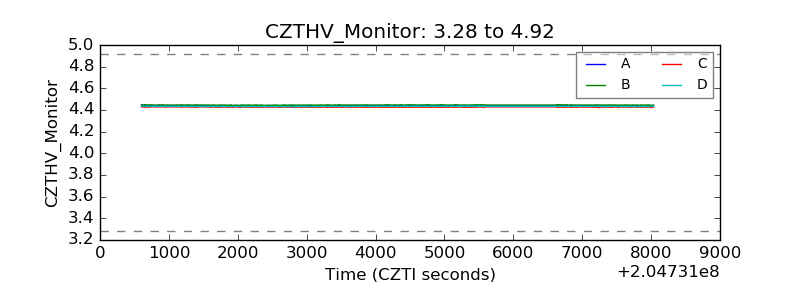 |
| D_VDD | 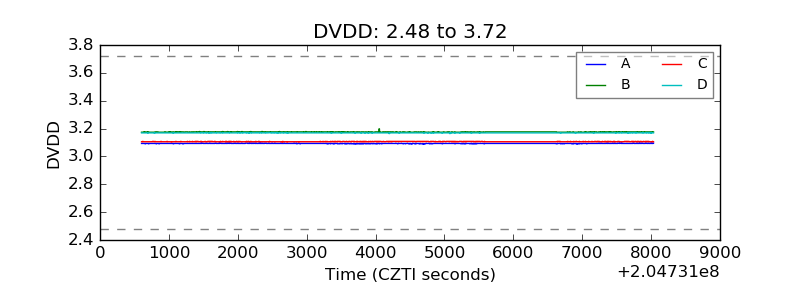 |
| Temperature 1 | 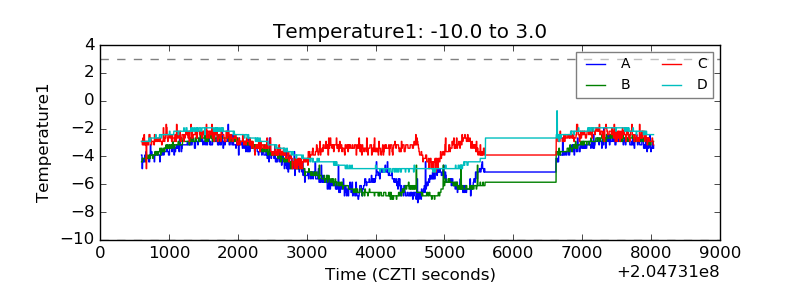 |
| Veto HV Monitor | 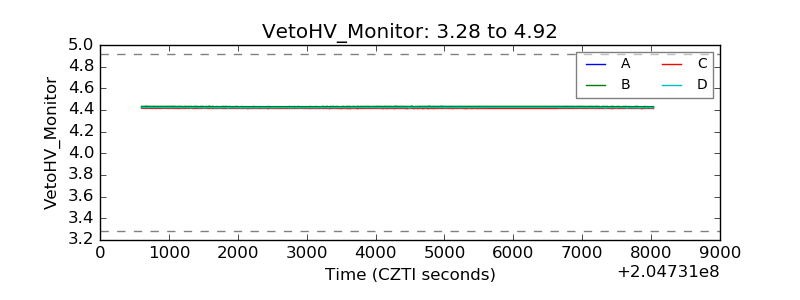 |
| Veto LLD | 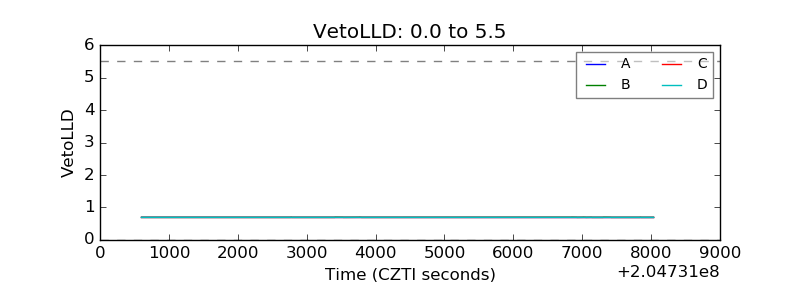 |
| Alpha Counter | 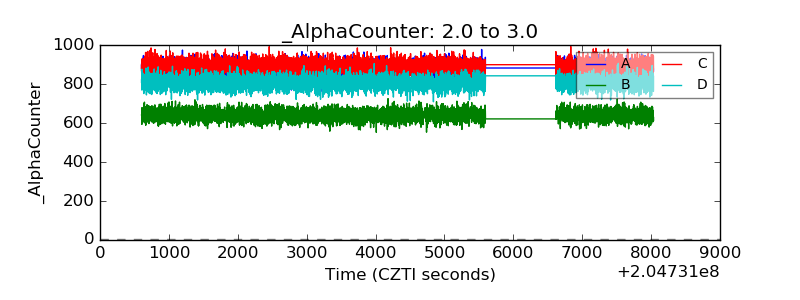 |
| _CPM_Rate | 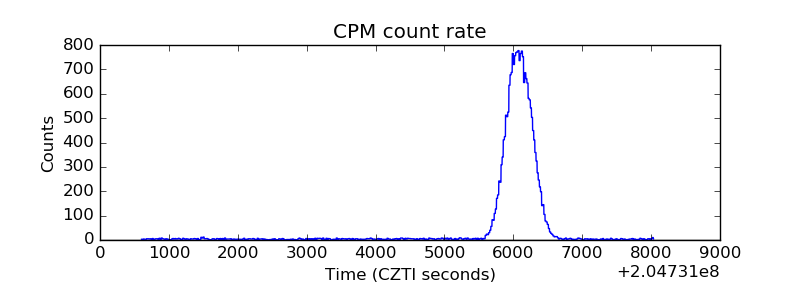 |
| CZT Counter | 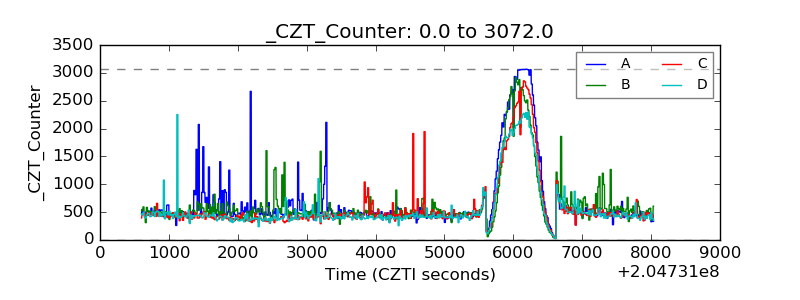 |
| +2.5 Volts monitor | 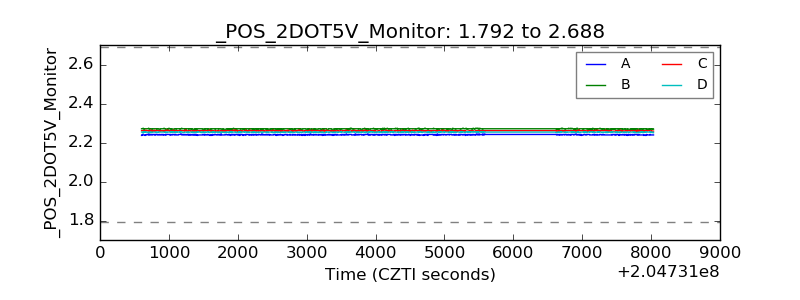 |
| +5 Volts monitor |  |
| _ROLL_ROT | 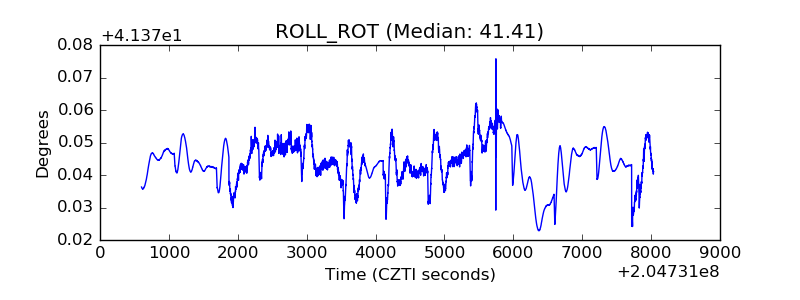 |
| _Roll_DEC | 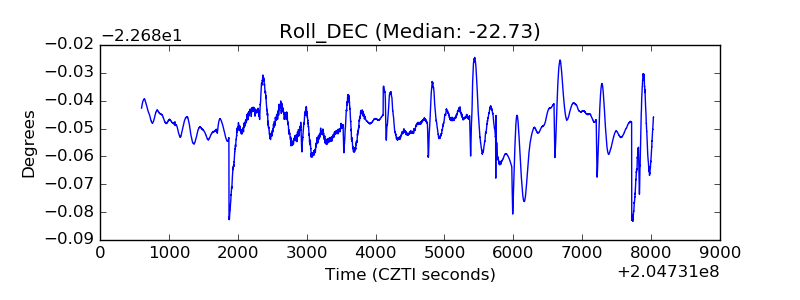 |
| _Roll_RA | 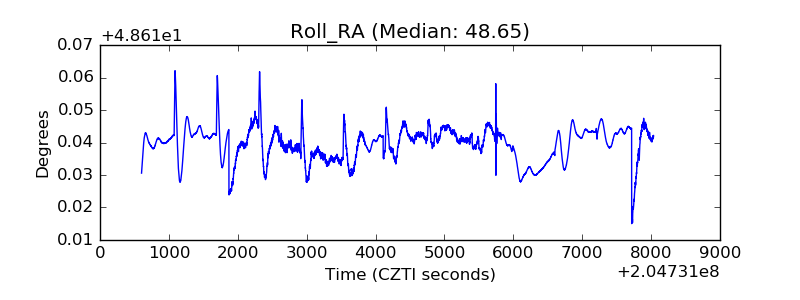 |
| Veto Counter | 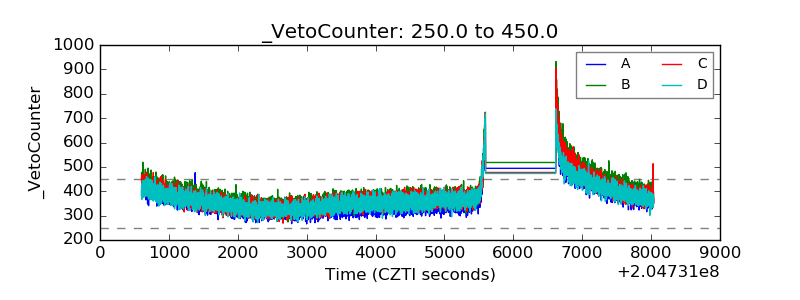 |