| Param | Original file | Final file |
|---|---|---|
| Filename | modeM0/AS1G05_241T04_9000000518_04050cztM0_level2.evt | modeM0/AS1G05_241T04_9000000518_04050cztM0_level2_quad_clean.evt |
| Size (bytes) | 411,494,400 | 51,675,840 |
| Size | 392.4 MB | 49.3 MB |
| Events in quadrant A | 2,992,812 | 288,948 |
| Events in quadrant B | 3,424,573 | 288,639 |
| Events in quadrant C | 2,795,386 | 283,360 |
| Events in quadrant D | 2,832,386 | 275,293 |
| Mode SS | |||
|---|---|---|---|
| Quadrant | BADHDUFLAG | Total packets | Discarded packets |
| A | 0 | 122 | 0 |
| B | 0 | 122 | 0 |
| C | 0 | 122 | 0 |
| D | 0 | 122 | 0 |
| Mode M0 | |||
|---|---|---|---|
| Quadrant | BADHDUFLAG | Total packets | Discarded packets |
| A | 0 | 12940 | 1 |
| B | 0 | 14113 | 0 |
| C | 0 | 12544 | 0 |
| D | 0 | 12830 | 0 |
| Mode M9 | |||
|---|---|---|---|
| Quadrant | BADHDUFLAG | Total packets | Discarded packets |
| A | 0 | 12 | 0 |
| B | 0 | 12 | 0 |
| C | 0 | 12 | 0 |
| D | 0 | 12 | 0 |
| Quadrant | Total seconds | Saturated seconds | Saturation percentage |
|---|---|---|---|
| A | 6139 | 107 | 1.742955% |
| B | 6139 | 106 | 1.726666% |
| C | 6139 | 48 | 0.781886% |
| D | 6139 | 51 | 0.830754% |
Noise dominated data is calculated using 1-second bins in cleaned event files. If a bin has >2000 counts, and if more than 50% of those come from <1% of pixels, then it is considered to be noise-dominated and hence unusable.
| Quadrant | # 1 sec bins | Bins with >0 counts | Bins with >2000 counts | High rate bins dominated by noise | Noise dominated (total time) | Noise dominated (detector-on time) | Marked lightcurve |
|---|---|---|---|---|---|---|---|
| A | 7269 | 6139 | 30 | 30 | 0.41% | 0.49% | 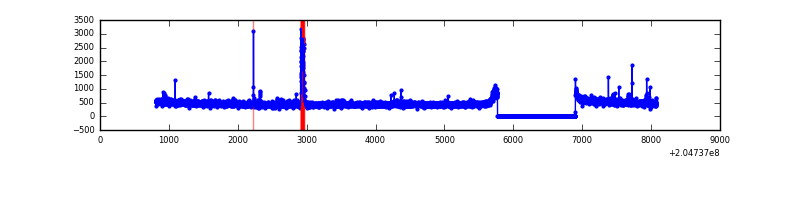 |
| B | 7269 | 6139 | 26 | 26 | 0.36% | 0.42% | 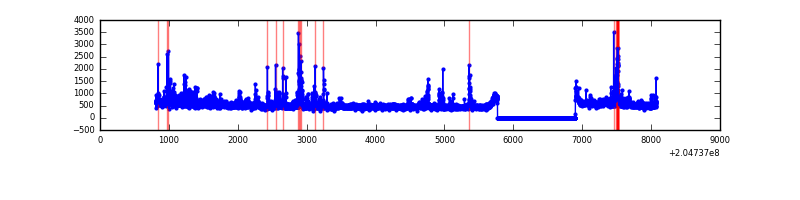 |
| C | 7269 | 6139 | 1 | 1 | 0.01% | 0.02% |  |
| D | 7269 | 6139 | 1 | 1 | 0.01% | 0.02% | 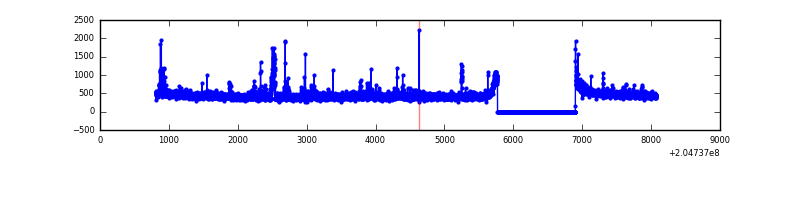 |
Top three noisy pixels from each quadrant. If the there are fewer than three noisy pixels in the level2.evt file, extra rows are filled as -1
| Pixel properties | Quadrant properties | ||||||
|---|---|---|---|---|---|---|---|
| Quadrant | DetID | PixID | Counts | Sigma | Mean | Median | Sigma |
| A | 0 | 50 | 92643 | 611.47 | 734 | 719 | 150.3 |
| A | 8 | 15 | 31814 | 206.84 | 734 | 719 | 150.3 |
| A | 0 | 118 | 27274 | 176.64 | 734 | 719 | 150.3 |
| B | 15 | 204 | 180293 | 1262.8 | 740 | 722 | 142.2 |
| B | 4 | 81 | 154666 | 1082.58 | 740 | 722 | 142.2 |
| B | 14 | 167 | 115543 | 807.46 | 740 | 722 | 142.2 |
| C | 9 | 144 | 21368 | 125.2 | 708 | 711 | 165.0 |
| C | 12 | 4 | 5944 | 31.72 | 708 | 711 | 165.0 |
| C | 13 | 61 | 5912 | 31.52 | 708 | 711 | 165.0 |
| D | 2 | 232 | 80391 | 464.33 | 708 | 686 | 171.7 |
| D | 13 | 239 | 26692 | 151.5 | 708 | 686 | 171.7 |
| D | 10 | 34 | 14593 | 81.02 | 708 | 686 | 171.7 |
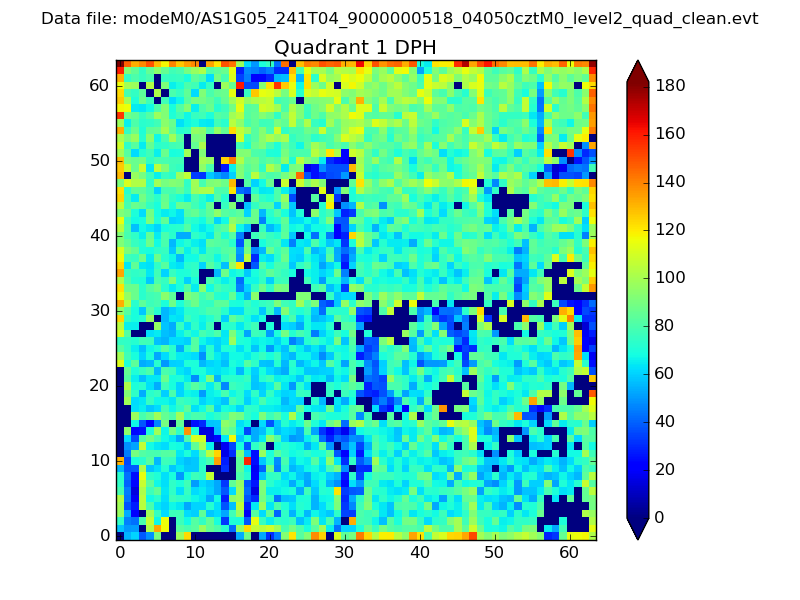
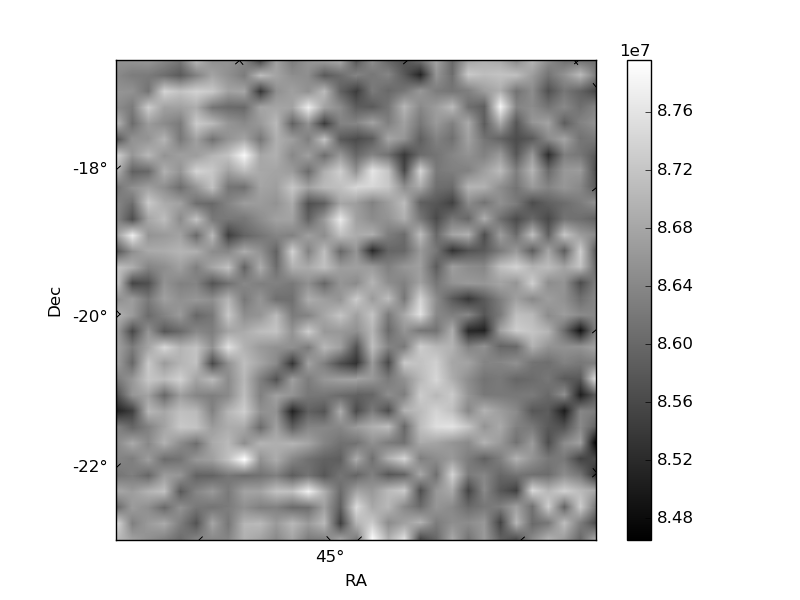
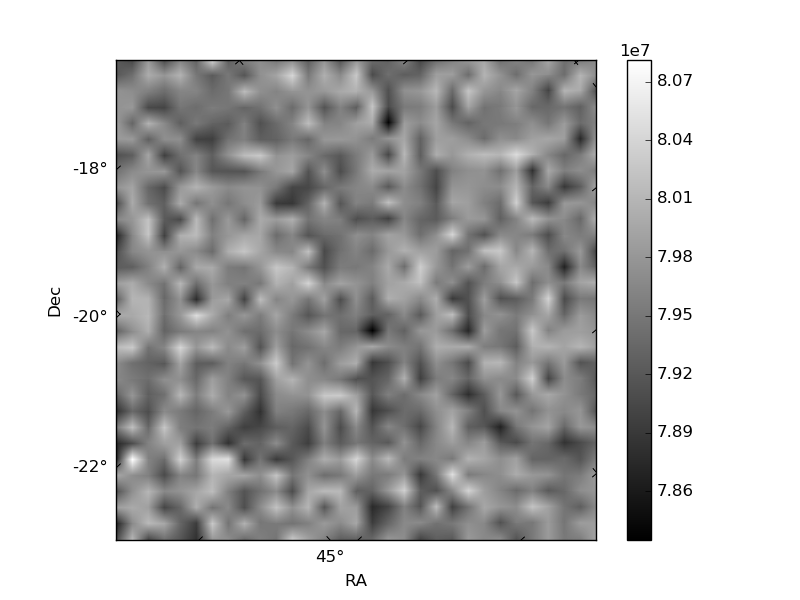
Histogram calculated using DETX and DETY for each event in the final _common_clean file
| Quadrant A | 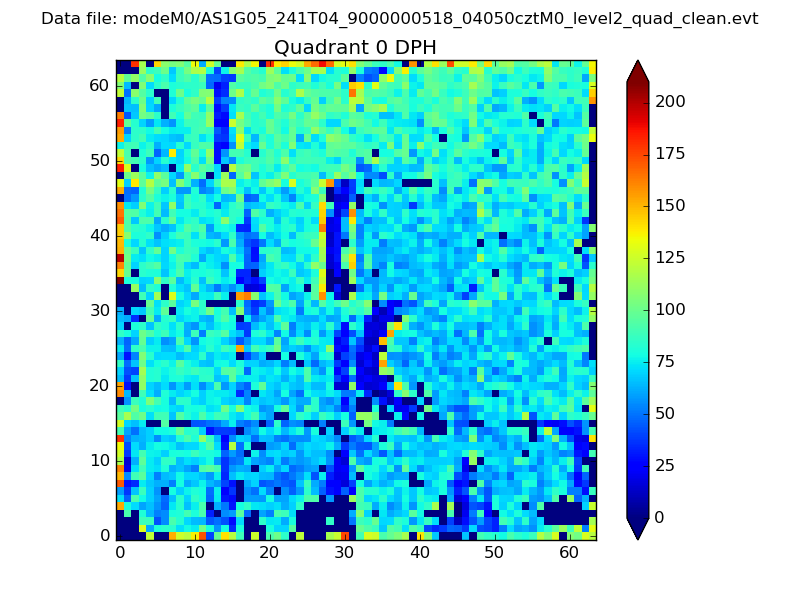 |
 |
Quadrant B |
|---|---|---|---|
| Quadrant D | 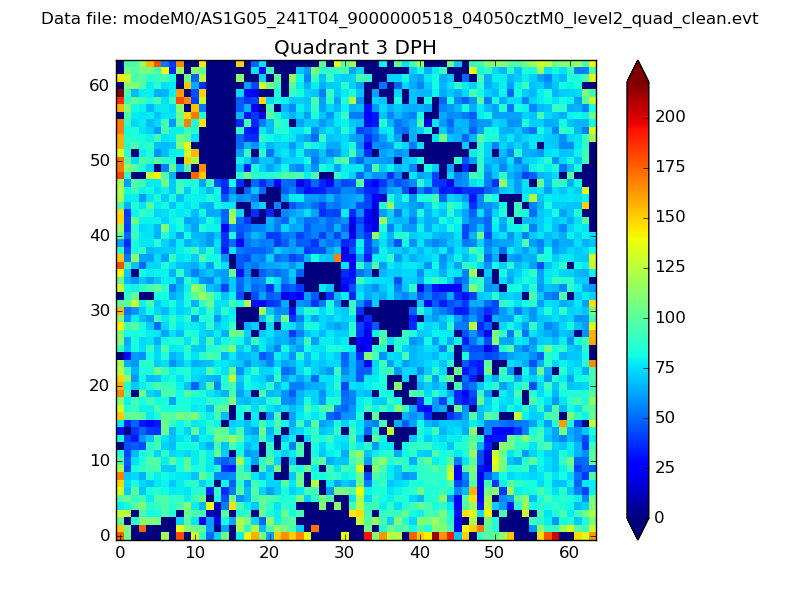 |
 |
Quadrant C |
| Plot type | Count rate plots | Images |
|---|---|---|
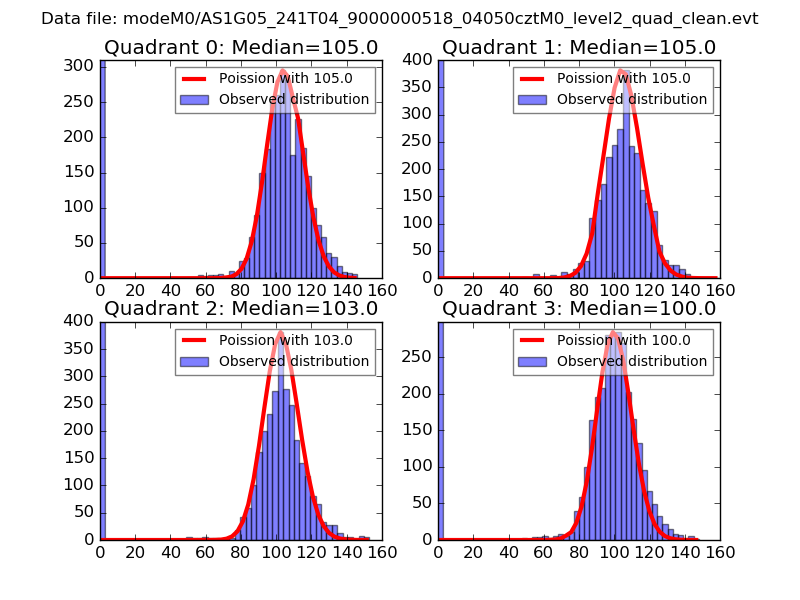
| Comparison with Poisson distribution Blue bars denote a histogram of data divided into 1 sec bins. Red curve is a Poisson curve with rate = median count rate of data. |
 |
 |
| Quadrant-wise count rates Data is divided into 100 sec bins |
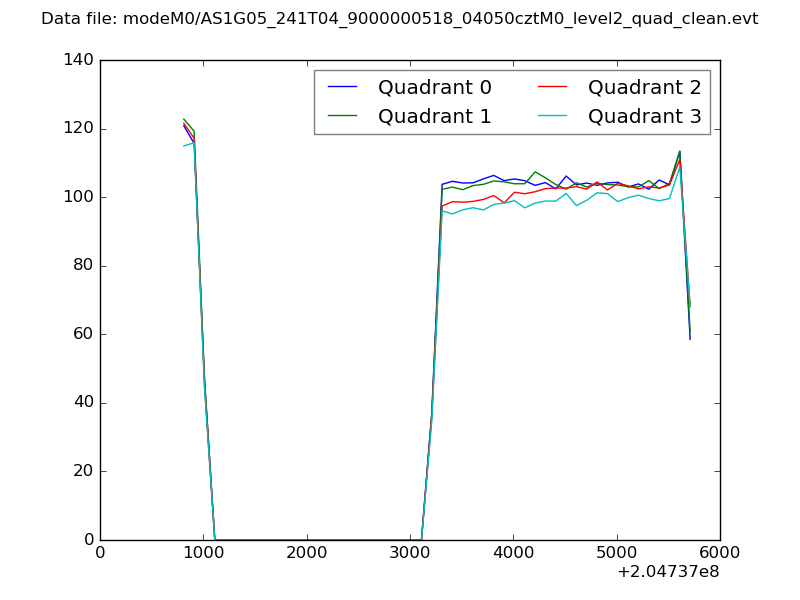 |
|
| Module-wise count rates for Quadrant A Data is divided into 100 sec bins |
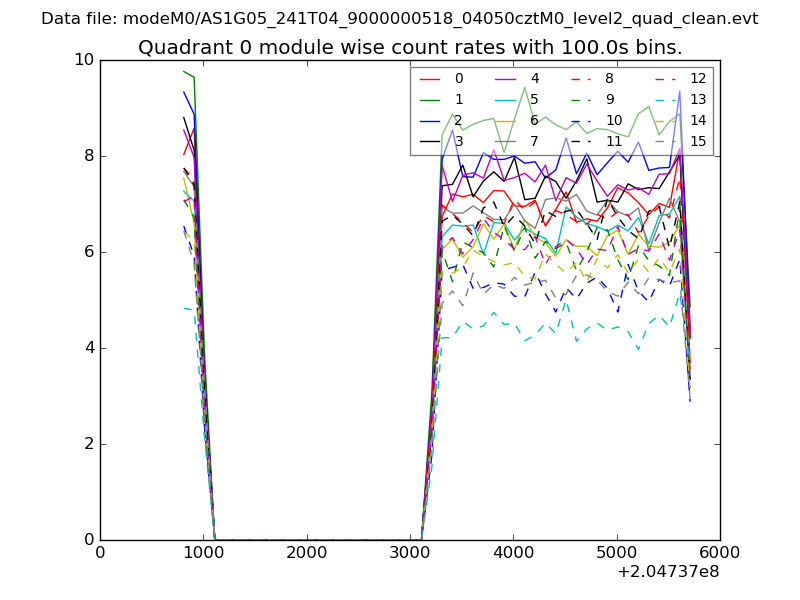 |
 |
| Module-wise count rates for Quadrant B Data is divided into 100 sec bins |
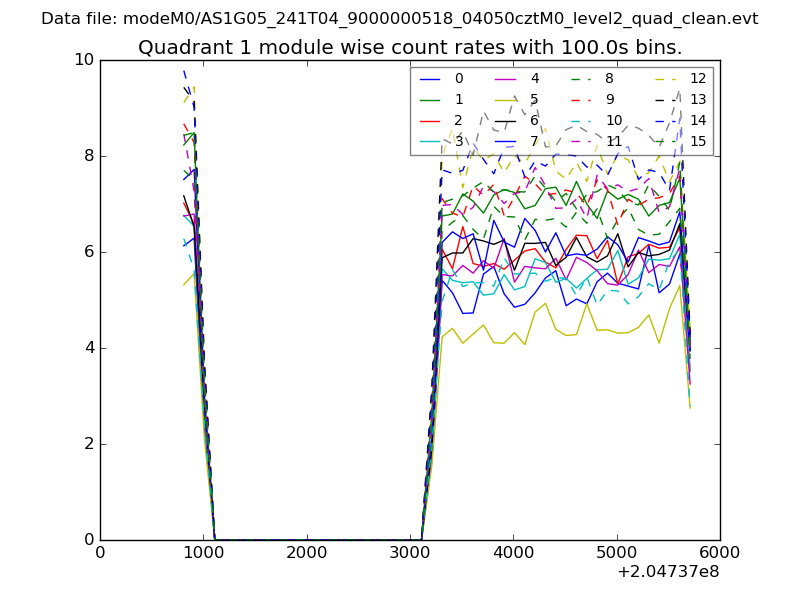 |
 |
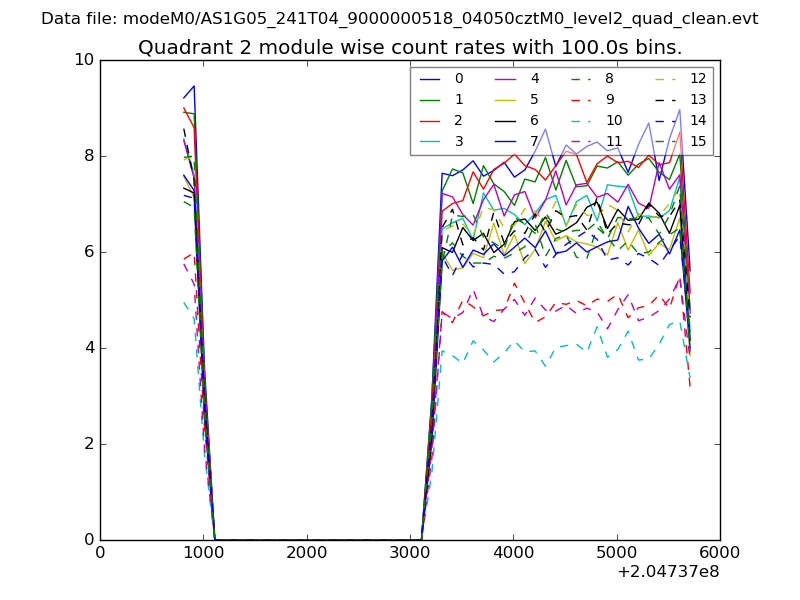
| Module-wise count rates for Quadrant C Data is divided into 100 sec bins |
 |
 |
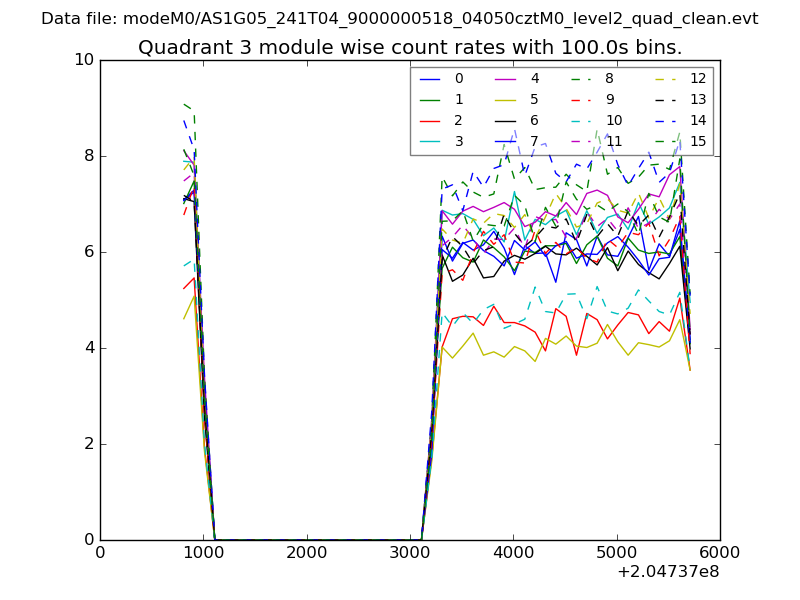
| Module-wise count rates for Quadrant D Data is divided into 100 sec bins |
 |
 |
| Parameter | Plot |
|---|---|
| CZT HV Monitor | 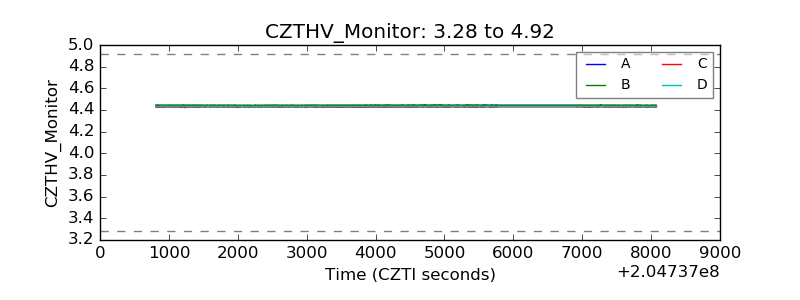 |
| D_VDD | 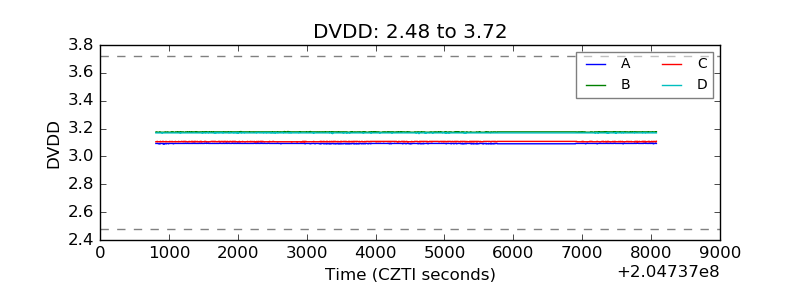 |
| Temperature 1 | 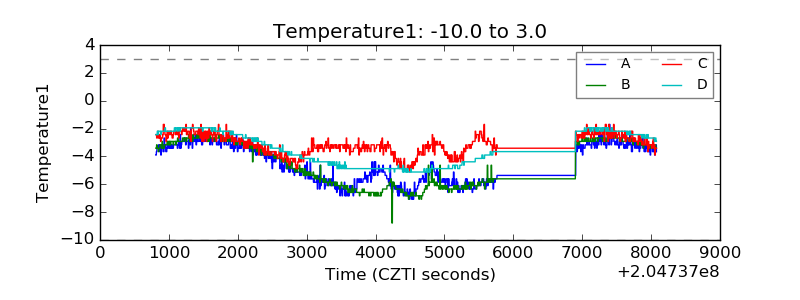 |
| Veto HV Monitor | 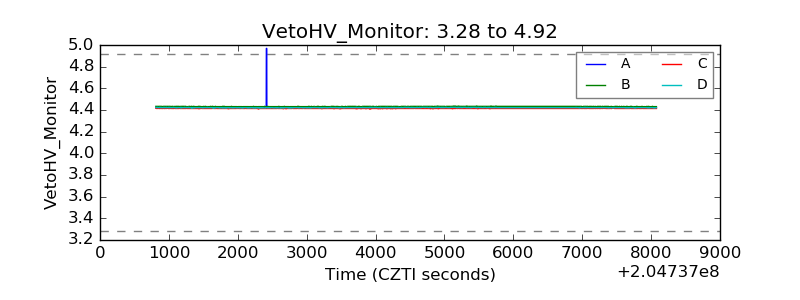 |
| Veto LLD | 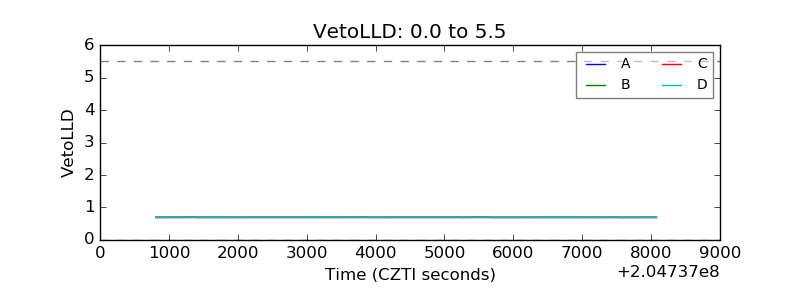 |
| Alpha Counter | 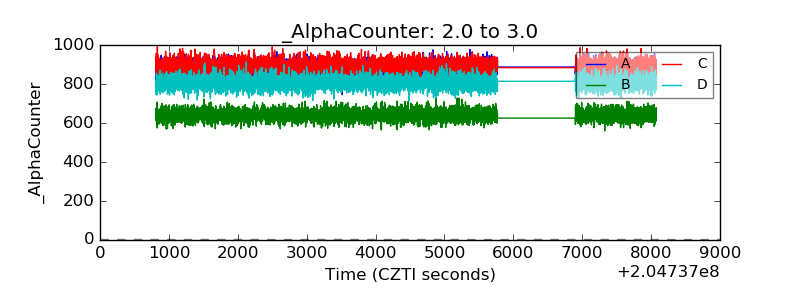 |
| _CPM_Rate | 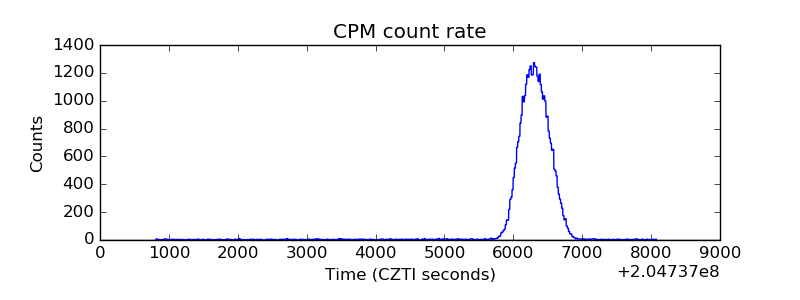 |
| CZT Counter |  |
| +2.5 Volts monitor | 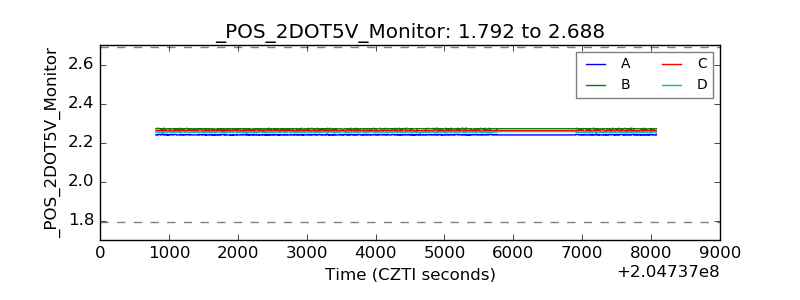 |
| +5 Volts monitor |  |
| _ROLL_ROT | 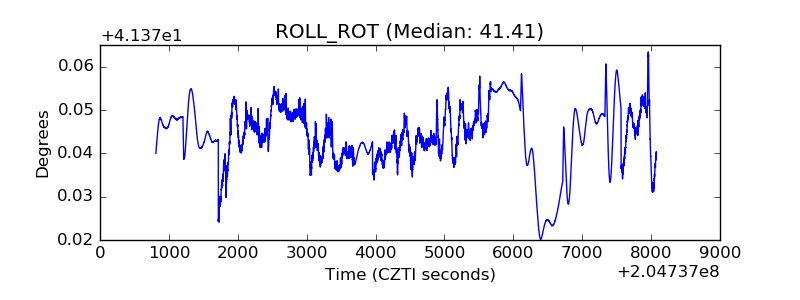 |
| _Roll_DEC | 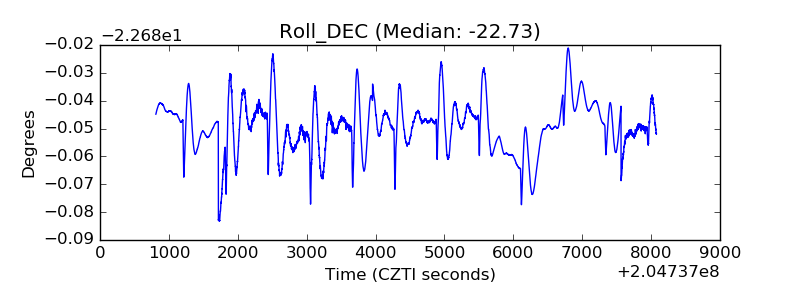 |
| _Roll_RA | 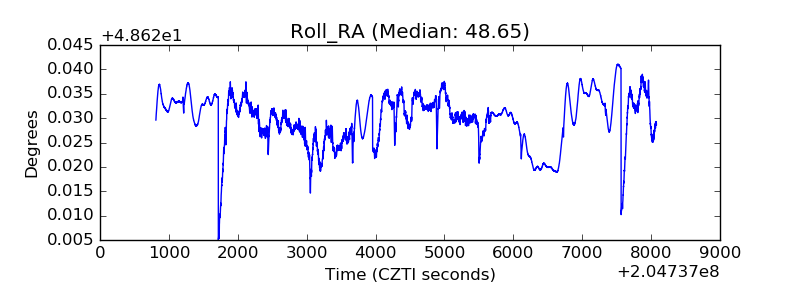 |
| Veto Counter | 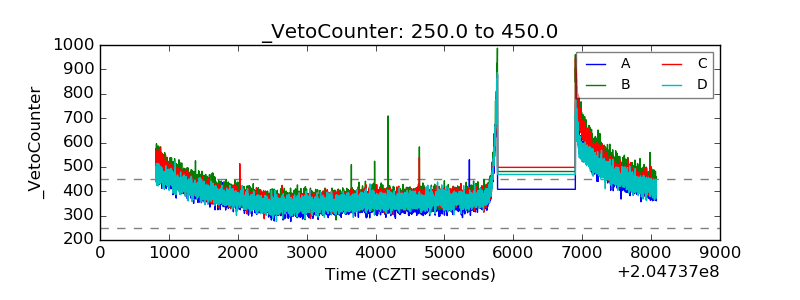 |