| Param | Original file | Final file |
|---|---|---|
| Filename | modeM0/AS1G05_241T04_9000000518_04051cztM0_level2.evt | modeM0/AS1G05_241T04_9000000518_04051cztM0_level2_quad_clean.evt |
| Size (bytes) | 419,987,520 | 53,297,280 |
| Size | 400.5 MB | 50.8 MB |
| Events in quadrant A | 3,054,193 | 300,646 |
| Events in quadrant B | 3,308,143 | 302,127 |
| Events in quadrant C | 2,967,230 | 293,517 |
| Events in quadrant D | 2,970,132 | 286,216 |
| Mode SS | |||
|---|---|---|---|
| Quadrant | BADHDUFLAG | Total packets | Discarded packets |
| A | 0 | 126 | 0 |
| B | 0 | 126 | 0 |
| C | 0 | 126 | 0 |
| D | 0 | 126 | 0 |
| Mode M0 | |||
|---|---|---|---|
| Quadrant | BADHDUFLAG | Total packets | Discarded packets |
| A | 0 | 13102 | 2 |
| B | 0 | 13714 | 1 |
| C | 0 | 12809 | 1 |
| D | 0 | 13141 | 1 |
| Mode M9 | |||
|---|---|---|---|
| Quadrant | BADHDUFLAG | Total packets | Discarded packets |
| A | 0 | 20 | 0 |
| B | 0 | 20 | 0 |
| C | 0 | 20 | 0 |
| D | 0 | 21 | 0 |
| Quadrant | Total seconds | Saturated seconds | Saturation percentage |
|---|---|---|---|
| A | 6171 | 73 | 1.182953% |
| B | 6171 | 93 | 1.507049% |
| C | 6171 | 41 | 0.664398% |
| D | 6171 | 54 | 0.875061% |
Noise dominated data is calculated using 1-second bins in cleaned event files. If a bin has >2000 counts, and if more than 50% of those come from <1% of pixels, then it is considered to be noise-dominated and hence unusable.
| Quadrant | # 1 sec bins | Bins with >0 counts | Bins with >2000 counts | High rate bins dominated by noise | Noise dominated (total time) | Noise dominated (detector-on time) | Marked lightcurve |
|---|---|---|---|---|---|---|---|
| A | 7406 | 6171 | 3 | 3 | 0.04% | 0.05% | 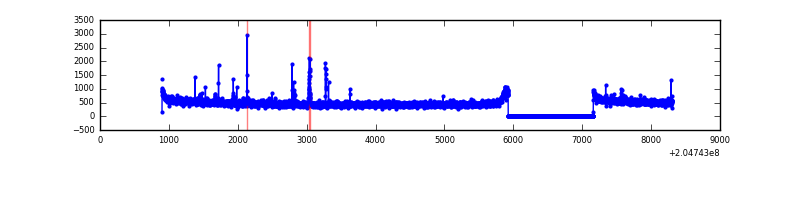 |
| B | 7406 | 6171 | 17 | 17 | 0.23% | 0.28% | 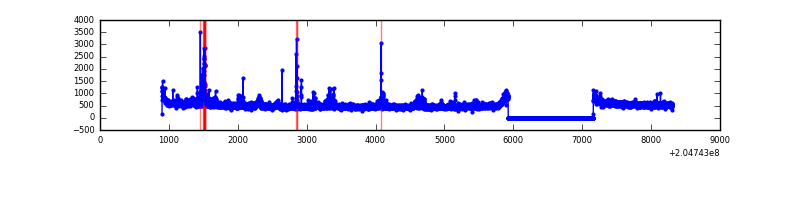 |
| C | 7406 | 6171 | 4 | 4 | 0.05% | 0.06% | 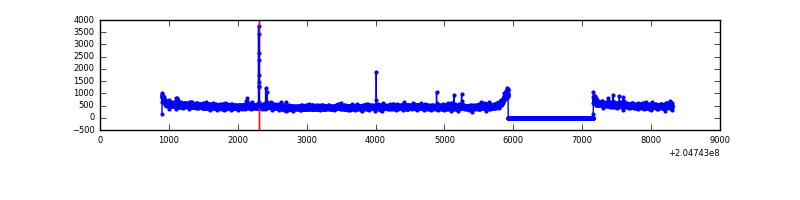 |
| D | 7406 | 6171 | 21 | 21 | 0.28% | 0.34% | 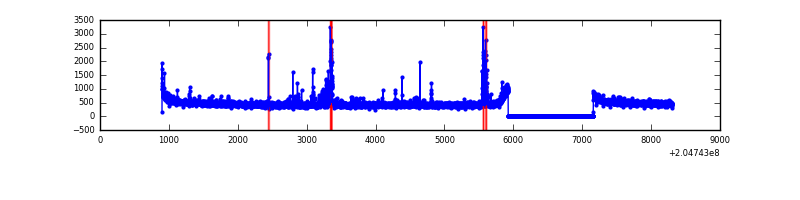 |
Top three noisy pixels from each quadrant. If the there are fewer than three noisy pixels in the level2.evt file, extra rows are filled as -1
| Pixel properties | Quadrant properties | ||||||
|---|---|---|---|---|---|---|---|
| Quadrant | DetID | PixID | Counts | Sigma | Mean | Median | Sigma |
| A | 0 | 118 | 35230 | 220.25 | 767 | 750 | 156.6 |
| A | 0 | 50 | 29359 | 182.75 | 767 | 750 | 156.6 |
| A | 8 | 15 | 21754 | 134.17 | 767 | 750 | 156.6 |
| B | 15 | 204 | 105526 | 709.91 | 775 | 759 | 147.6 |
| B | 7 | 252 | 95766 | 643.77 | 775 | 759 | 147.6 |
| B | 4 | 81 | 77372 | 519.13 | 775 | 759 | 147.6 |
| C | 5 | 254 | 42285 | 241.76 | 739 | 742 | 171.8 |
| C | 9 | 144 | 23164 | 130.49 | 739 | 742 | 171.8 |
| C | 1 | 16 | 11580 | 63.07 | 739 | 742 | 171.8 |
| D | 13 | 174 | 75219 | 418.26 | 738 | 716 | 178.1 |
| D | 13 | 239 | 63148 | 350.49 | 738 | 716 | 178.1 |
| D | 2 | 232 | 21348 | 115.83 | 738 | 716 | 178.1 |
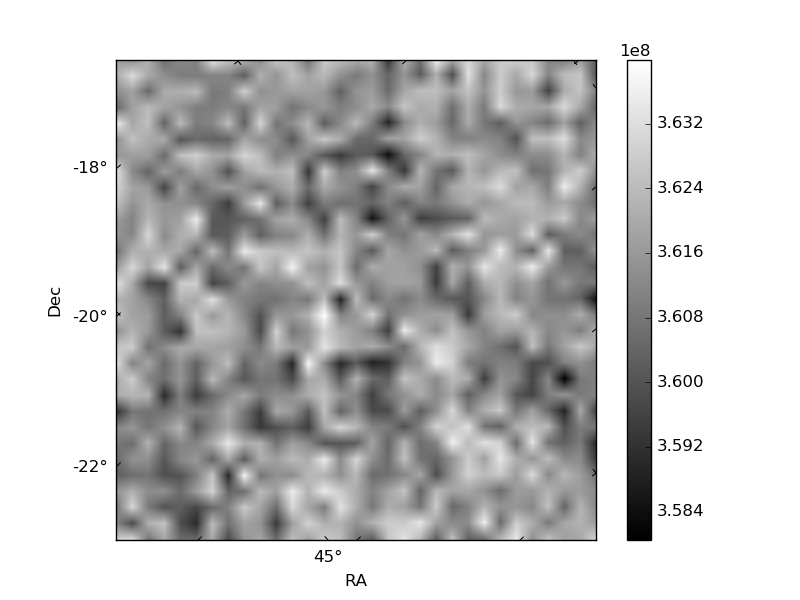
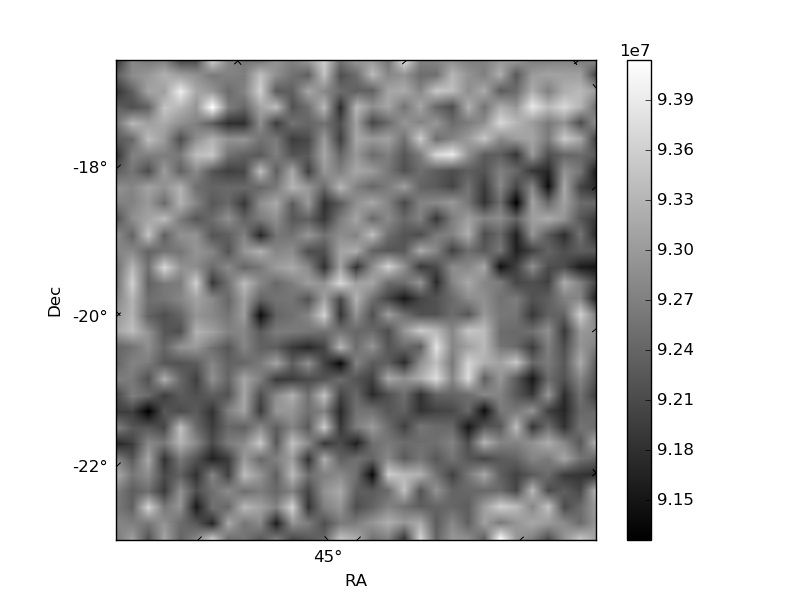
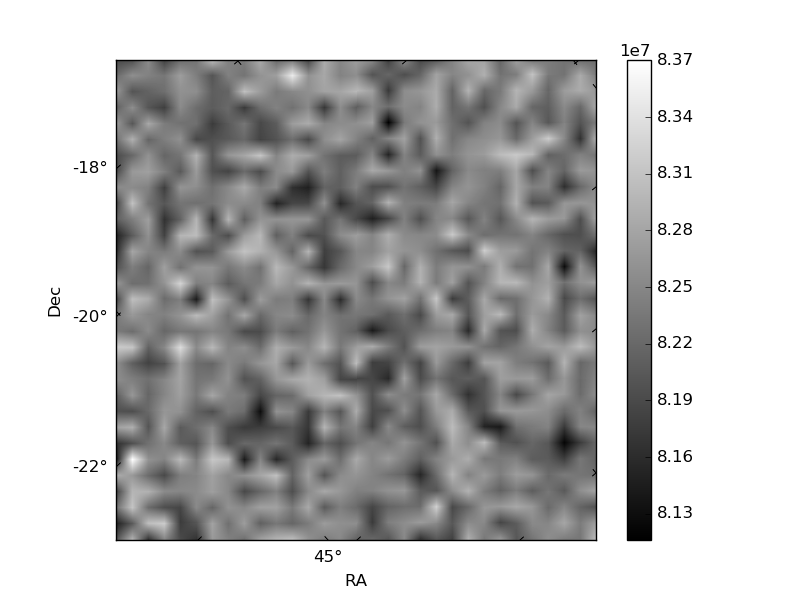
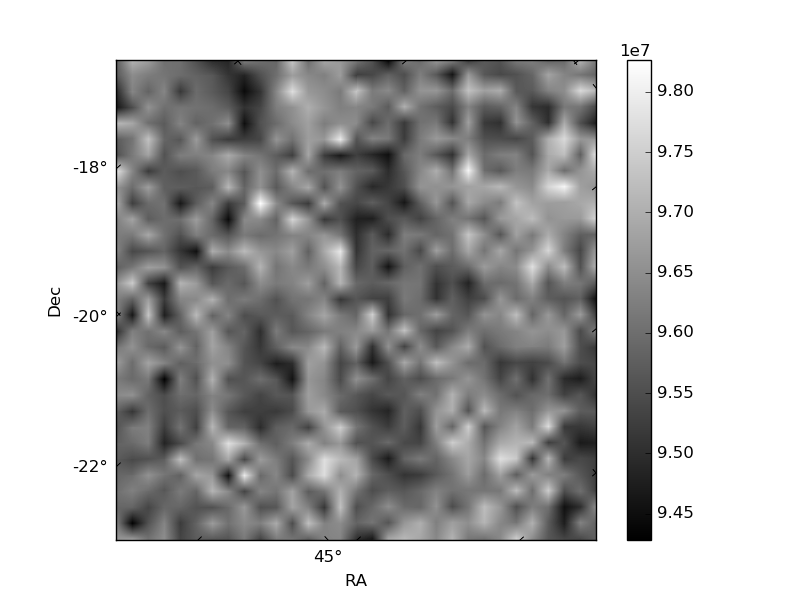
Histogram calculated using DETX and DETY for each event in the final _common_clean file
| Quadrant A | 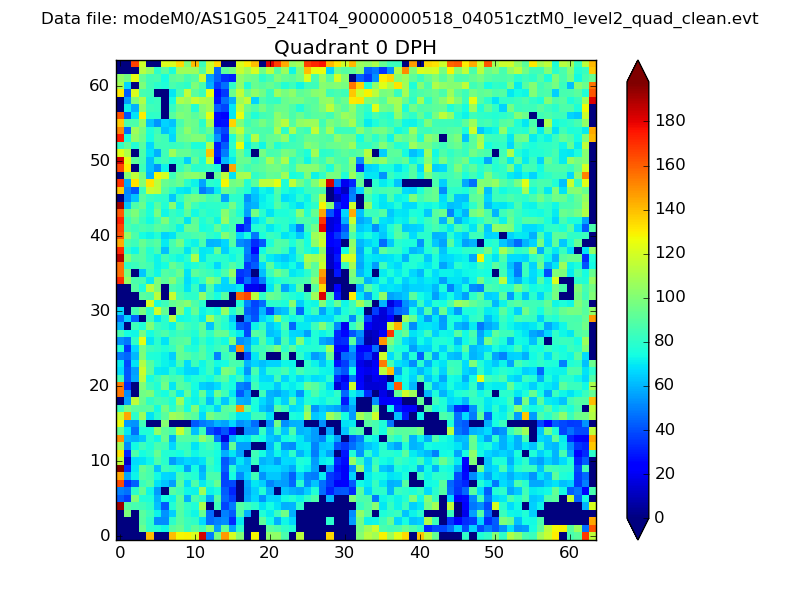 |
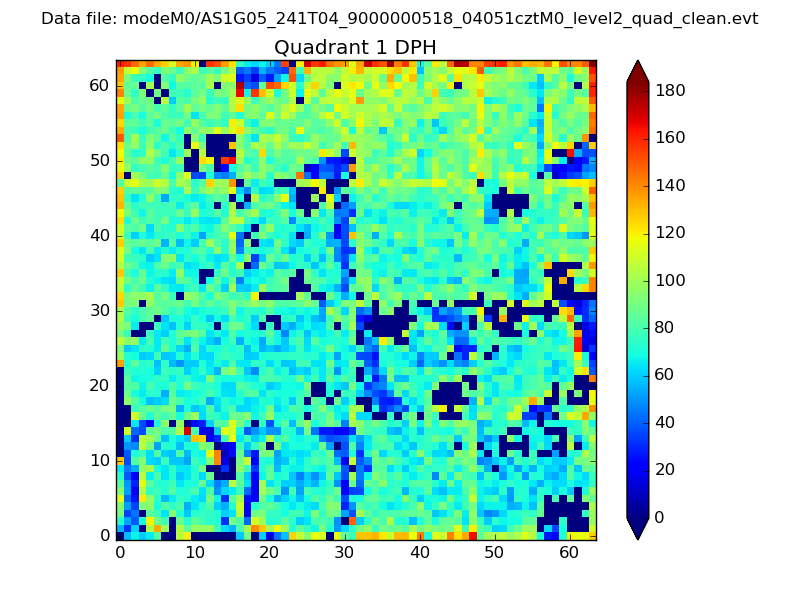 |
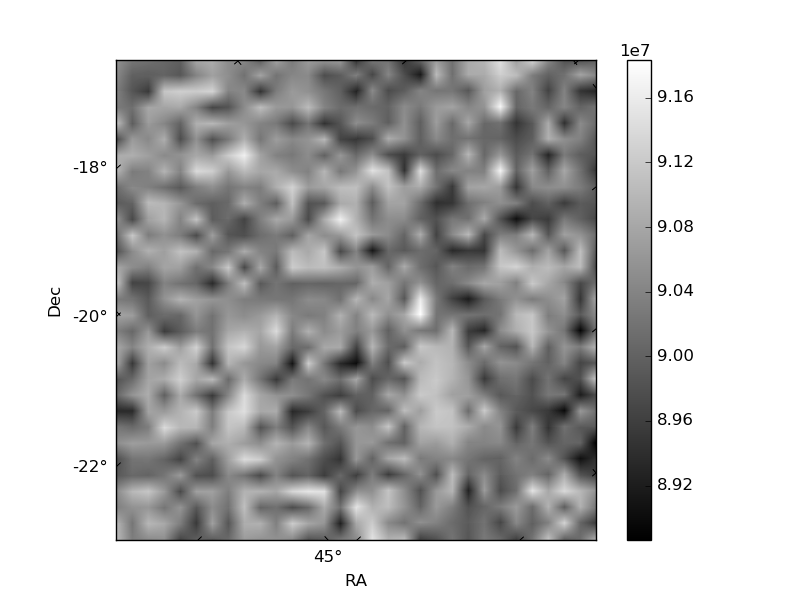
Quadrant B |
|---|---|---|---|
| Quadrant D | 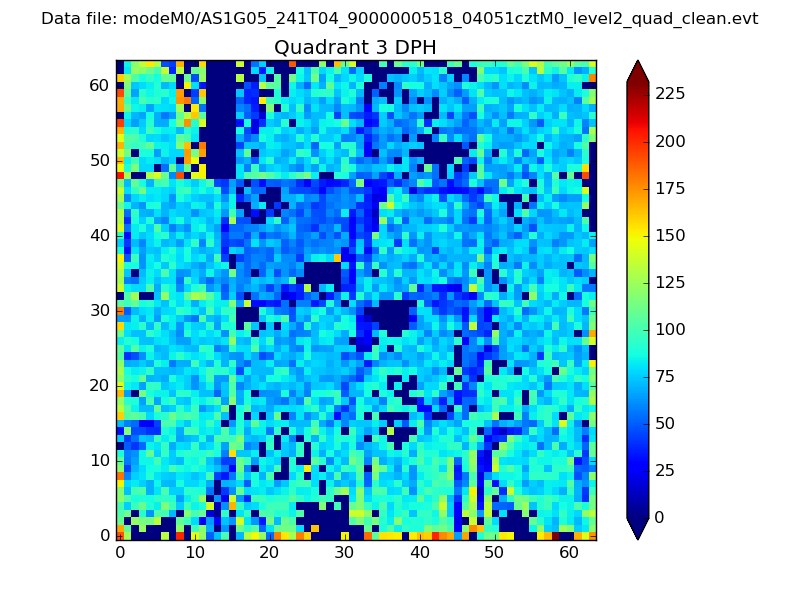 |
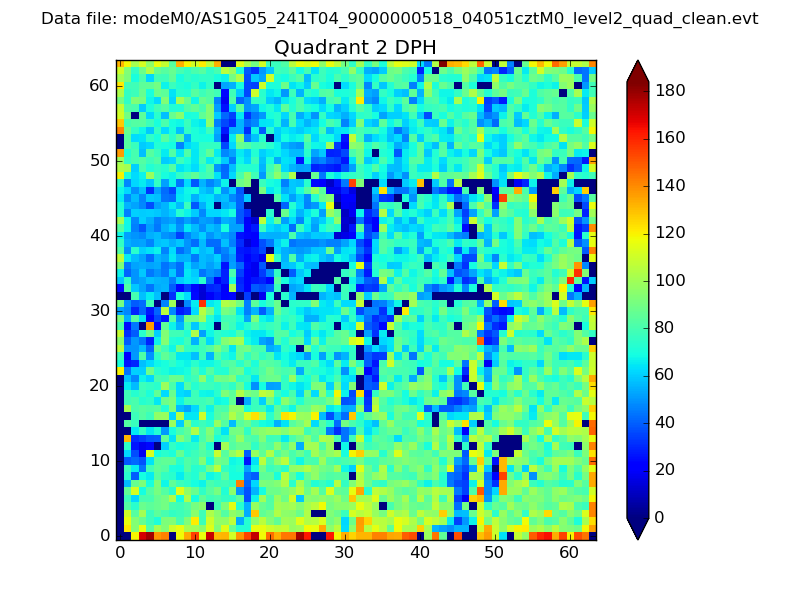 |
Quadrant C |
| Plot type | Count rate plots | Images |
|---|---|---|
| Comparison with Poisson distribution Blue bars denote a histogram of data divided into 1 sec bins. Red curve is a Poisson curve with rate = median count rate of data. |
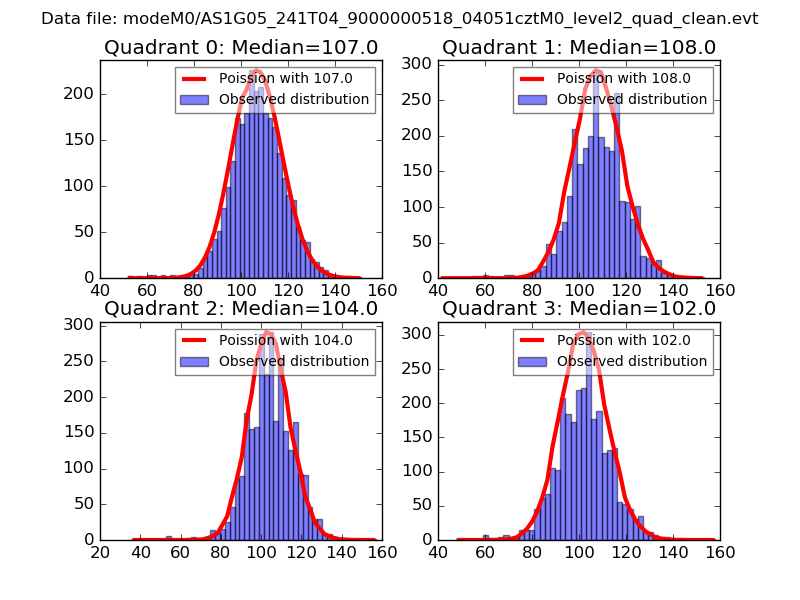 |
 |
| Quadrant-wise count rates Data is divided into 100 sec bins |
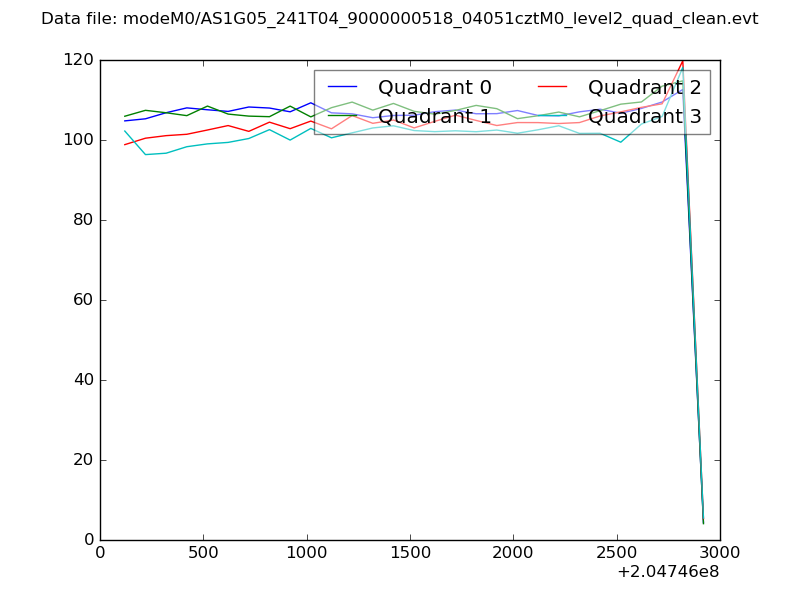 |
|
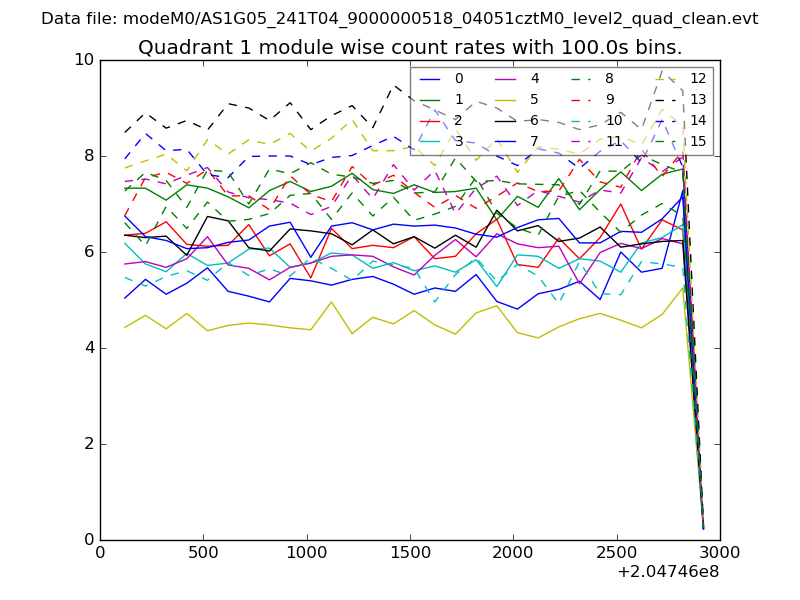
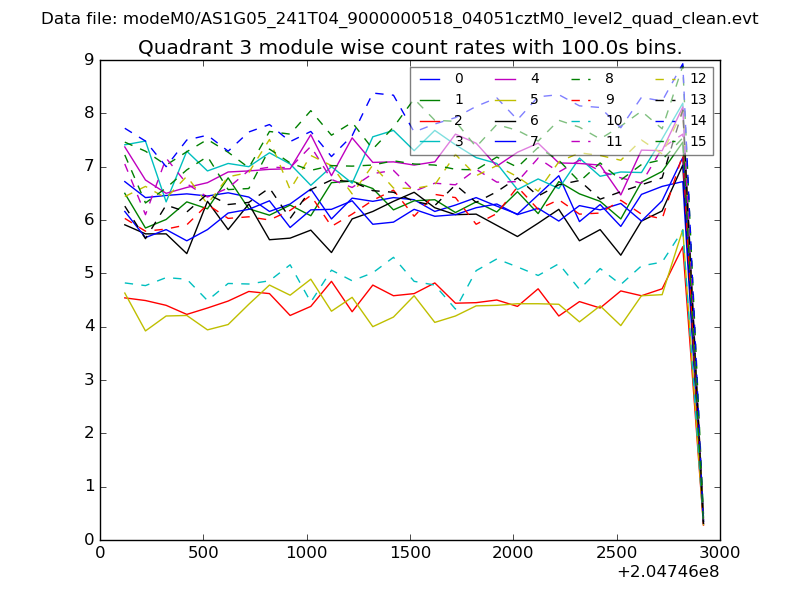
| Module-wise count rates for Quadrant A Data is divided into 100 sec bins |
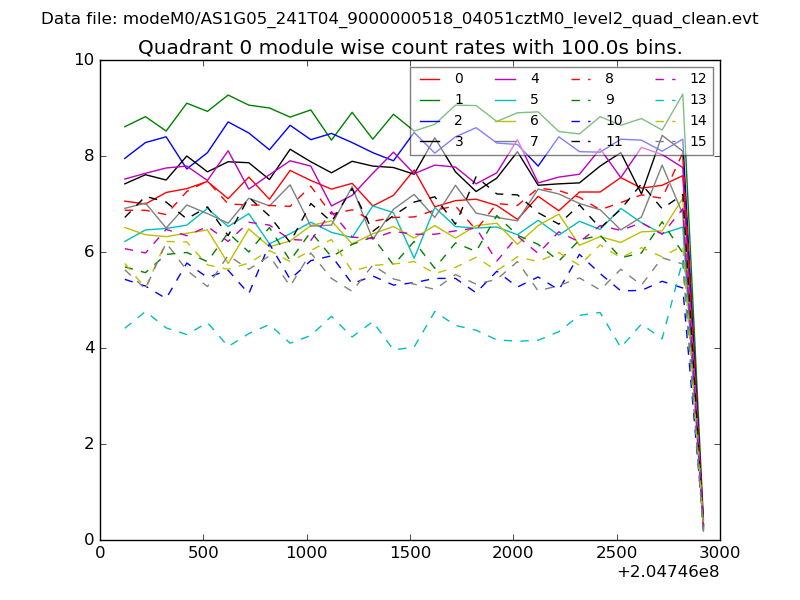 |
 |
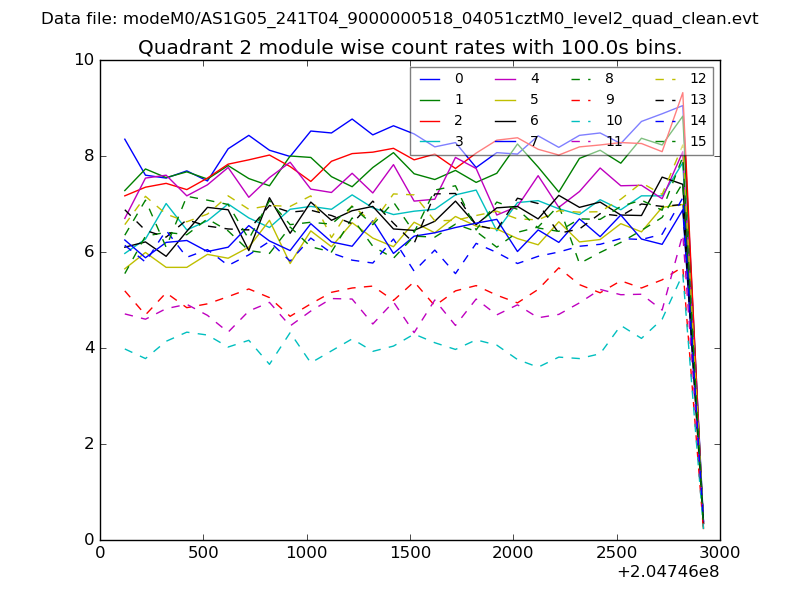
| Module-wise count rates for Quadrant B Data is divided into 100 sec bins |
 |
 |
| Module-wise count rates for Quadrant C Data is divided into 100 sec bins |
 |
 |
| Module-wise count rates for Quadrant D Data is divided into 100 sec bins |
 |
 |
| Parameter | Plot |
|---|---|
| CZT HV Monitor | 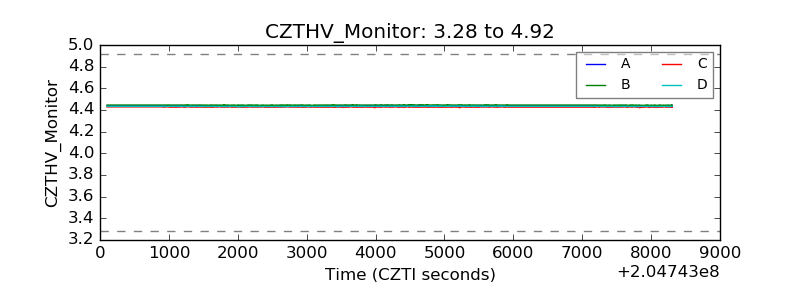 |
| D_VDD | 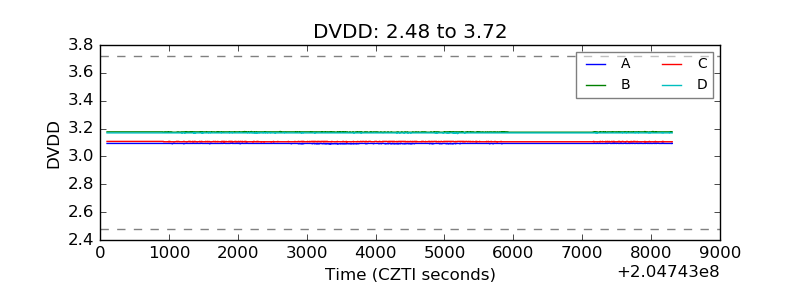 |
| Temperature 1 | 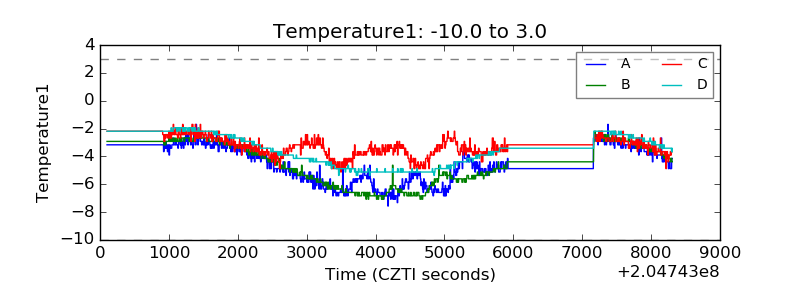 |
| Veto HV Monitor | 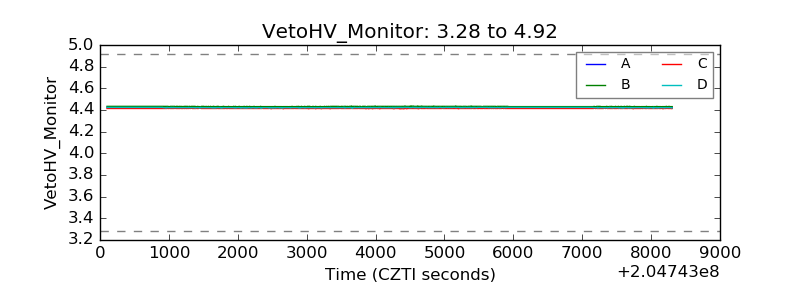 |
| Veto LLD | 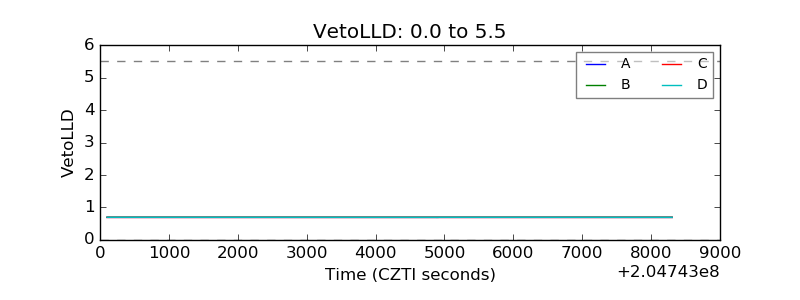 |
| Alpha Counter | 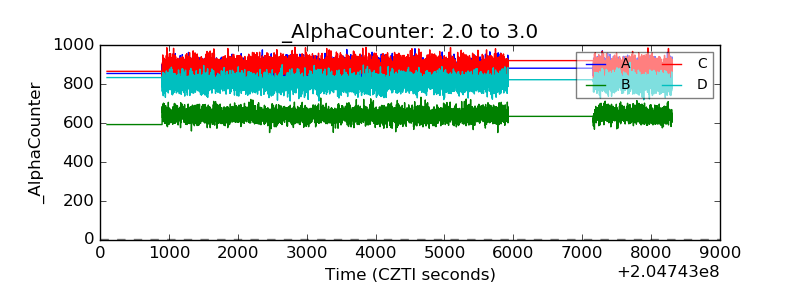 |
| _CPM_Rate | 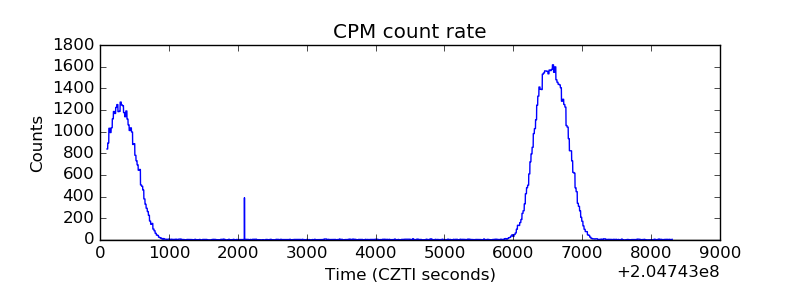 |
| CZT Counter |  |
| +2.5 Volts monitor |  |
| +5 Volts monitor |  |
| _ROLL_ROT | 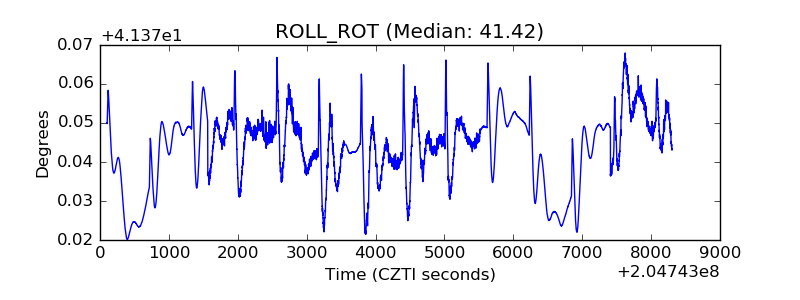 |
| _Roll_DEC | 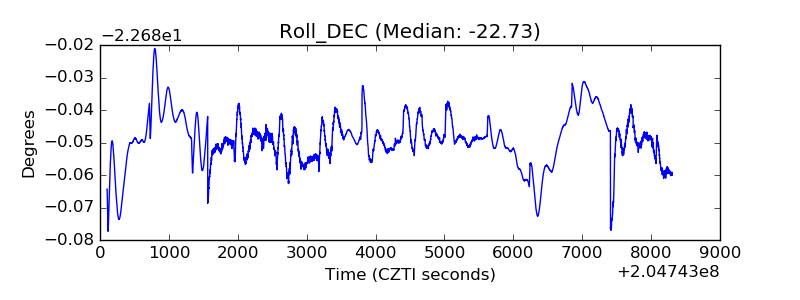 |
| _Roll_RA | 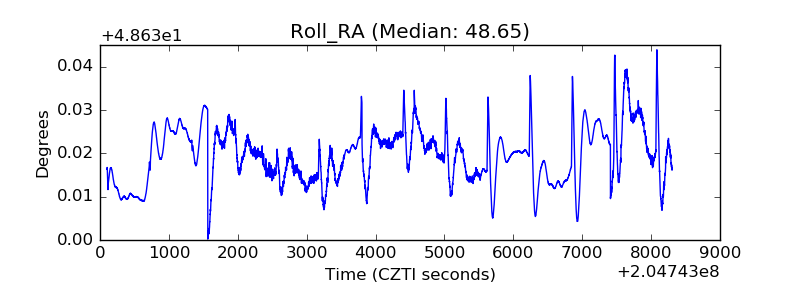 |
| Veto Counter | 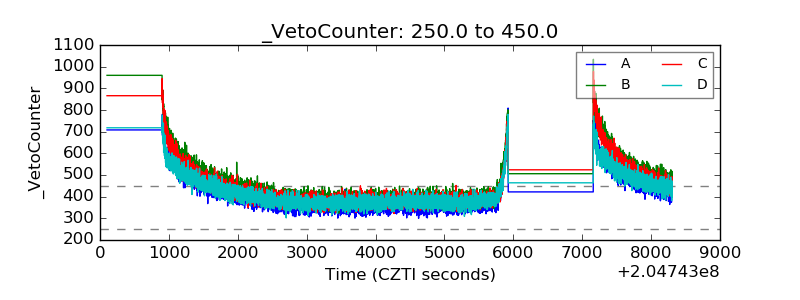 |