| Param | Original file | Final file |
|---|---|---|
| Filename | modeM0/AS1G05_241T04_9000000518_04052cztM0_level2.evt | modeM0/AS1G05_241T04_9000000518_04052cztM0_level2_quad_clean.evt |
| Size (bytes) | 427,973,760 | 58,962,240 |
| Size | 408.1 MB | 56.2 MB |
| Events in quadrant A | 3,379,529 | 344,370 |
| Events in quadrant B | 3,201,101 | 347,125 |
| Events in quadrant C | 2,993,174 | 338,235 |
| Events in quadrant D | 2,970,030 | 326,697 |
| Mode SS | |||
|---|---|---|---|
| Quadrant | BADHDUFLAG | Total packets | Discarded packets |
| A | 0 | 124 | 0 |
| B | 0 | 124 | 0 |
| C | 0 | 124 | 0 |
| D | 0 | 124 | 0 |
| Mode M0 | |||
|---|---|---|---|
| Quadrant | BADHDUFLAG | Total packets | Discarded packets |
| A | 0 | 14000 | 3 |
| B | 0 | 13384 | 2 |
| C | 0 | 12809 | 2 |
| D | 0 | 13015 | 2 |
| Mode M9 | |||
|---|---|---|---|
| Quadrant | BADHDUFLAG | Total packets | Discarded packets |
| A | 0 | 22 | 0 |
| B | 0 | 22 | 0 |
| C | 0 | 22 | 0 |
| D | 0 | 23 | 0 |
| Quadrant | Total seconds | Saturated seconds | Saturation percentage |
|---|---|---|---|
| A | 6142 | 178 | 2.898079% |
| B | 6142 | 58 | 0.944318% |
| C | 6142 | 28 | 0.455878% |
| D | 6142 | 21 | 0.341908% |
Noise dominated data is calculated using 1-second bins in cleaned event files. If a bin has >2000 counts, and if more than 50% of those come from <1% of pixels, then it is considered to be noise-dominated and hence unusable.
| Quadrant | # 1 sec bins | Bins with >0 counts | Bins with >2000 counts | High rate bins dominated by noise | Noise dominated (total time) | Noise dominated (detector-on time) | Marked lightcurve |
|---|---|---|---|---|---|---|---|
| A | 7462 | 6143 | 114 | 114 | 1.53% | 1.86% | 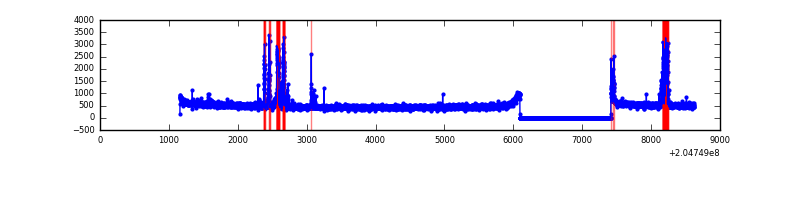 |
| B | 7462 | 6143 | 3 | 3 | 0.04% | 0.05% | 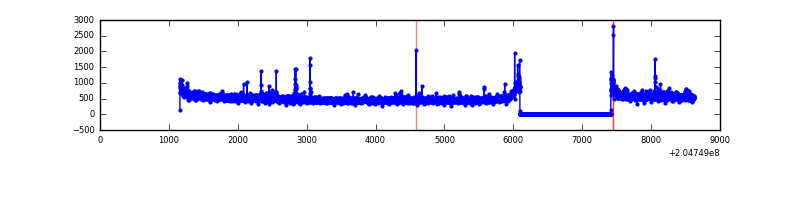 |
| C | 7462 | 6143 | 5 | 5 | 0.07% | 0.08% | 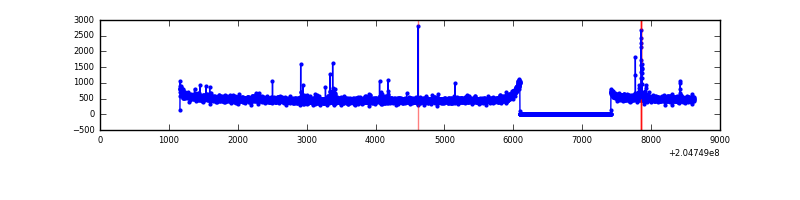 |
| D | 7462 | 6143 | 7 | 7 | 0.09% | 0.11% | 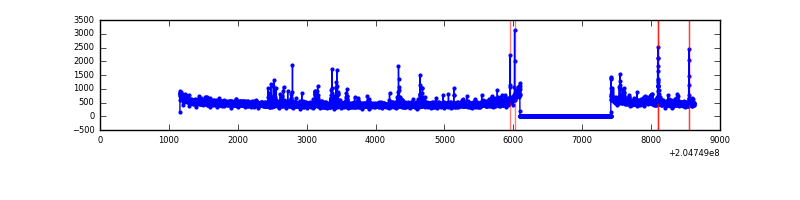 |
Top three noisy pixels from each quadrant. If the there are fewer than three noisy pixels in the level2.evt file, extra rows are filled as -1
| Pixel properties | Quadrant properties | ||||||
|---|---|---|---|---|---|---|---|
| Quadrant | DetID | PixID | Counts | Sigma | Mean | Median | Sigma |
| A | 0 | 50 | 399246 | 2593.38 | 762 | 749 | 153.7 |
| A | 8 | 15 | 23858 | 150.39 | 762 | 749 | 153.7 |
| A | 0 | 118 | 12484 | 76.37 | 762 | 749 | 153.7 |
| B | 15 | 204 | 96755 | 647.45 | 782 | 768 | 148.3 |
| B | 14 | 167 | 28142 | 184.64 | 782 | 768 | 148.3 |
| B | 0 | 183 | 16231 | 104.3 | 782 | 768 | 148.3 |
| C | 9 | 144 | 36671 | 208.92 | 746 | 751 | 171.9 |
| C | 1 | 16 | 18697 | 104.38 | 746 | 751 | 171.9 |
| C | 10 | 65 | 11727 | 63.84 | 746 | 751 | 171.9 |
| D | 2 | 232 | 44581 | 247.3 | 740 | 717 | 177.4 |
| D | 13 | 239 | 37846 | 209.33 | 740 | 717 | 177.4 |
| D | 10 | 246 | 26238 | 143.89 | 740 | 717 | 177.4 |
Histogram calculated using DETX and DETY for each event in the final _common_clean file
| Quadrant A | 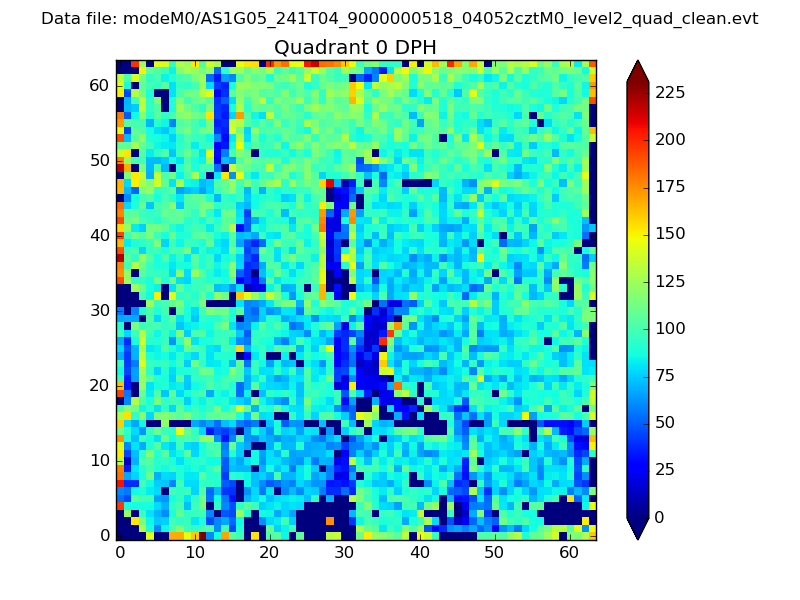 |
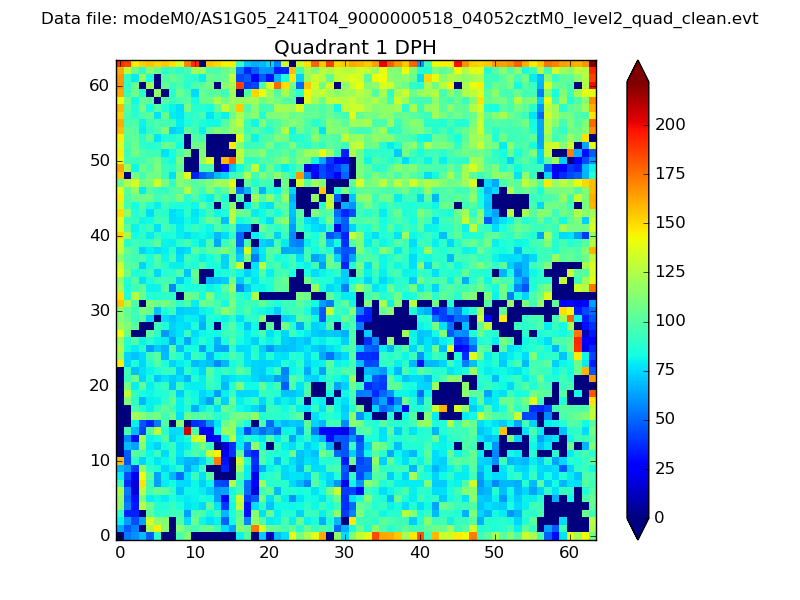 |
Quadrant B |
|---|---|---|---|
| Quadrant D | 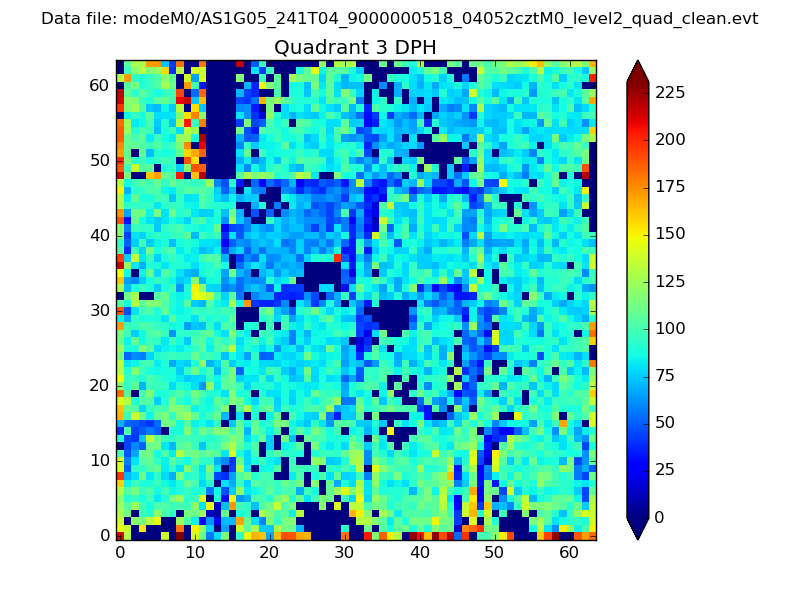 |
 |
Quadrant C |
| Plot type | Count rate plots | Images |
|---|---|---|
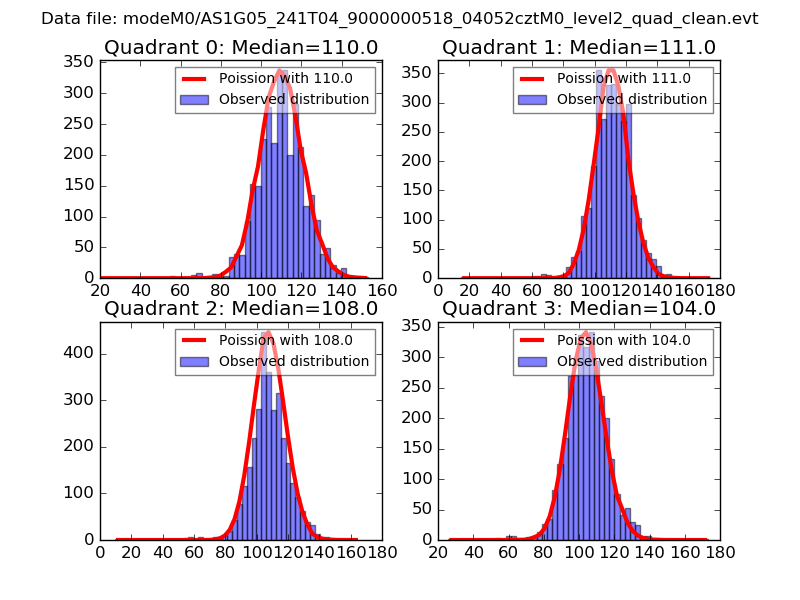
| Comparison with Poisson distribution Blue bars denote a histogram of data divided into 1 sec bins. Red curve is a Poisson curve with rate = median count rate of data. |
 |
 |
| Quadrant-wise count rates Data is divided into 100 sec bins |
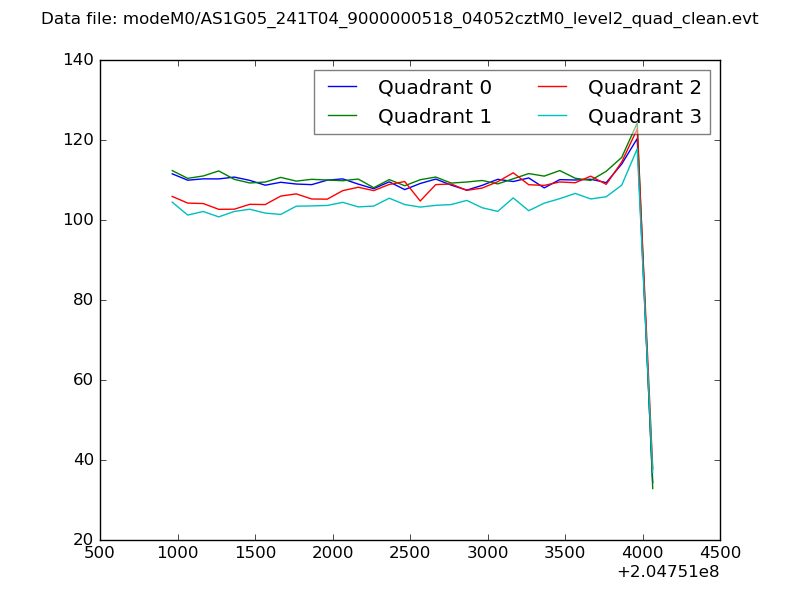 |
|
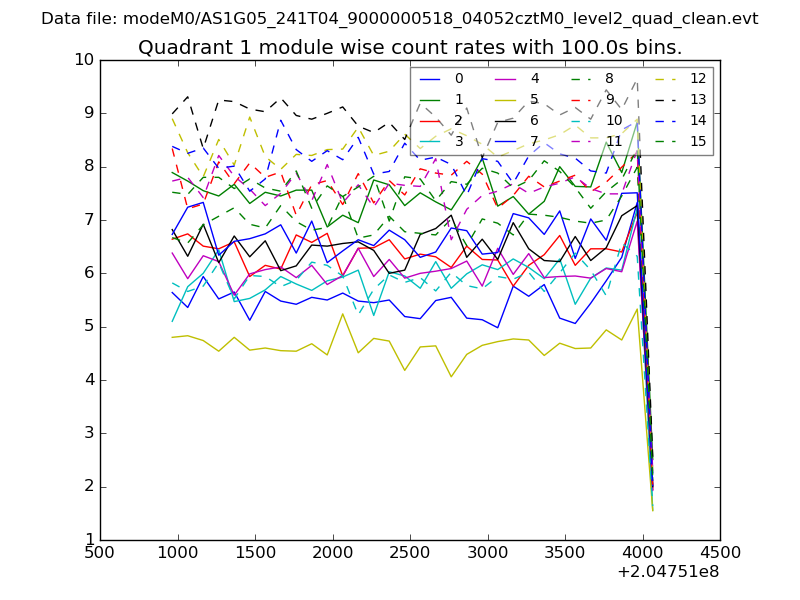
| Module-wise count rates for Quadrant A Data is divided into 100 sec bins |
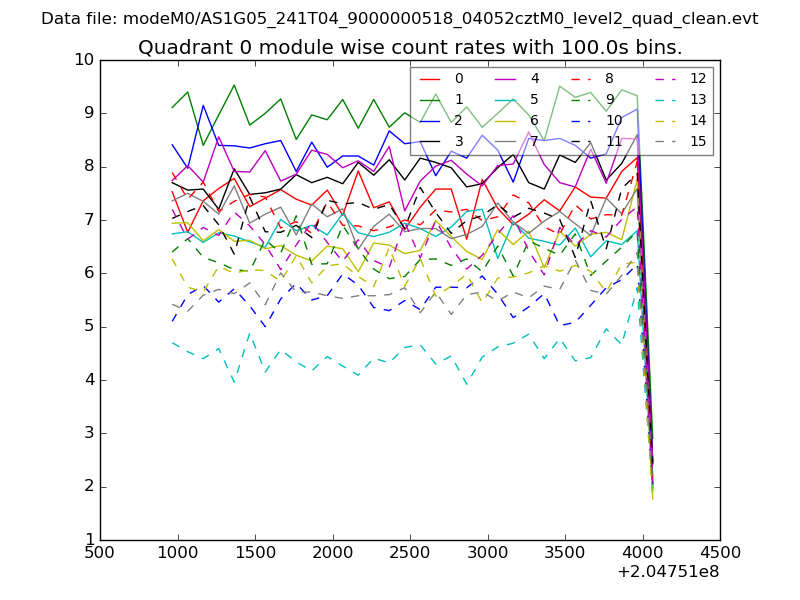 |
 |
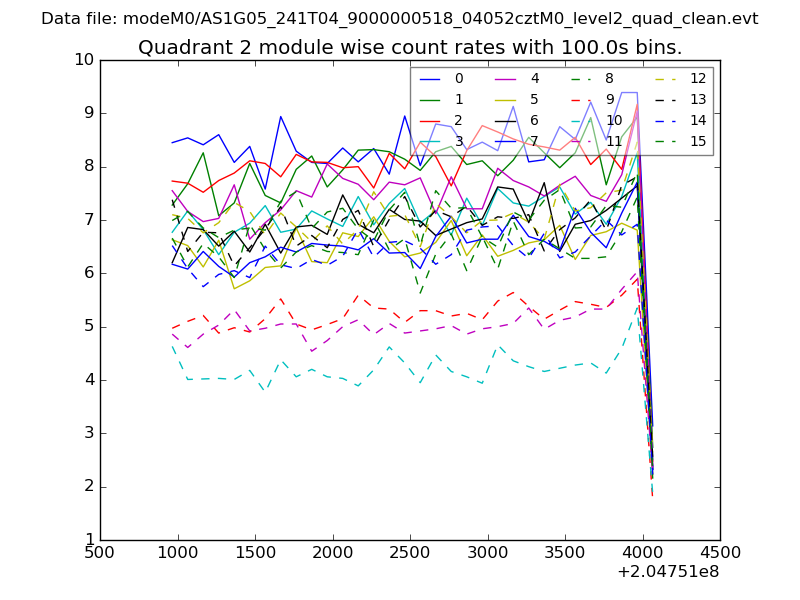
| Module-wise count rates for Quadrant B Data is divided into 100 sec bins |
 |
 |
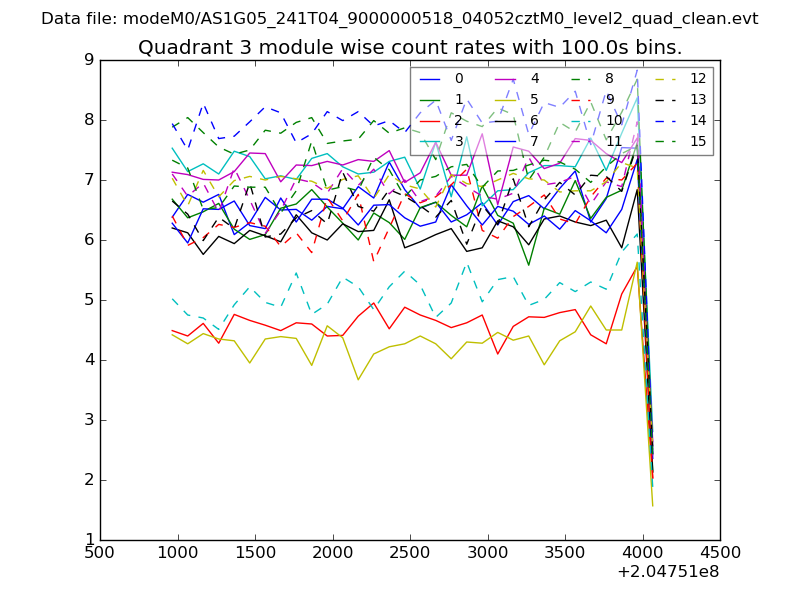
| Module-wise count rates for Quadrant C Data is divided into 100 sec bins |
 |
 |
| Module-wise count rates for Quadrant D Data is divided into 100 sec bins |
 |
 |
| Parameter | Plot |
|---|---|
| CZT HV Monitor | 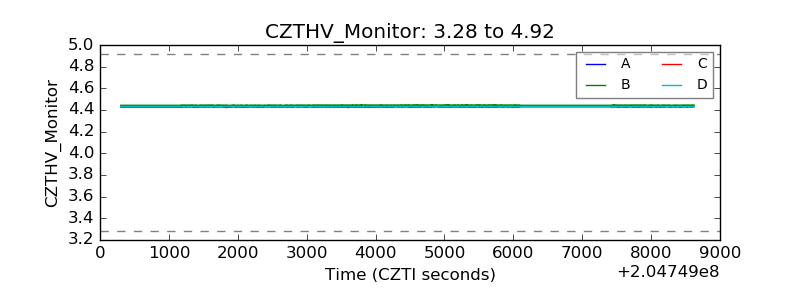 |
| D_VDD | 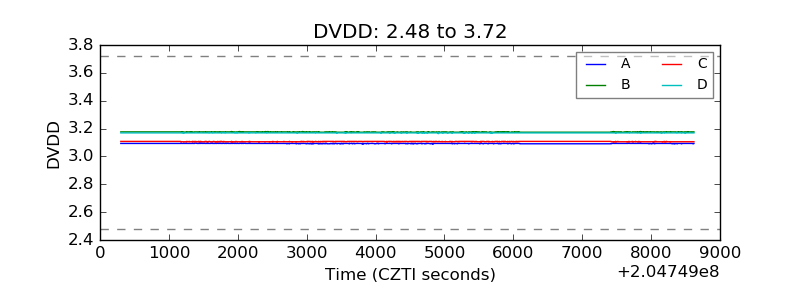 |
| Temperature 1 | 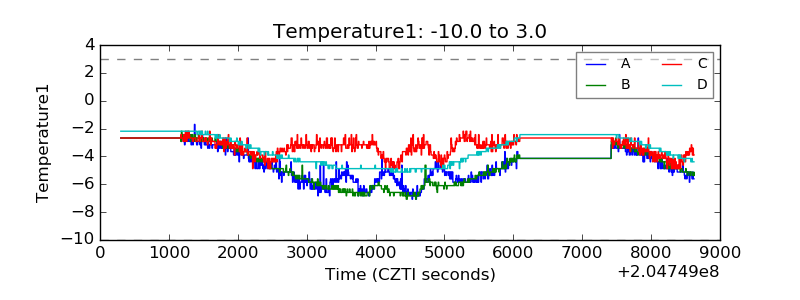 |
| Veto HV Monitor | 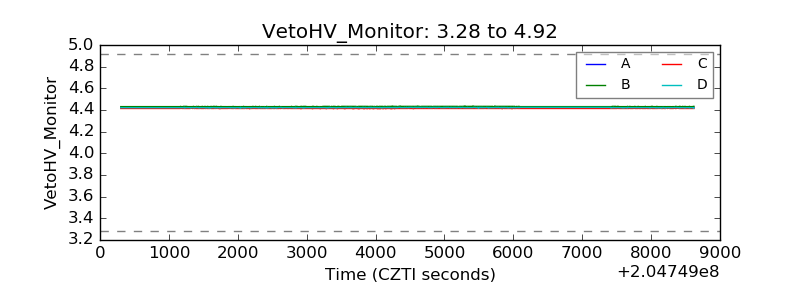 |
| Veto LLD | 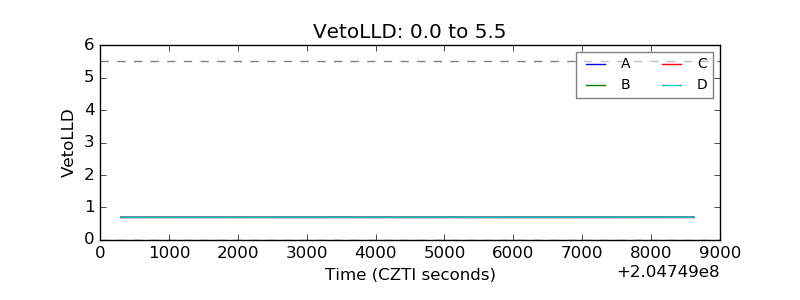 |
| Alpha Counter | 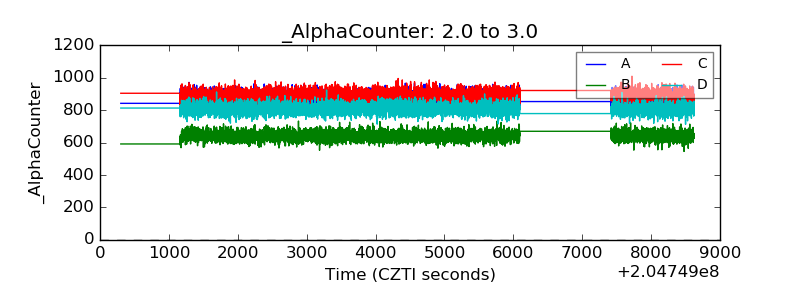 |
| _CPM_Rate | 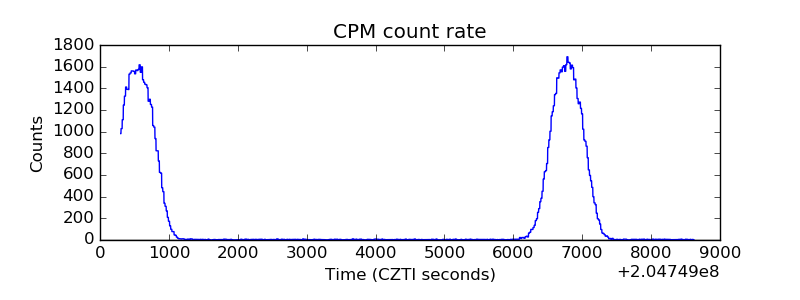 |
| CZT Counter | 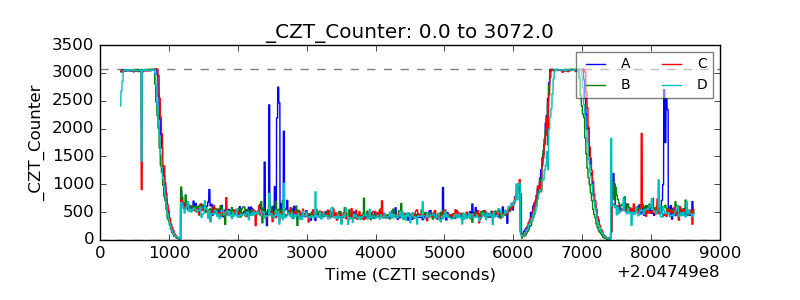 |
| +2.5 Volts monitor |  |
| +5 Volts monitor |  |
| _ROLL_ROT | 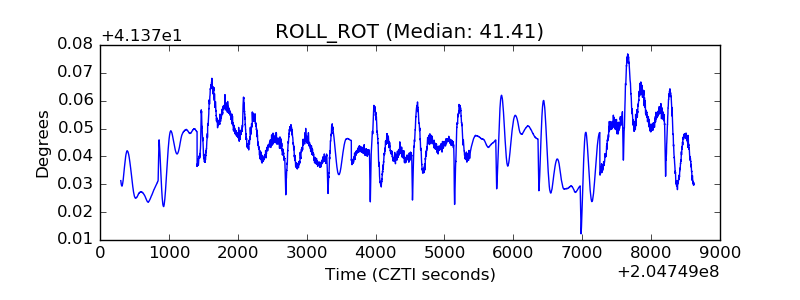 |
| _Roll_DEC | 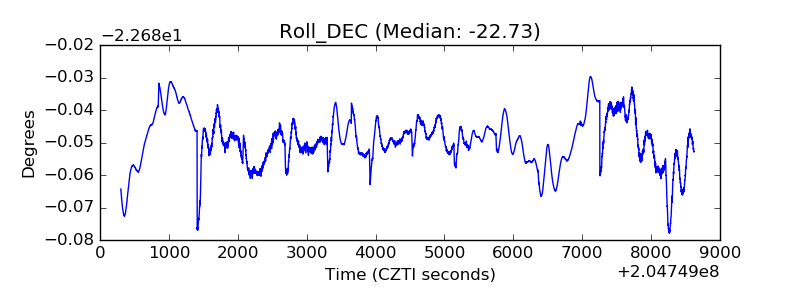 |
| _Roll_RA |  |
| Veto Counter | 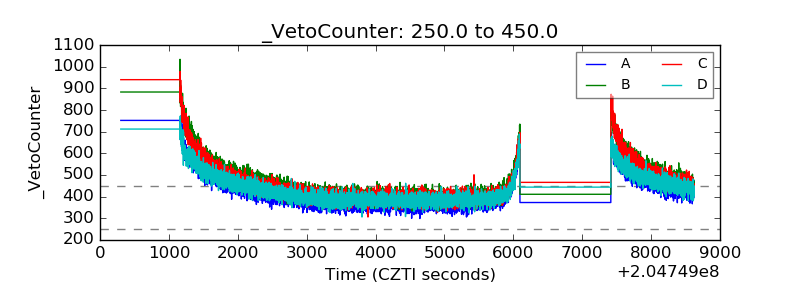 |