| Param | Original file | Final file |
|---|---|---|
| Filename | modeM0/AS1G05_241T04_9000000518_04053cztM0_level2.evt | modeM0/AS1G05_241T04_9000000518_04053cztM0_level2_quad_clean.evt |
| Size (bytes) | 436,625,280 | 68,489,280 |
| Size | 416.4 MB | 65.3 MB |
| Events in quadrant A | 3,320,185 | 414,669 |
| Events in quadrant B | 3,326,667 | 421,312 |
| Events in quadrant C | 3,068,912 | 410,961 |
| Events in quadrant D | 3,087,910 | 395,930 |
| Mode SS | |||
|---|---|---|---|
| Quadrant | BADHDUFLAG | Total packets | Discarded packets |
| A | 0 | 124 | 0 |
| B | 0 | 124 | 0 |
| C | 0 | 124 | 0 |
| D | 0 | 124 | 0 |
| Mode M0 | |||
|---|---|---|---|
| Quadrant | BADHDUFLAG | Total packets | Discarded packets |
| A | 0 | 13797 | 3 |
| B | 0 | 13808 | 2 |
| C | 0 | 13102 | 2 |
| D | 0 | 13427 | 2 |
| Mode M9 | |||
|---|---|---|---|
| Quadrant | BADHDUFLAG | Total packets | Discarded packets |
| A | 0 | 21 | 0 |
| B | 0 | 21 | 0 |
| C | 0 | 21 | 0 |
| D | 0 | 22 | 0 |
| Quadrant | Total seconds | Saturated seconds | Saturation percentage |
|---|---|---|---|
| A | 6177 | 130 | 2.104582% |
| B | 6177 | 103 | 1.667476% |
| C | 6177 | 63 | 1.019913% |
| D | 6177 | 67 | 1.084669% |
Noise dominated data is calculated using 1-second bins in cleaned event files. If a bin has >2000 counts, and if more than 50% of those come from <1% of pixels, then it is considered to be noise-dominated and hence unusable.
| Quadrant | # 1 sec bins | Bins with >0 counts | Bins with >2000 counts | High rate bins dominated by noise | Noise dominated (total time) | Noise dominated (detector-on time) | Marked lightcurve |
|---|---|---|---|---|---|---|---|
| A | 7482 | 6178 | 64 | 64 | 0.86% | 1.04% | 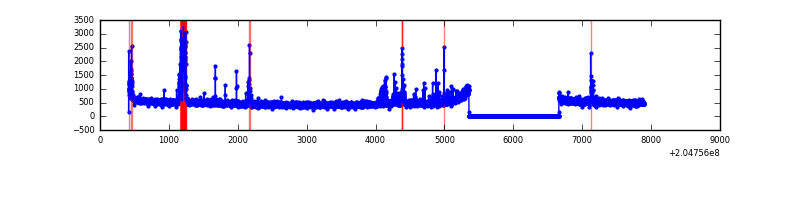 |
| B | 7482 | 6178 | 23 | 23 | 0.31% | 0.37% | 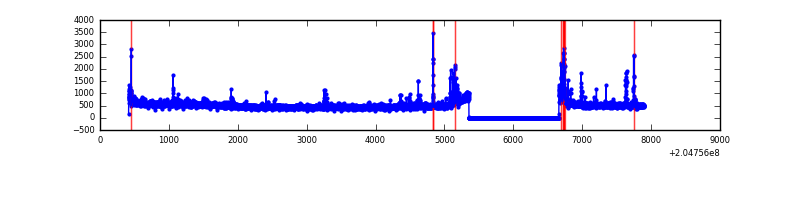 |
| C | 7482 | 6178 | 33 | 33 | 0.44% | 0.53% | 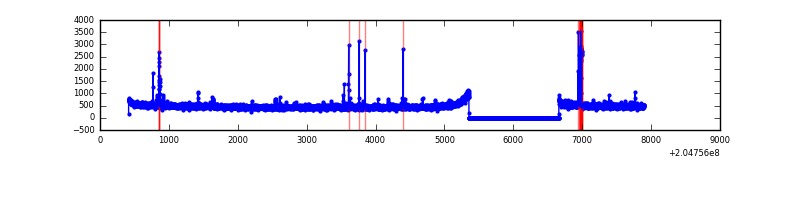 |
| D | 7482 | 6178 | 40 | 40 | 0.53% | 0.65% | 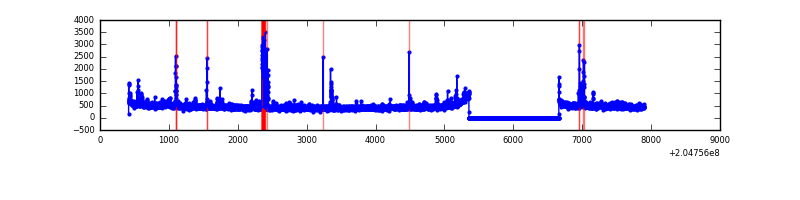 |
Top three noisy pixels from each quadrant. If the there are fewer than three noisy pixels in the level2.evt file, extra rows are filled as -1
| Pixel properties | Quadrant properties | ||||||
|---|---|---|---|---|---|---|---|
| Quadrant | DetID | PixID | Counts | Sigma | Mean | Median | Sigma |
| A | 0 | 50 | 186177 | 1188.01 | 761 | 745 | 156.1 |
| A | 8 | 15 | 154243 | 983.41 | 761 | 745 | 156.1 |
| A | 0 | 118 | 24209 | 150.33 | 761 | 745 | 156.1 |
| B | 14 | 167 | 174350 | 1183.7 | 775 | 758 | 146.7 |
| B | 15 | 204 | 76160 | 514.16 | 775 | 758 | 146.7 |
| B | 0 | 183 | 19041 | 124.67 | 775 | 758 | 146.7 |
| C | 9 | 144 | 133473 | 772.75 | 744 | 750 | 171.8 |
| C | 1 | 16 | 25076 | 141.63 | 744 | 750 | 171.8 |
| C | 13 | 61 | 6213 | 31.81 | 744 | 750 | 171.8 |
| D | 12 | 227 | 108346 | 599.09 | 741 | 721 | 179.6 |
| D | 10 | 246 | 73166 | 403.26 | 741 | 721 | 179.6 |
| D | 2 | 232 | 45709 | 250.42 | 741 | 721 | 179.6 |
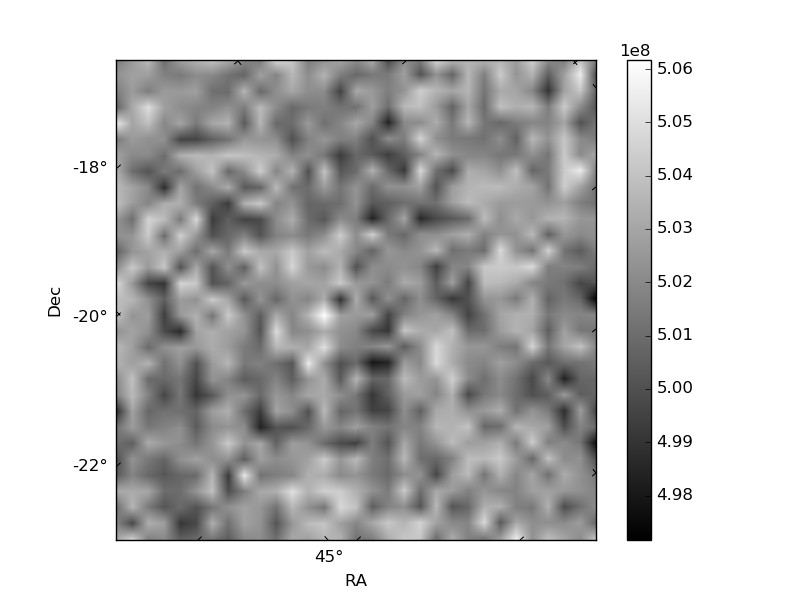
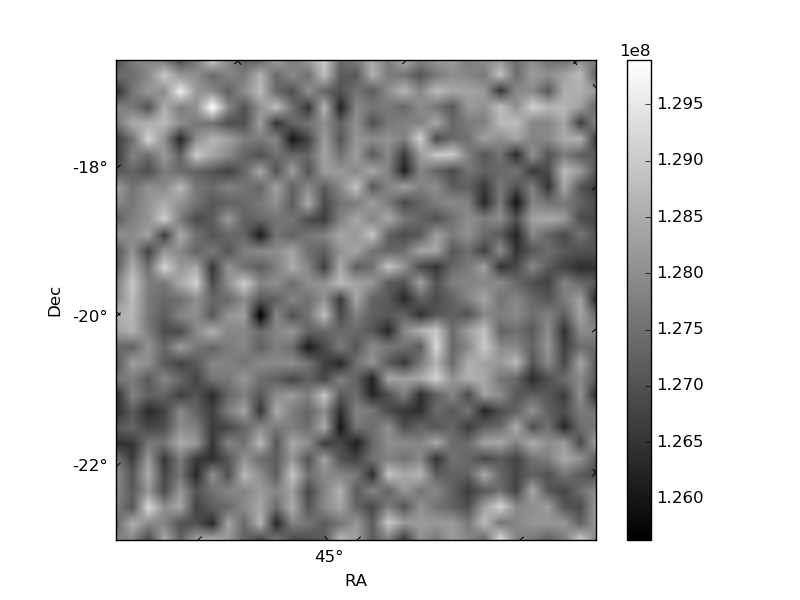
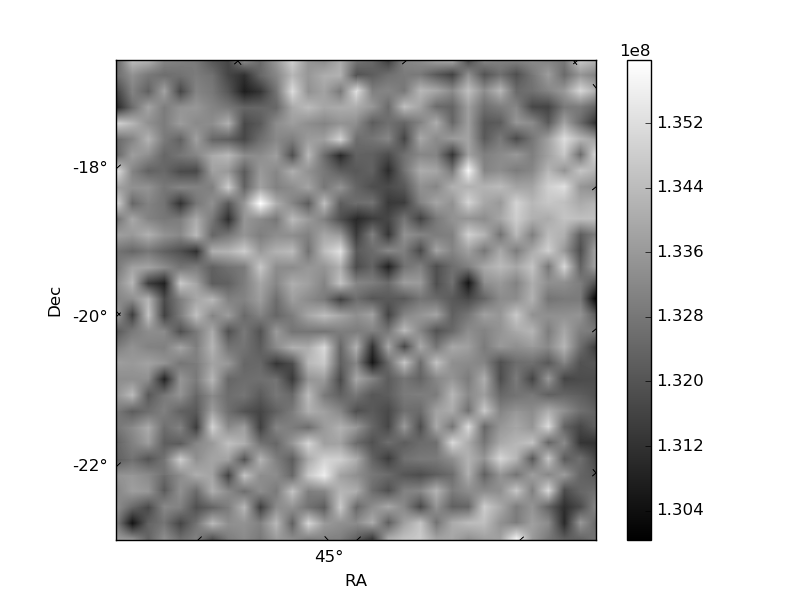
Histogram calculated using DETX and DETY for each event in the final _common_clean file
| Quadrant A | 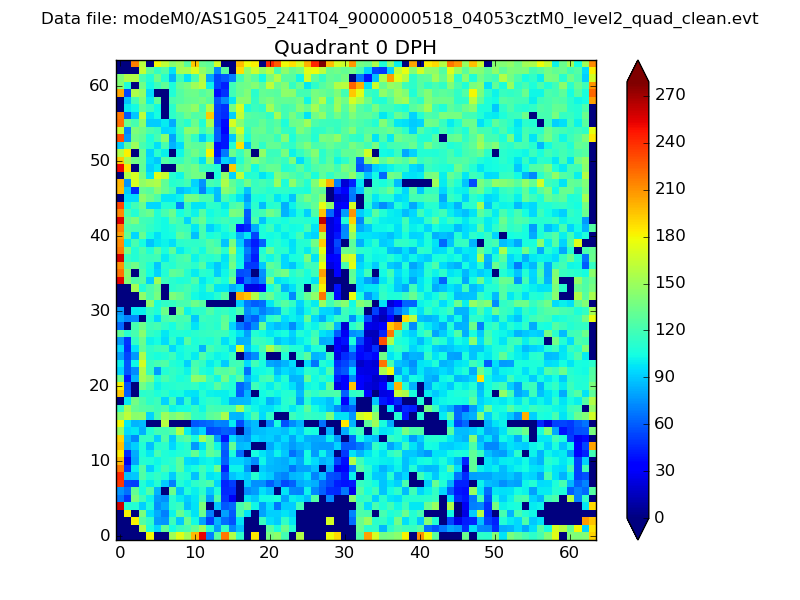 |
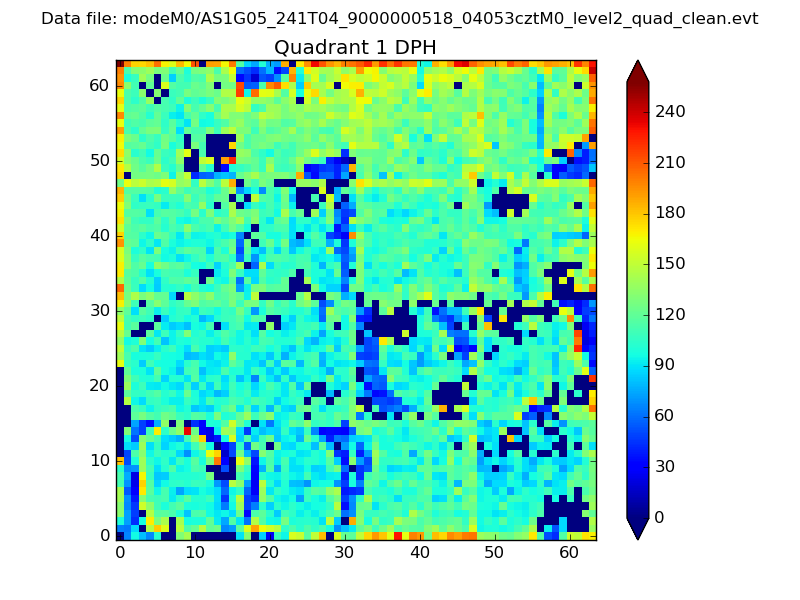 |
Quadrant B |
|---|---|---|---|
| Quadrant D | 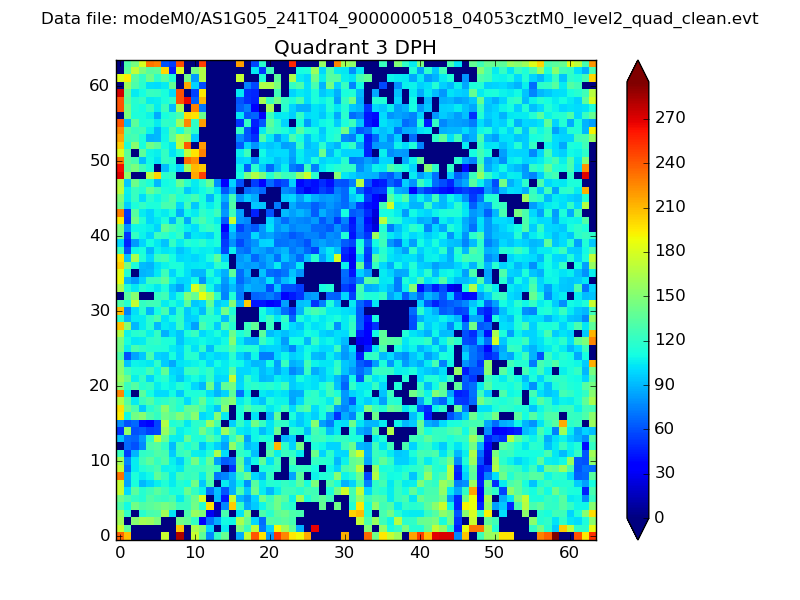 |
 |
Quadrant C |
| Plot type | Count rate plots | Images |
|---|---|---|
| Comparison with Poisson distribution Blue bars denote a histogram of data divided into 1 sec bins. Red curve is a Poisson curve with rate = median count rate of data. |
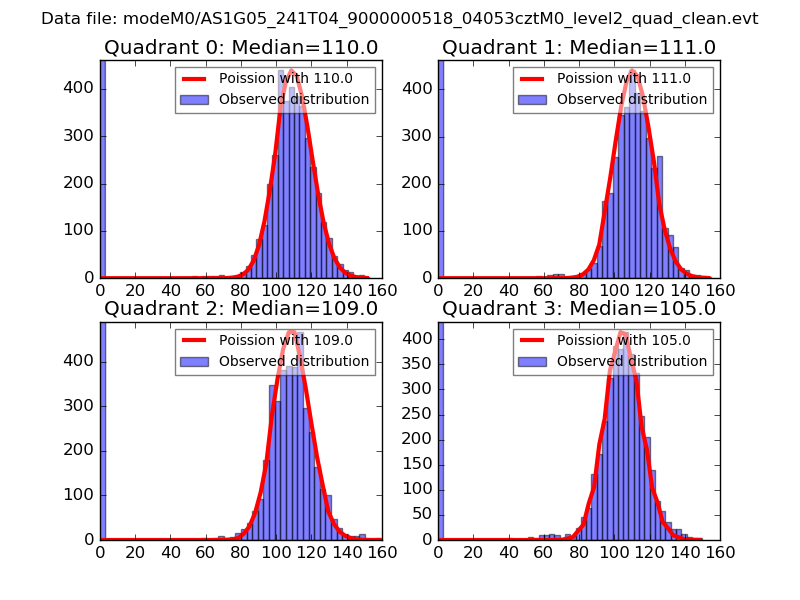 |
 |
| Quadrant-wise count rates Data is divided into 100 sec bins |
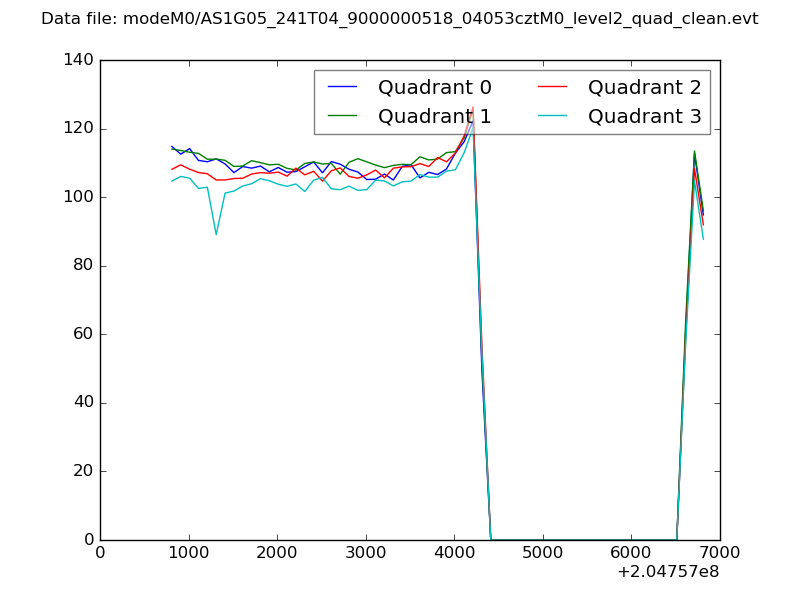 |
|
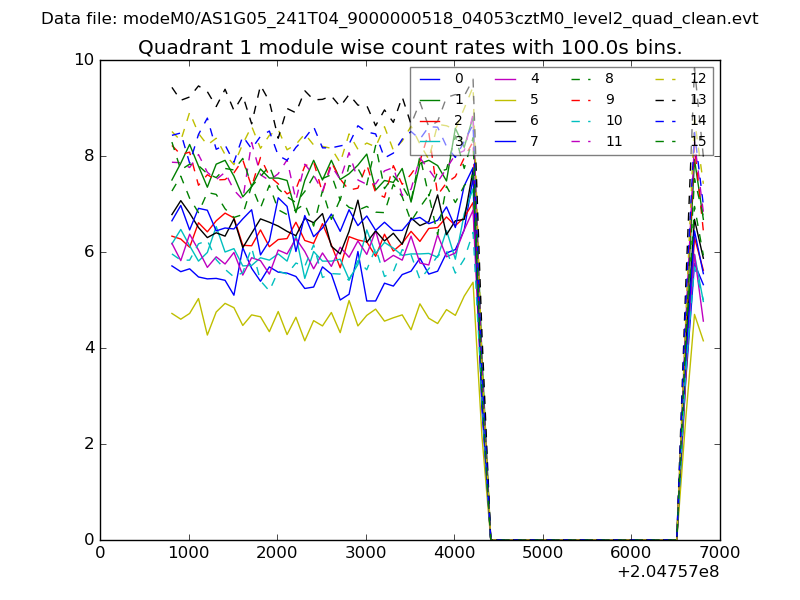
| Module-wise count rates for Quadrant A Data is divided into 100 sec bins |
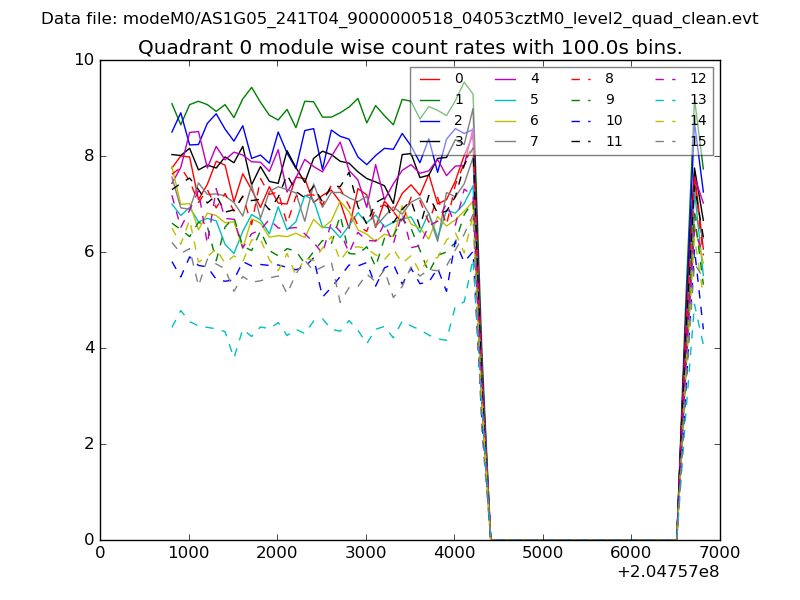 |
 |
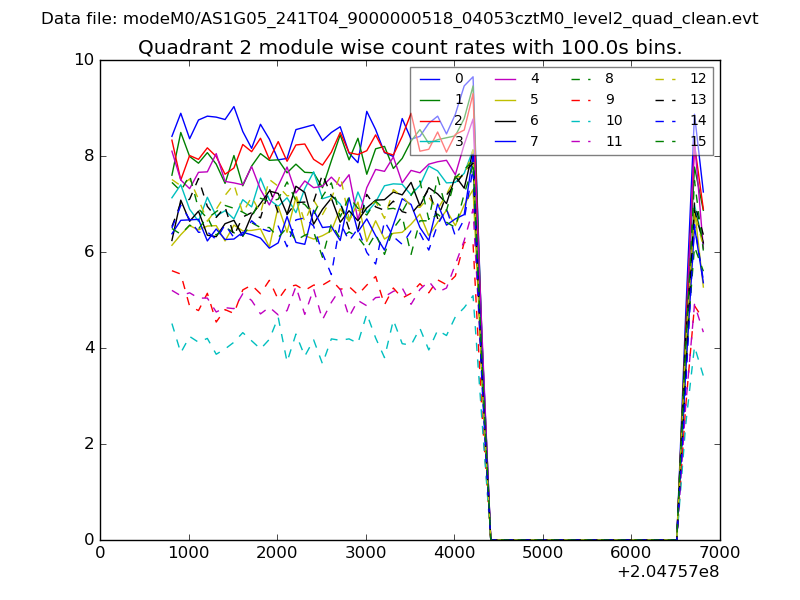
| Module-wise count rates for Quadrant B Data is divided into 100 sec bins |
 |
 |
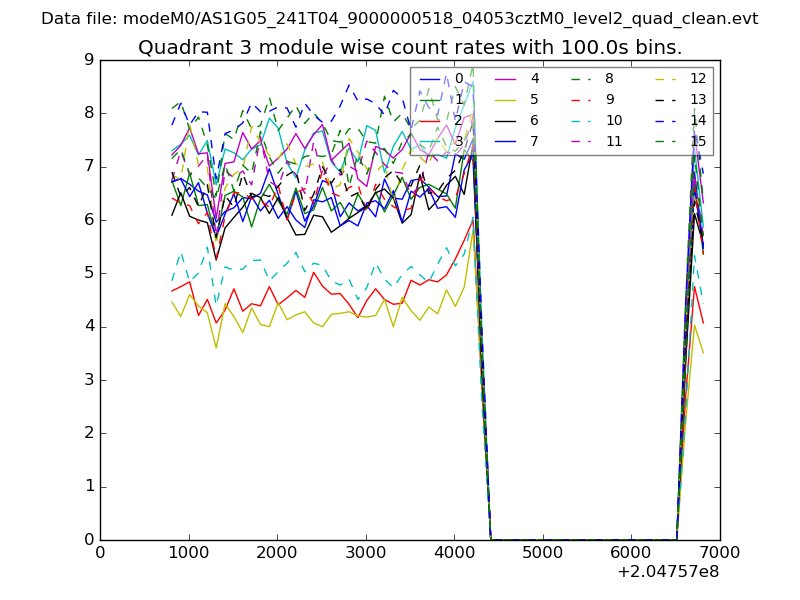
| Module-wise count rates for Quadrant C Data is divided into 100 sec bins |
 |
 |
| Module-wise count rates for Quadrant D Data is divided into 100 sec bins |
 |
 |
| Parameter | Plot |
|---|---|
| CZT HV Monitor | 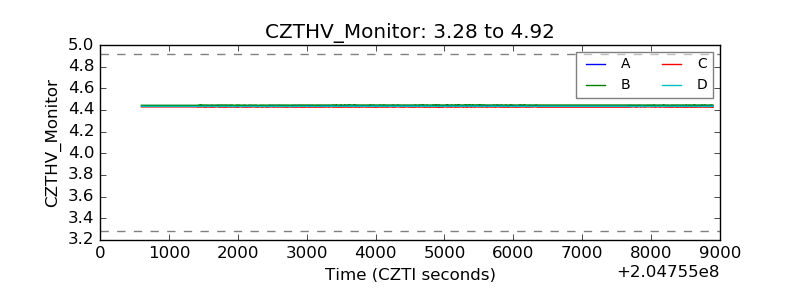 |
| D_VDD |  |
| Temperature 1 | 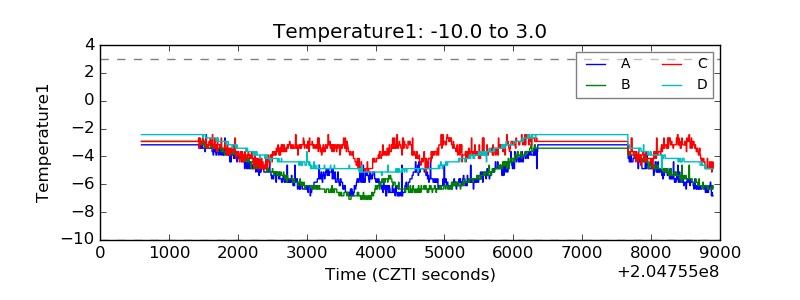 |
| Veto HV Monitor |  |
| Veto LLD | 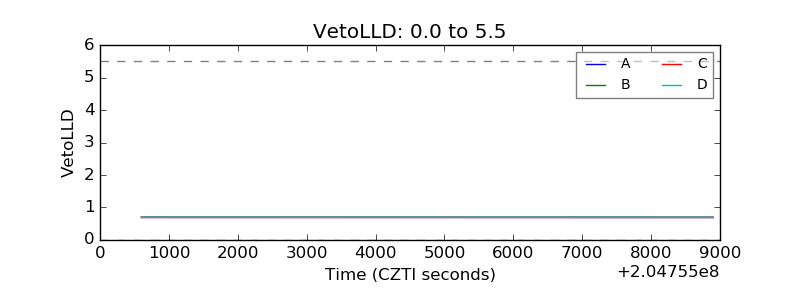 |
| Alpha Counter | 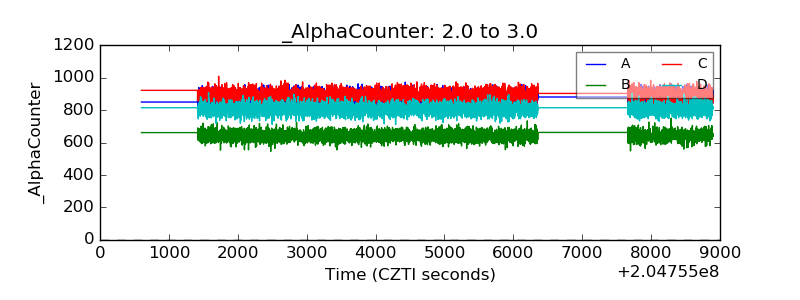 |
| _CPM_Rate | 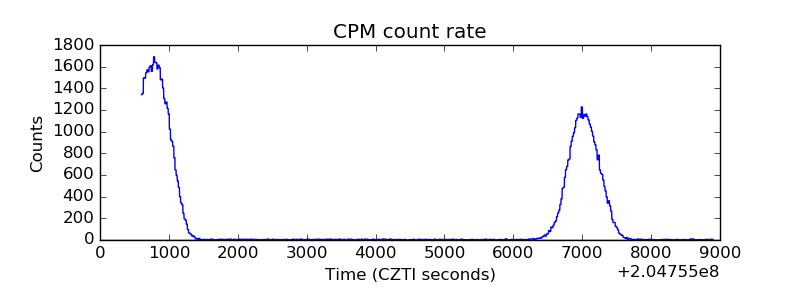 |
| CZT Counter |  |
| +2.5 Volts monitor |  |
| +5 Volts monitor |  |
| _ROLL_ROT | 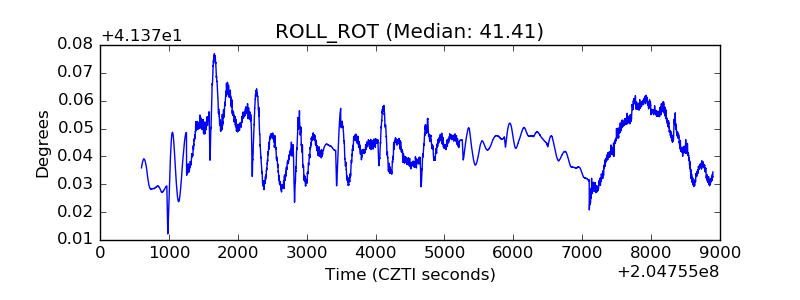 |
| _Roll_DEC | 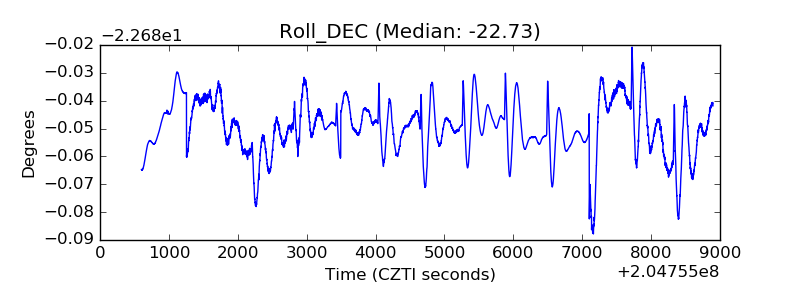 |
| _Roll_RA | 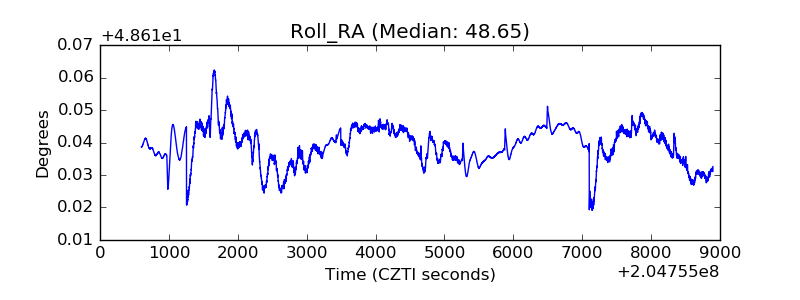 |
| Veto Counter | 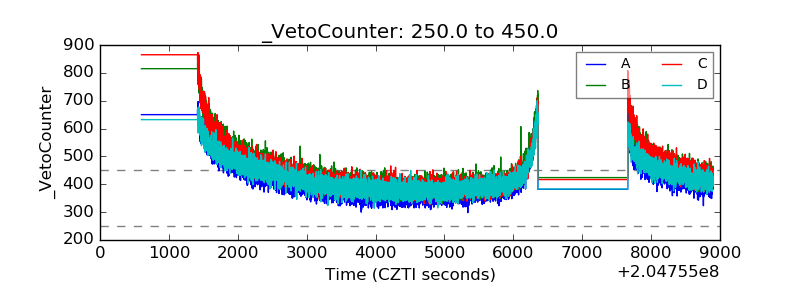 |