| Param | Original file | Final file |
|---|---|---|
| Filename | modeM0/AS1G05_241T04_9000000518_04056cztM0_level2.evt | modeM0/AS1G05_241T04_9000000518_04056cztM0_level2_quad_clean.evt |
| Size (bytes) | 471,991,680 | 83,946,240 |
| Size | 450.1 MB | 80.1 MB |
| Events in quadrant A | 3,333,174 | 515,702 |
| Events in quadrant B | 3,577,257 | 518,452 |
| Events in quadrant C | 3,237,849 | 513,285 |
| Events in quadrant D | 3,655,815 | 492,317 |
| Mode SS | |||
|---|---|---|---|
| Quadrant | BADHDUFLAG | Total packets | Discarded packets |
| A | 0 | 146 | 0 |
| B | 0 | 146 | 0 |
| C | 0 | 146 | 0 |
| D | 0 | 146 | 0 |
| Mode M0 | |||
|---|---|---|---|
| Quadrant | BADHDUFLAG | Total packets | Discarded packets |
| A | 0 | 14847 | 3 |
| B | 0 | 15518 | 2 |
| C | 0 | 14802 | 2 |
| D | 0 | 16232 | 2 |
| Mode M9 | |||
|---|---|---|---|
| Quadrant | BADHDUFLAG | Total packets | Discarded packets |
| A | 0 | 5 | 0 |
| B | 0 | 5 | 0 |
| C | 0 | 5 | 0 |
| D | 0 | 5 | 0 |
| Quadrant | Total seconds | Saturated seconds | Saturation percentage |
|---|---|---|---|
| A | 7213 | 37 | 0.512963% |
| B | 7213 | 94 | 1.303203% |
| C | 7213 | 42 | 0.582282% |
| D | 7213 | 79 | 1.095245% |
Noise dominated data is calculated using 1-second bins in cleaned event files. If a bin has >2000 counts, and if more than 50% of those come from <1% of pixels, then it is considered to be noise-dominated and hence unusable.
| Quadrant | # 1 sec bins | Bins with >0 counts | Bins with >2000 counts | High rate bins dominated by noise | Noise dominated (total time) | Noise dominated (detector-on time) | Marked lightcurve |
|---|---|---|---|---|---|---|---|
| A | 7678 | 7214 | 0 | 0 | 0.00% | 0.00% | 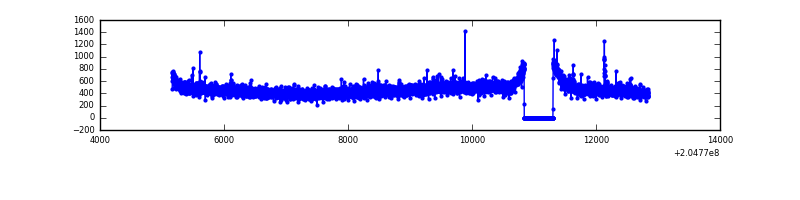 |
| B | 7678 | 7214 | 21 | 21 | 0.27% | 0.29% | 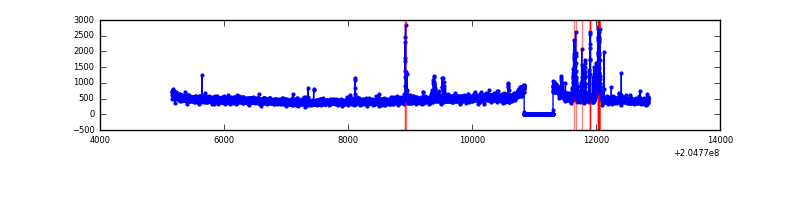 |
| C | 7678 | 7214 | 0 | 0 | 0.00% | 0.00% | 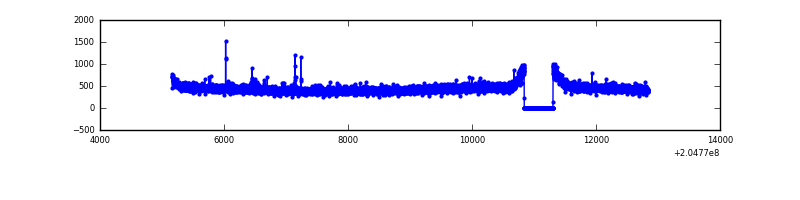 |
| D | 7678 | 7214 | 24 | 24 | 0.31% | 0.33% | 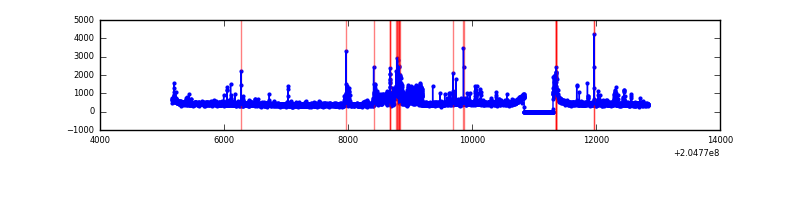 |
Top three noisy pixels from each quadrant. If the there are fewer than three noisy pixels in the level2.evt file, extra rows are filled as -1
| Pixel properties | Quadrant properties | ||||||
|---|---|---|---|---|---|---|---|
| Quadrant | DetID | PixID | Counts | Sigma | Mean | Median | Sigma |
| A | 8 | 15 | 91754 | 528.96 | 834 | 815 | 171.9 |
| A | 14 | 111 | 19674 | 109.7 | 834 | 815 | 171.9 |
| A | 0 | 226 | 8943 | 47.28 | 834 | 815 | 171.9 |
| B | 14 | 167 | 189518 | 1149.43 | 847 | 828 | 164.2 |
| B | 15 | 204 | 32175 | 190.95 | 847 | 828 | 164.2 |
| B | 5 | 184 | 22850 | 134.15 | 847 | 828 | 164.2 |
| C | 9 | 144 | 11387 | 54.81 | 820 | 820 | 192.8 |
| C | 8 | 128 | 7067 | 32.4 | 820 | 820 | 192.8 |
| C | 13 | 61 | 6696 | 30.48 | 820 | 820 | 192.8 |
| D | 10 | 246 | 346772 | 1733.32 | 814 | 790 | 199.6 |
| D | 13 | 239 | 154399 | 769.56 | 814 | 790 | 199.6 |
| D | 2 | 14 | 29777 | 145.22 | 814 | 790 | 199.6 |
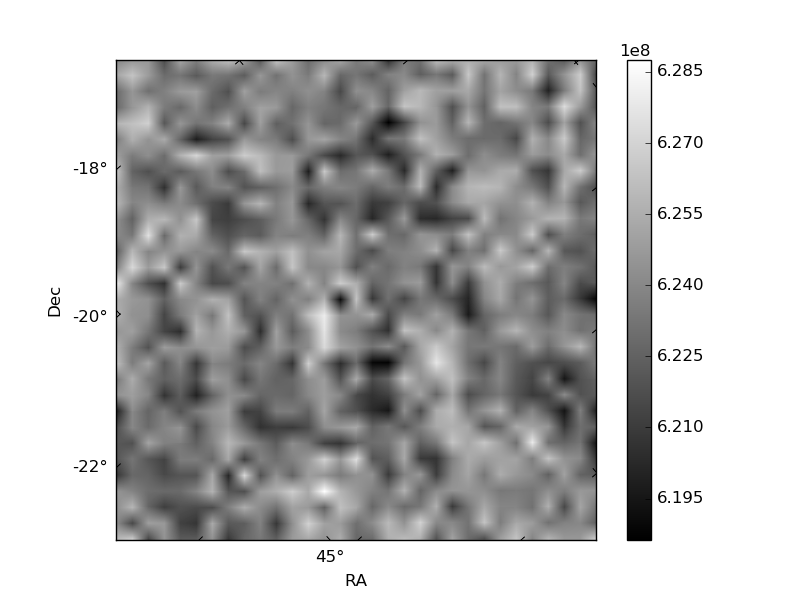
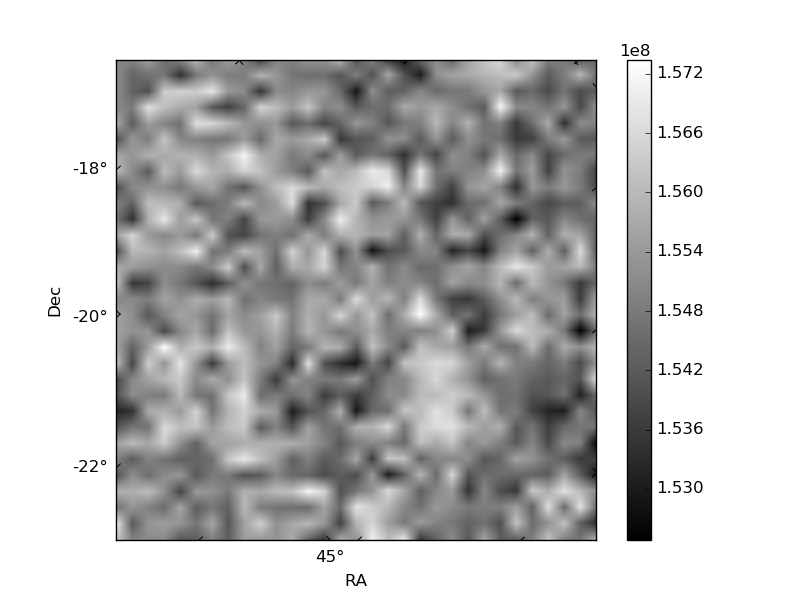
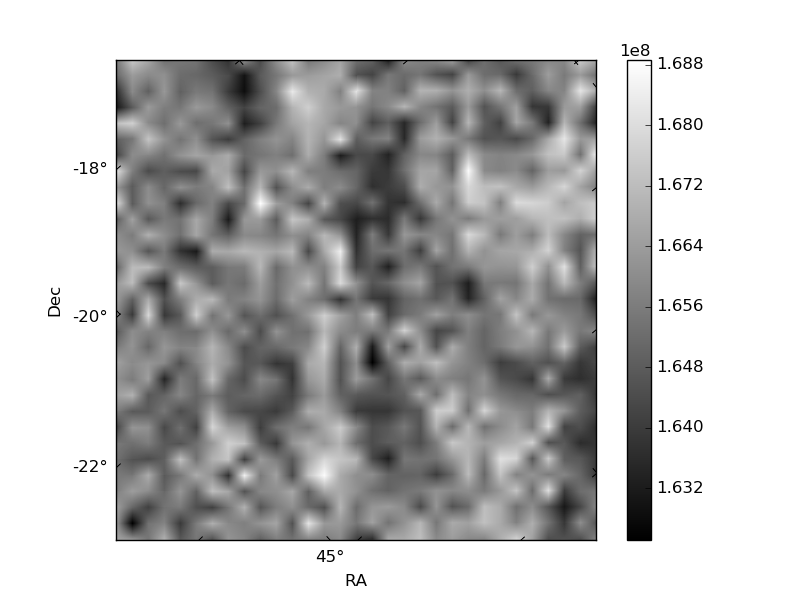
Histogram calculated using DETX and DETY for each event in the final _common_clean file
| Quadrant A | 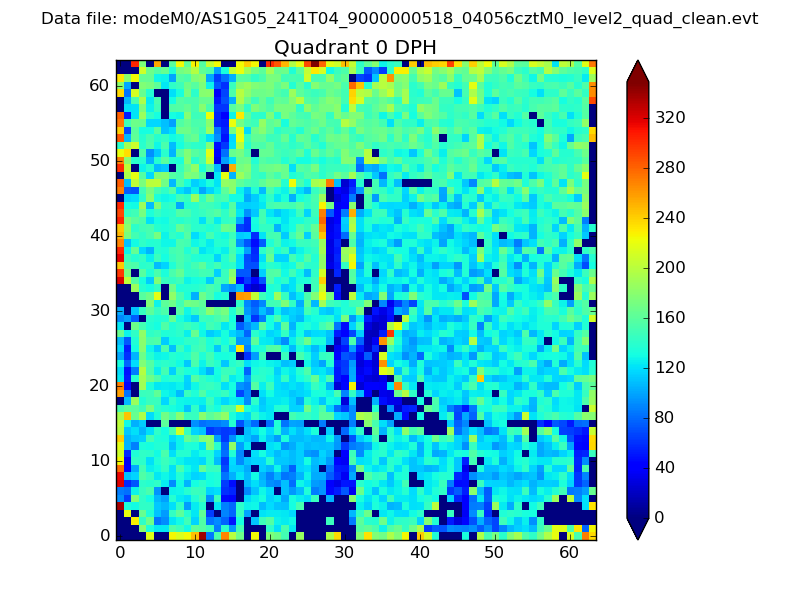 |
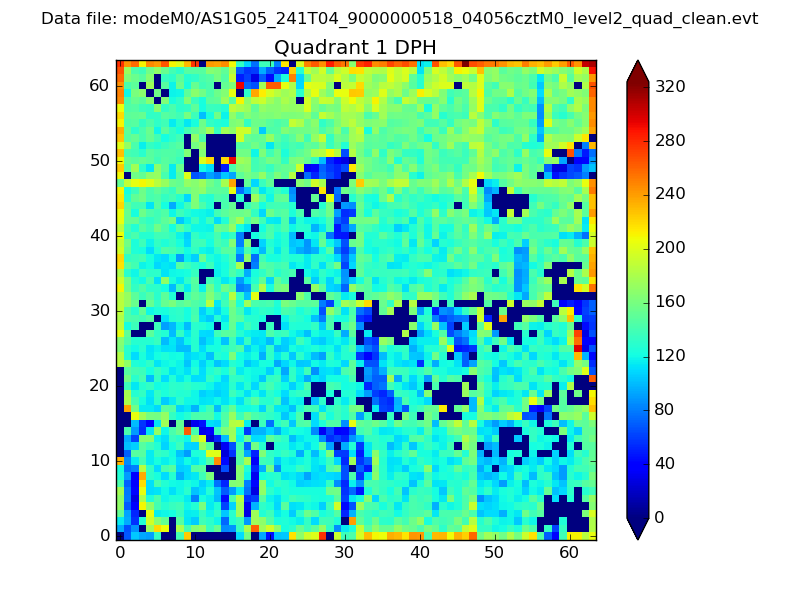 |
Quadrant B |
|---|---|---|---|
| Quadrant D | 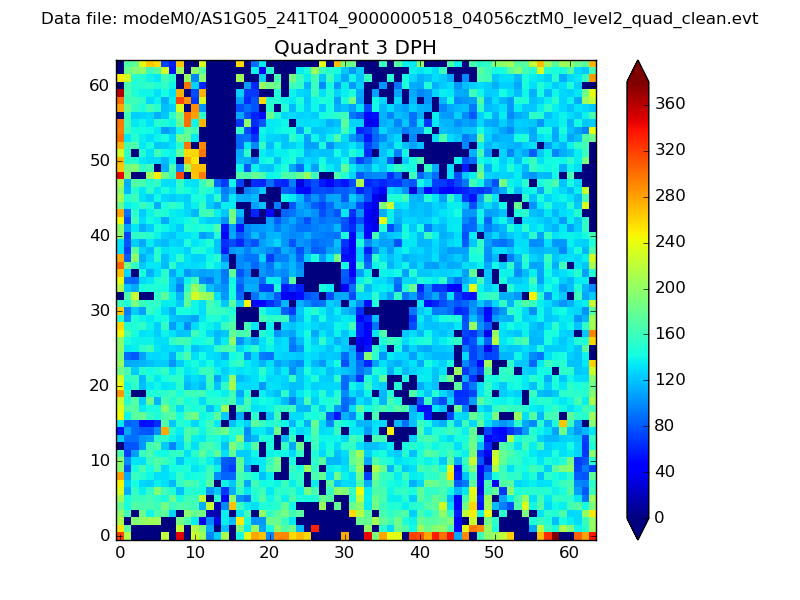 |
 |
Quadrant C |
| Plot type | Count rate plots | Images |
|---|---|---|
| Comparison with Poisson distribution Blue bars denote a histogram of data divided into 1 sec bins. Red curve is a Poisson curve with rate = median count rate of data. |
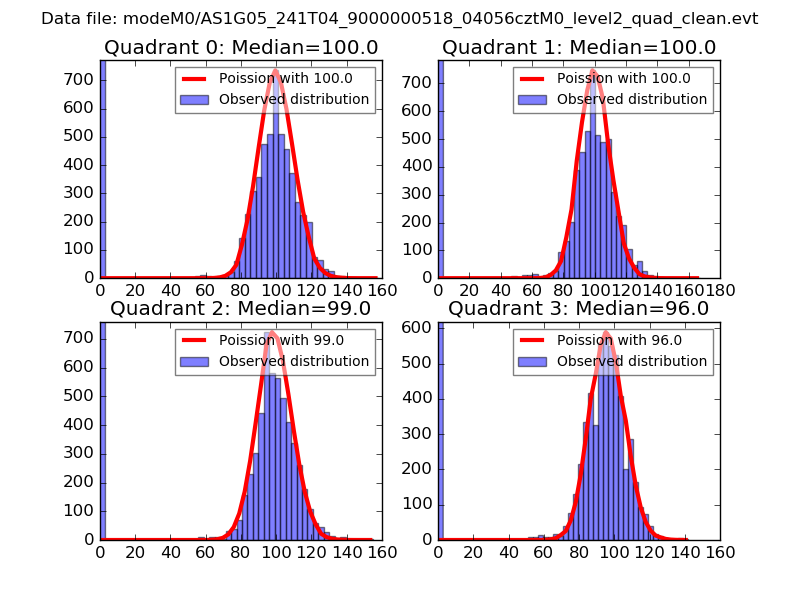 |
 |
| Quadrant-wise count rates Data is divided into 100 sec bins |
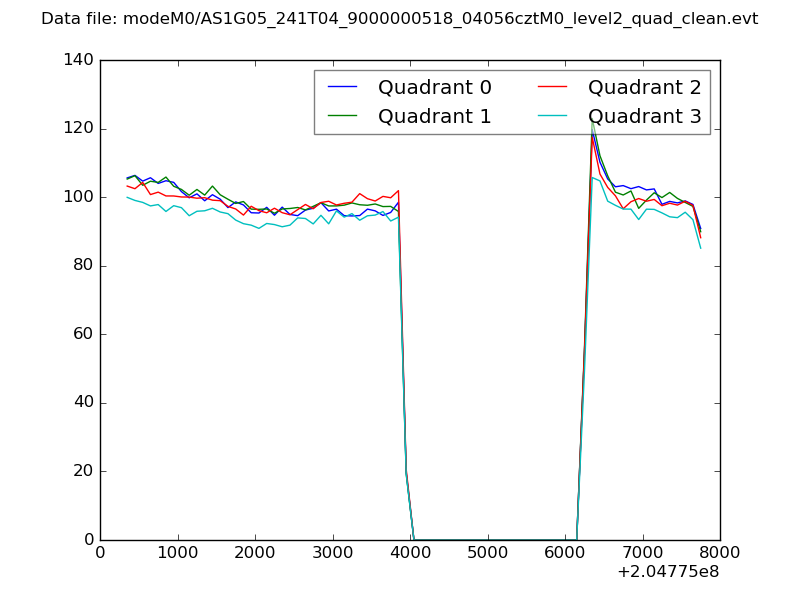 |
|
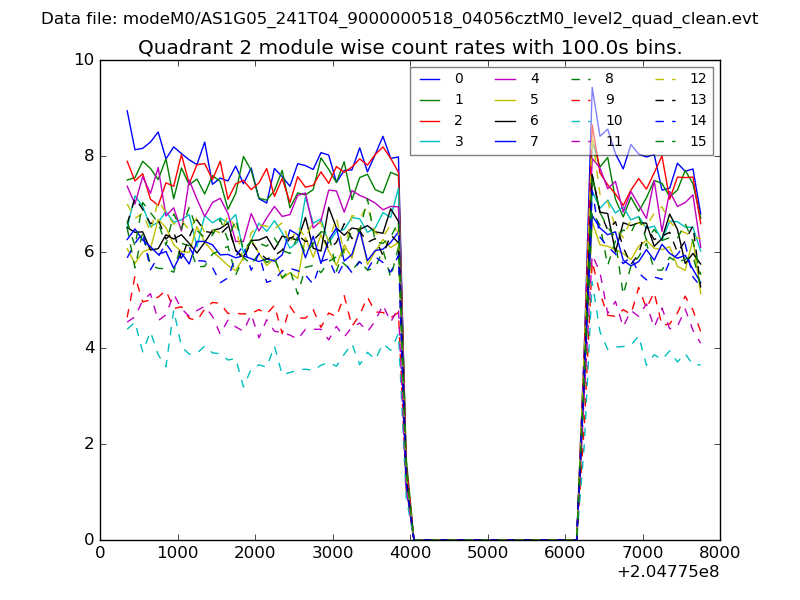
| Module-wise count rates for Quadrant A Data is divided into 100 sec bins |
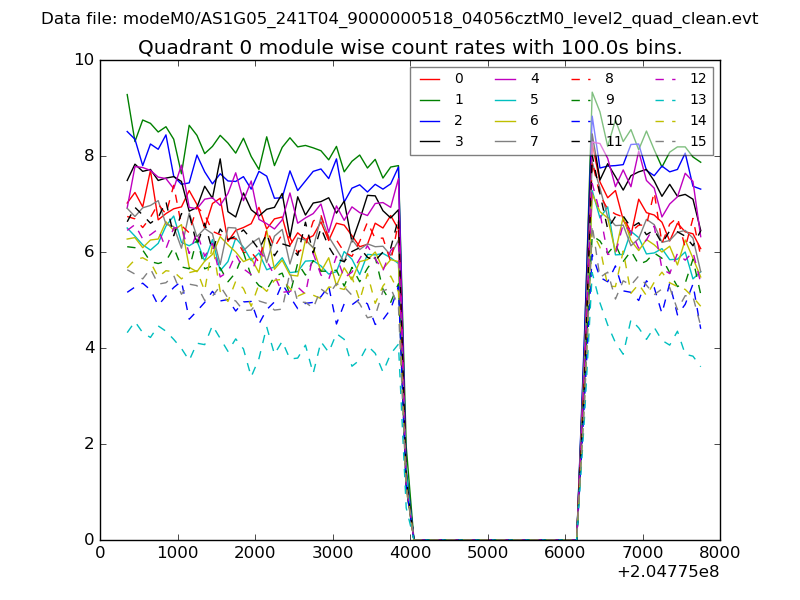 |
 |
| Module-wise count rates for Quadrant B Data is divided into 100 sec bins |
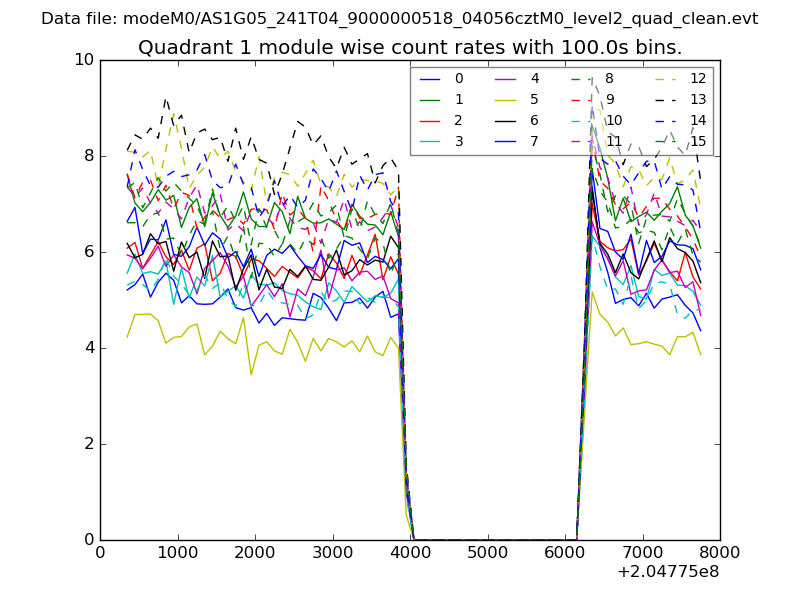 |
 |
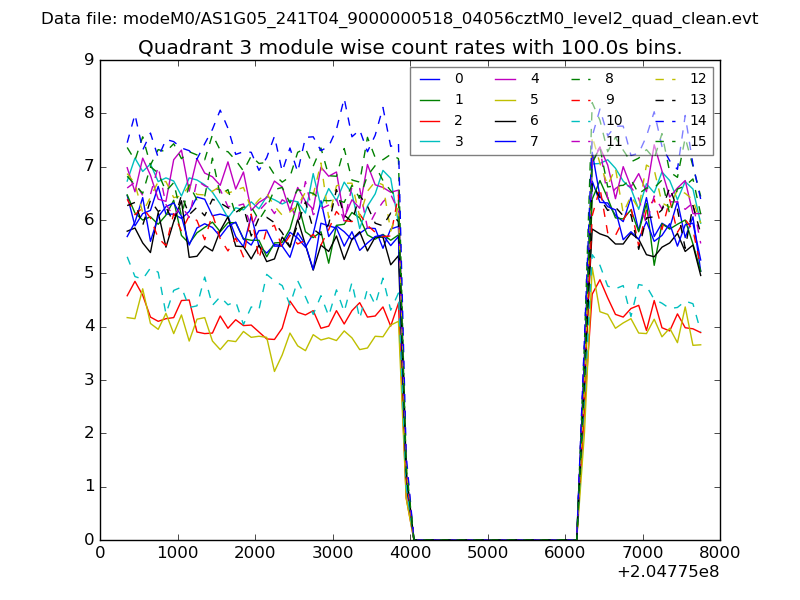
| Module-wise count rates for Quadrant C Data is divided into 100 sec bins |
 |
 |
| Module-wise count rates for Quadrant D Data is divided into 100 sec bins |
 |
 |
| Parameter | Plot |
|---|---|
| CZT HV Monitor | 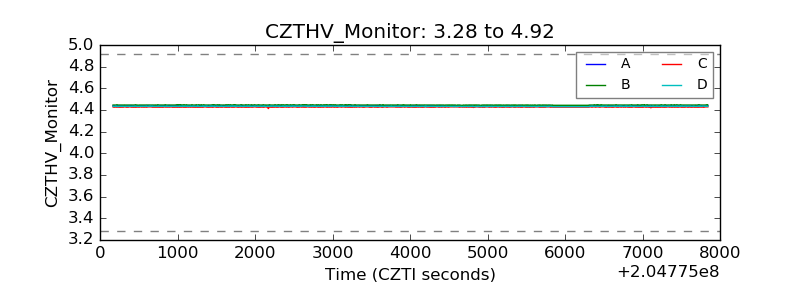 |
| D_VDD | 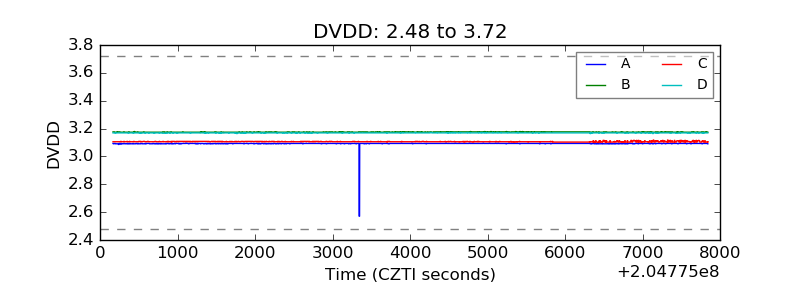 |
| Temperature 1 | 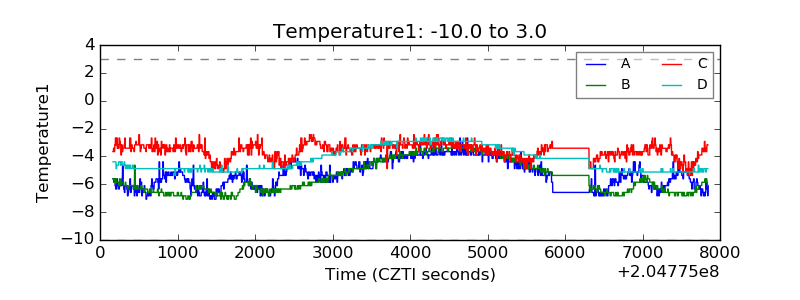 |
| Veto HV Monitor | 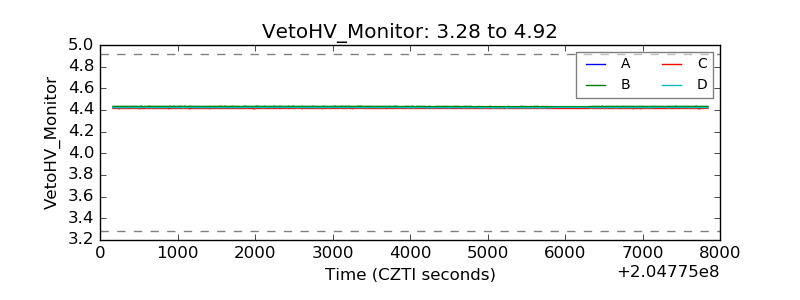 |
| Veto LLD | 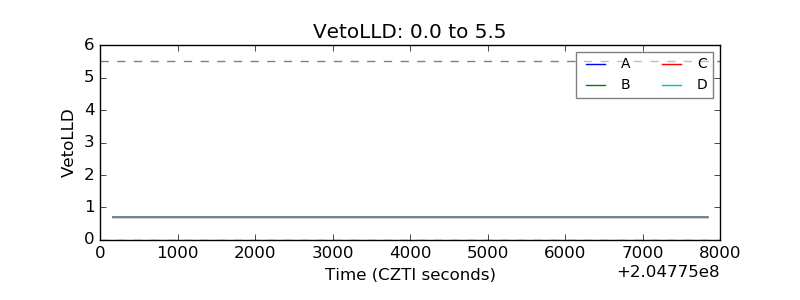 |
| Alpha Counter | 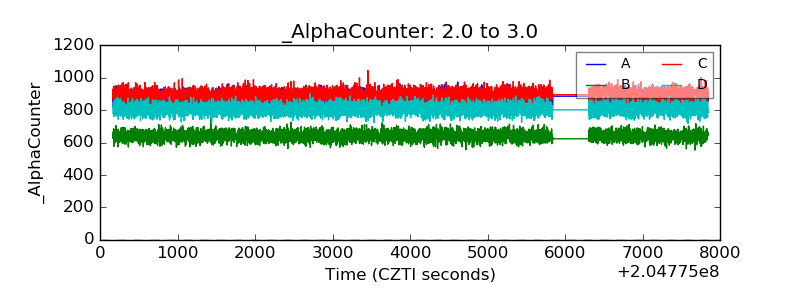 |
| _CPM_Rate | 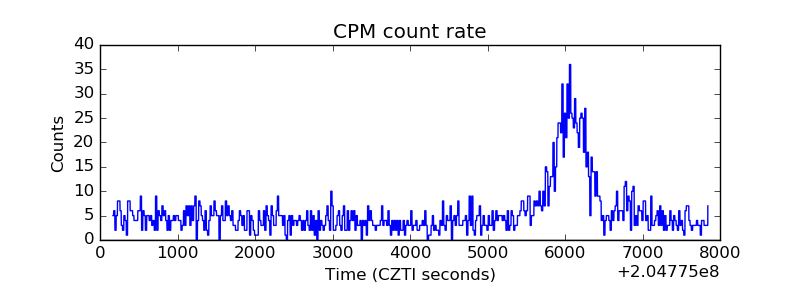 |
| CZT Counter | 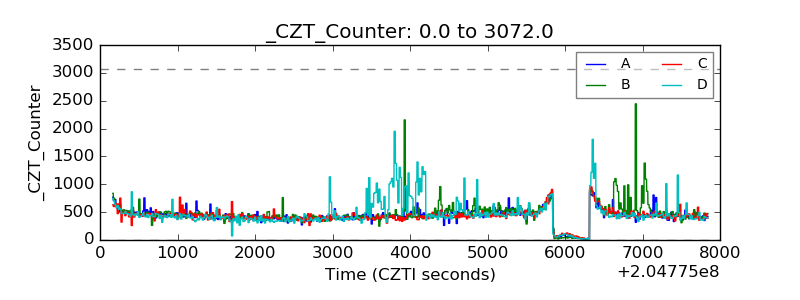 |
| +2.5 Volts monitor |  |
| +5 Volts monitor |  |
| _ROLL_ROT | 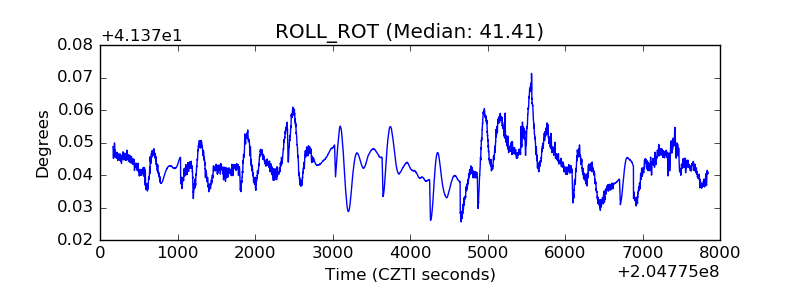 |
| _Roll_DEC | 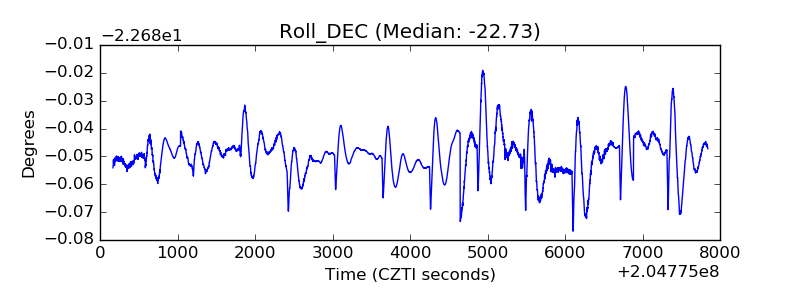 |
| _Roll_RA | 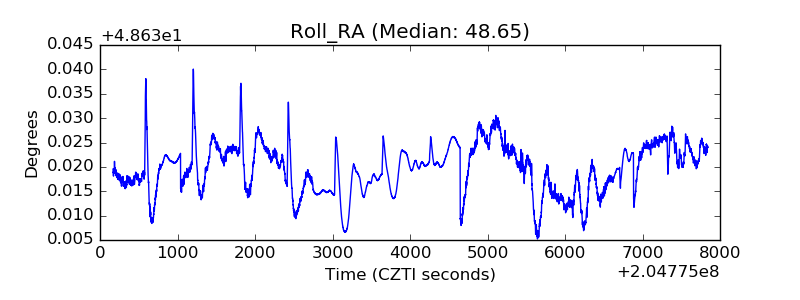 |
| Veto Counter | 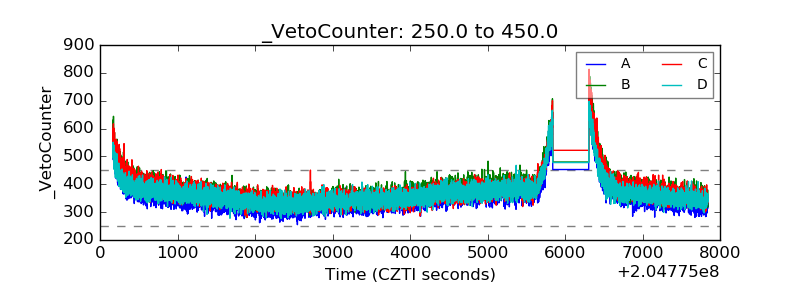 |