| Param | Original file | Final file |
|---|---|---|
| Filename | modeM0/AS1G05_241T04_9000000518_04057cztM0_level2.evt | modeM0/AS1G05_241T04_9000000518_04057cztM0_level2_quad_clean.evt |
| Size (bytes) | 482,886,720 | 85,703,040 |
| Size | 460.5 MB | 81.7 MB |
| Events in quadrant A | 3,528,596 | 520,991 |
| Events in quadrant B | 3,690,563 | 526,320 |
| Events in quadrant C | 3,397,364 | 522,035 |
| Events in quadrant D | 3,498,166 | 504,432 |
| Mode SS | |||
|---|---|---|---|
| Quadrant | BADHDUFLAG | Total packets | Discarded packets |
| A | 0 | 152 | 0 |
| B | 0 | 152 | 0 |
| C | 0 | 152 | 0 |
| D | 0 | 152 | 0 |
| Mode M0 | |||
|---|---|---|---|
| Quadrant | BADHDUFLAG | Total packets | Discarded packets |
| A | 0 | 15684 | 2 |
| B | 0 | 16065 | 1 |
| C | 0 | 15486 | 1 |
| D | 0 | 16063 | 1 |
| Mode M9 | |||
|---|---|---|---|
| Quadrant | BADHDUFLAG | Total packets | Discarded packets |
| A | 0 | 2 | 0 |
| B | 0 | 2 | 0 |
| C | 0 | 2 | 0 |
| D | 0 | 2 | 0 |
| Quadrant | Total seconds | Saturated seconds | Saturation percentage |
|---|---|---|---|
| A | 7495 | 126 | 1.681121% |
| B | 7495 | 130 | 1.734490% |
| C | 7495 | 54 | 0.720480% |
| D | 7495 | 72 | 0.960640% |
Noise dominated data is calculated using 1-second bins in cleaned event files. If a bin has >2000 counts, and if more than 50% of those come from <1% of pixels, then it is considered to be noise-dominated and hence unusable.
| Quadrant | # 1 sec bins | Bins with >0 counts | Bins with >2000 counts | High rate bins dominated by noise | Noise dominated (total time) | Noise dominated (detector-on time) | Marked lightcurve |
|---|---|---|---|---|---|---|---|
| A | 7660 | 7496 | 0 | 0 | 0.00% | 0.00% |  |
| B | 7660 | 7495 | 19 | 19 | 0.25% | 0.25% |  |
| C | 7660 | 7496 | 3 | 3 | 0.04% | 0.04% |  |
| D | 7660 | 7496 | 19 | 19 | 0.25% | 0.25% |  |
Top three noisy pixels from each quadrant. If the there are fewer than three noisy pixels in the level2.evt file, extra rows are filled as -1
| Pixel properties | Quadrant properties | ||||||
|---|---|---|---|---|---|---|---|
| Quadrant | DetID | PixID | Counts | Sigma | Mean | Median | Sigma |
| A | 14 | 111 | 121368 | 678.34 | 863 | 843 | 177.7 |
| A | 8 | 15 | 66010 | 366.77 | 863 | 843 | 177.7 |
| A | 0 | 226 | 9256 | 47.35 | 863 | 843 | 177.7 |
| B | 14 | 167 | 204766 | 1181.07 | 879 | 856 | 172.6 |
| B | 15 | 204 | 46019 | 261.59 | 879 | 856 | 172.6 |
| B | 0 | 229 | 17018 | 93.61 | 879 | 856 | 172.6 |
| C | 8 | 128 | 21492 | 102.44 | 852 | 858 | 201.4 |
| C | 12 | 4 | 18604 | 88.1 | 852 | 858 | 201.4 |
| C | 8 | 144 | 8470 | 37.79 | 852 | 858 | 201.4 |
| D | 13 | 239 | 147862 | 704.5 | 846 | 819 | 208.7 |
| D | 2 | 14 | 66214 | 313.31 | 846 | 819 | 208.7 |
| D | 2 | 37 | 36600 | 171.43 | 846 | 819 | 208.7 |
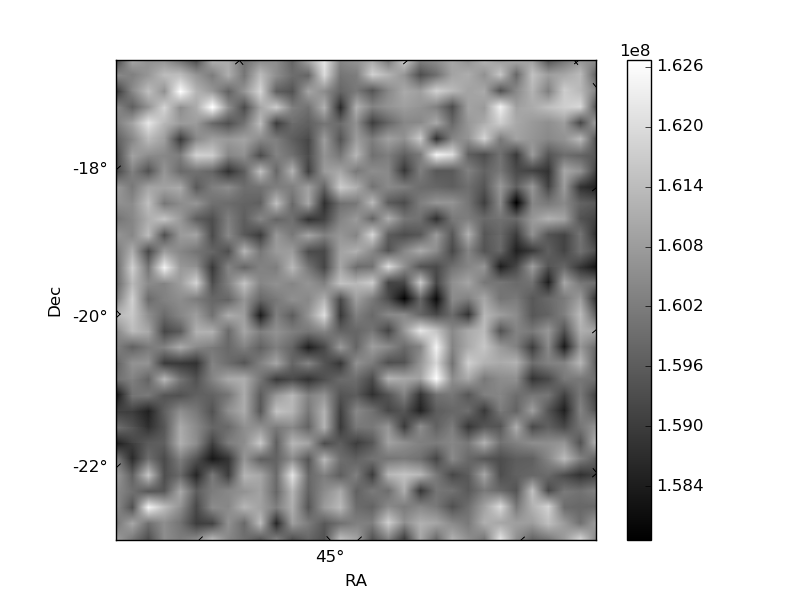
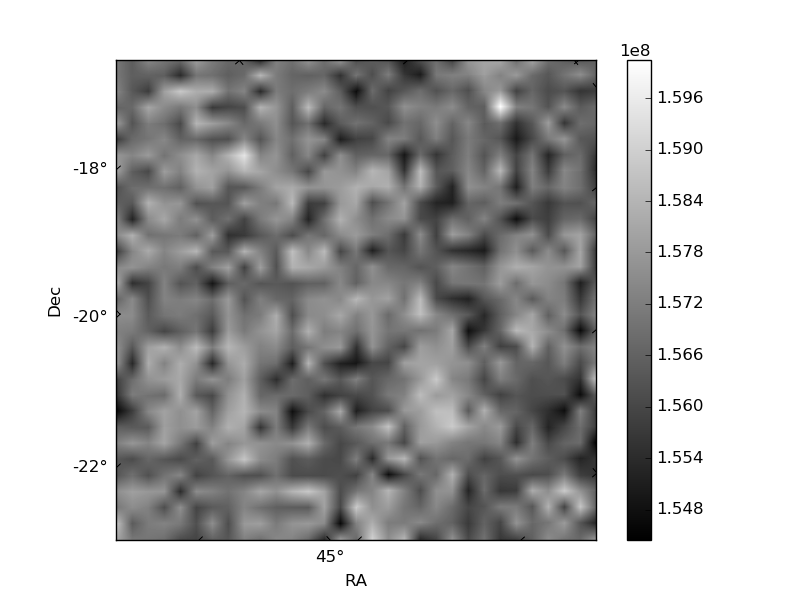
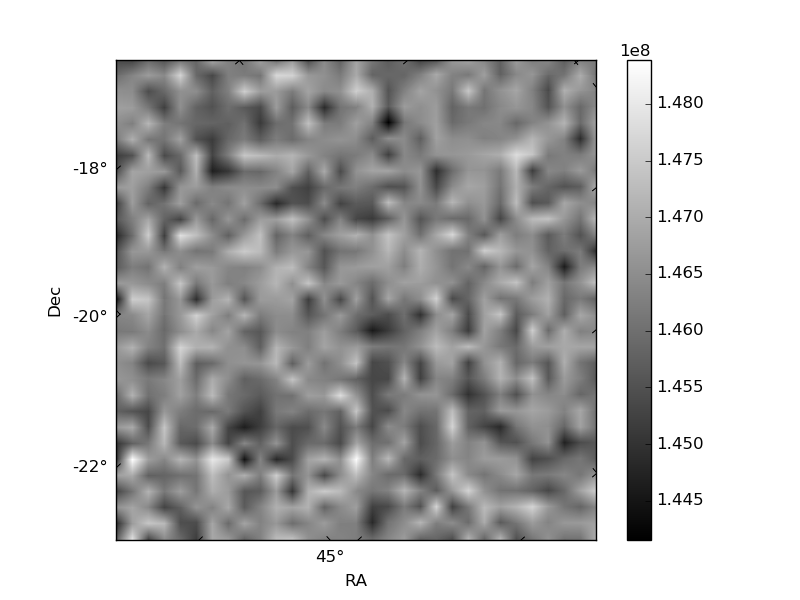
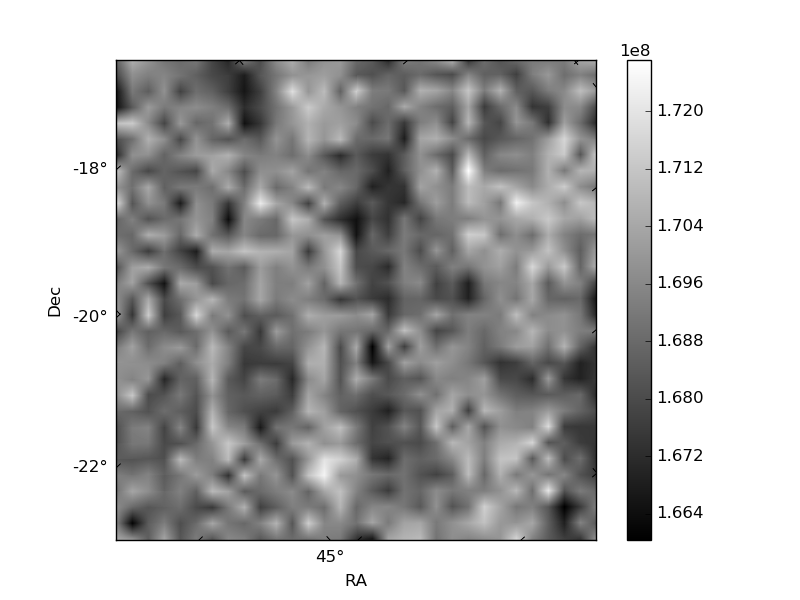
Histogram calculated using DETX and DETY for each event in the final _common_clean file
| Quadrant A | 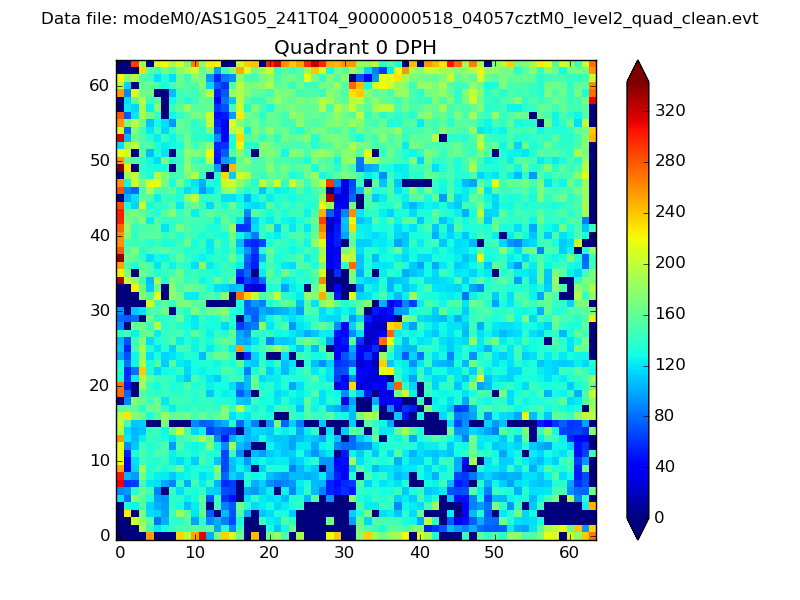 |
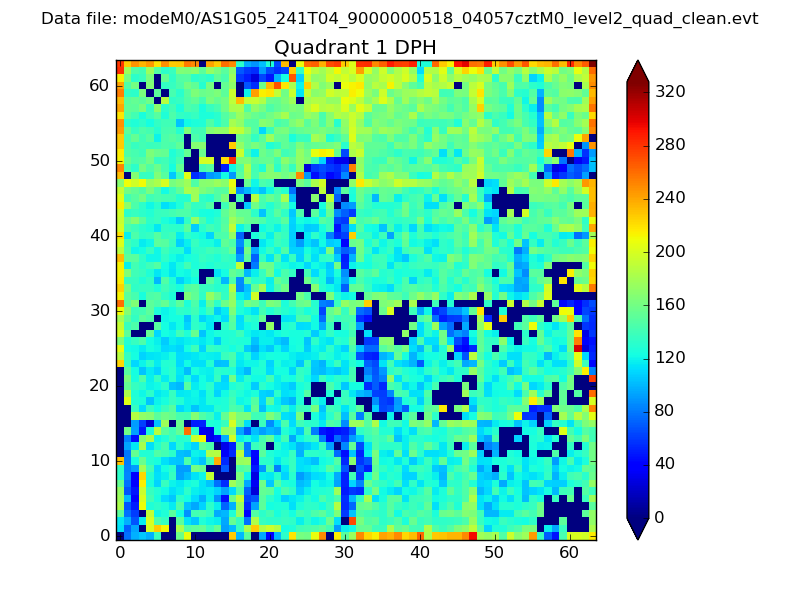 |
Quadrant B |
|---|---|---|---|
| Quadrant D | 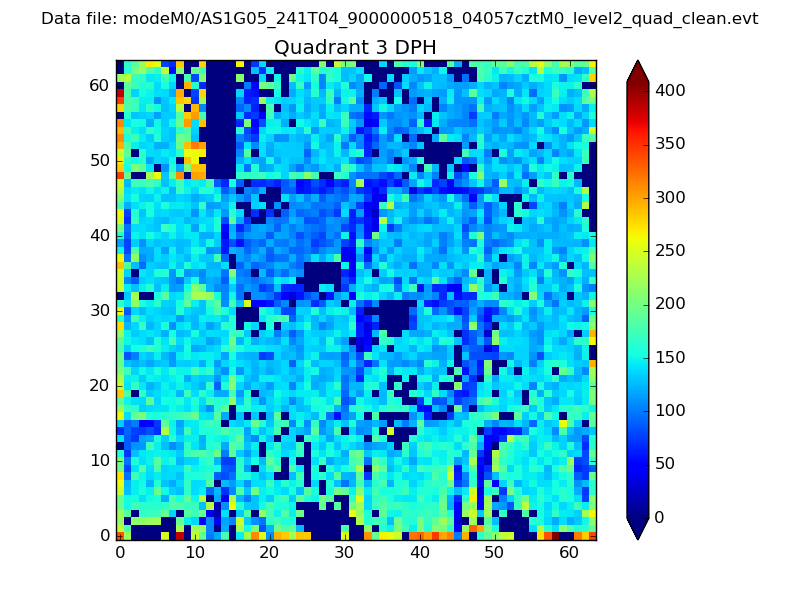 |
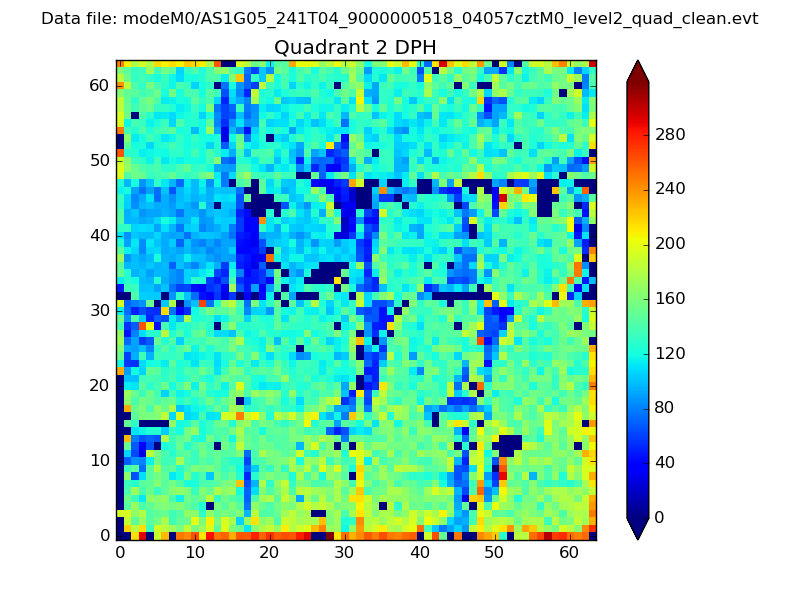 |
Quadrant C |
| Plot type | Count rate plots | Images |
|---|---|---|
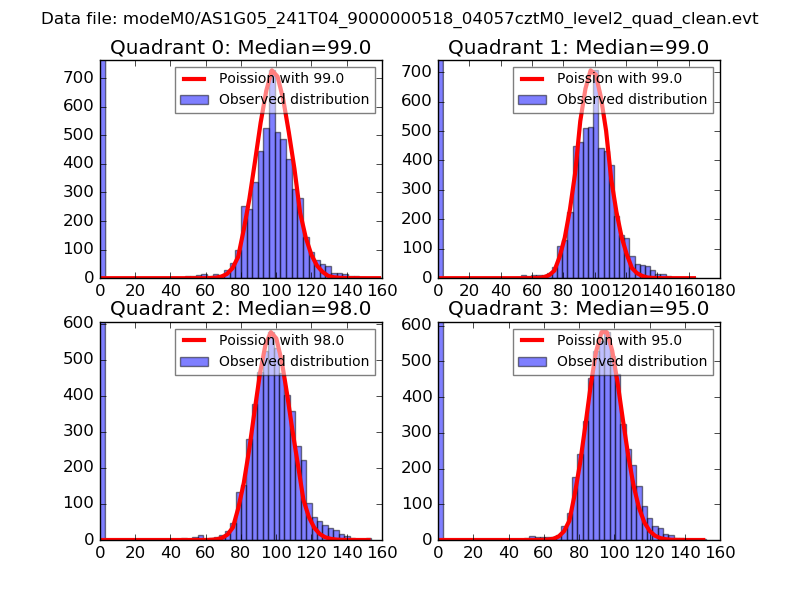
| Comparison with Poisson distribution Blue bars denote a histogram of data divided into 1 sec bins. Red curve is a Poisson curve with rate = median count rate of data. |
 |
 |
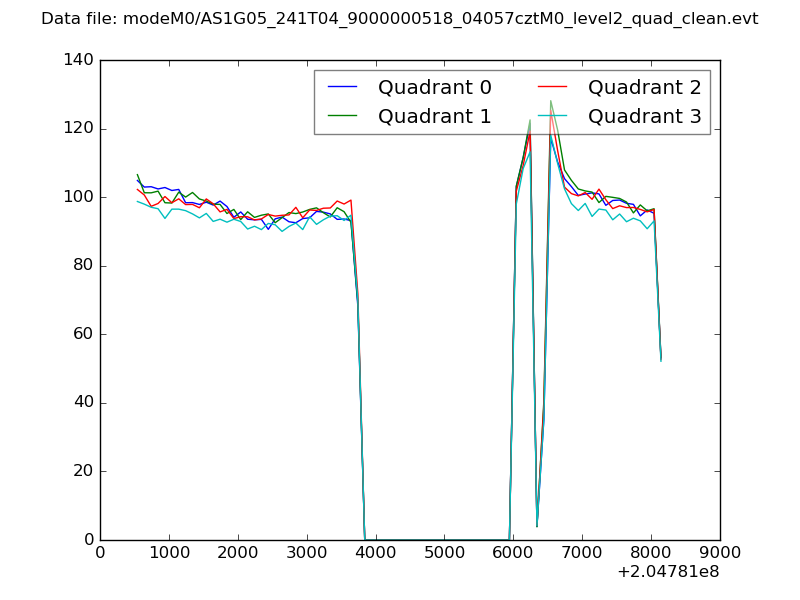
| Quadrant-wise count rates Data is divided into 100 sec bins |
 |
|
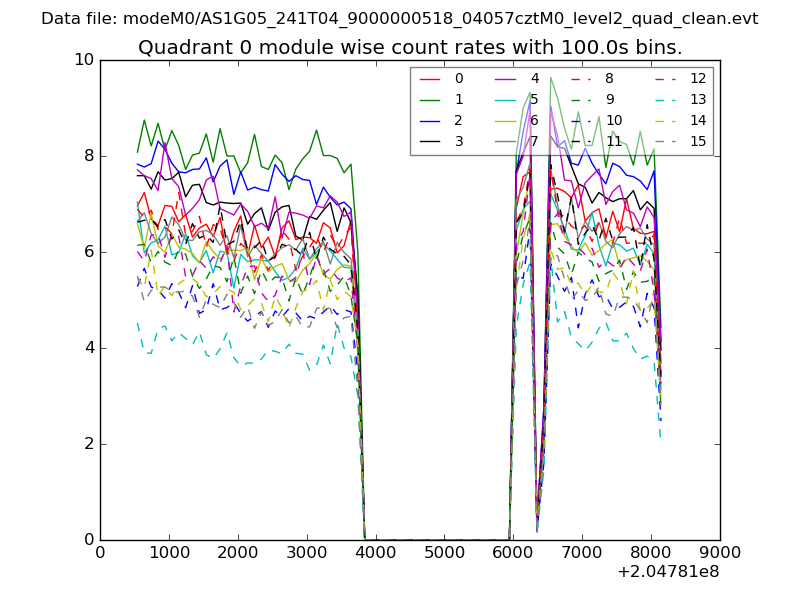
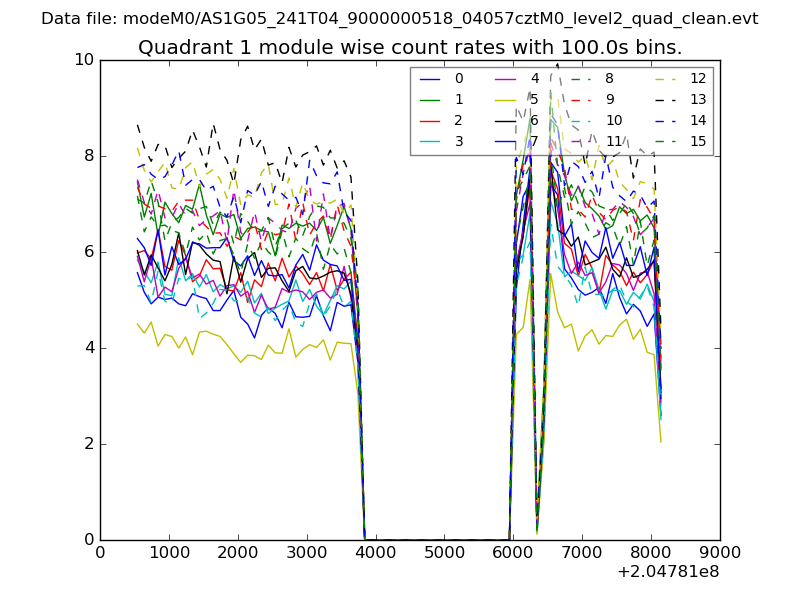
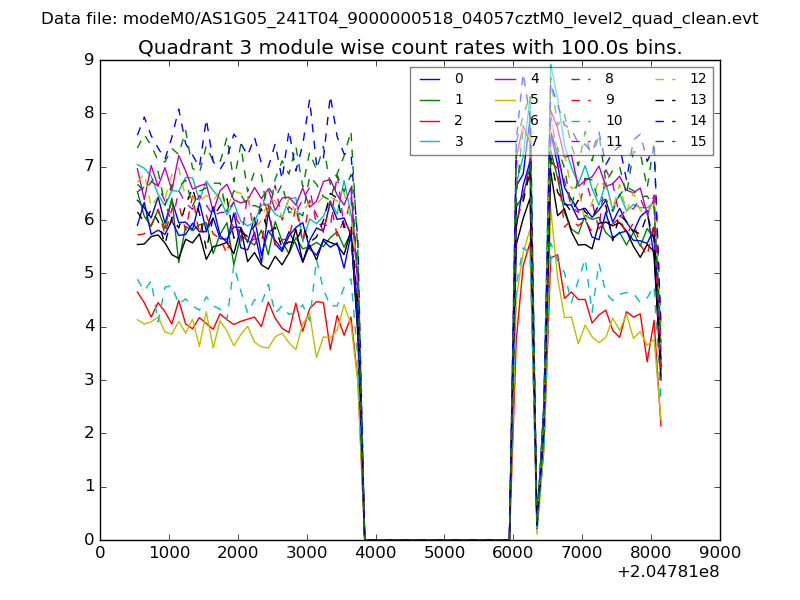
| Module-wise count rates for Quadrant A Data is divided into 100 sec bins |
 |
 |
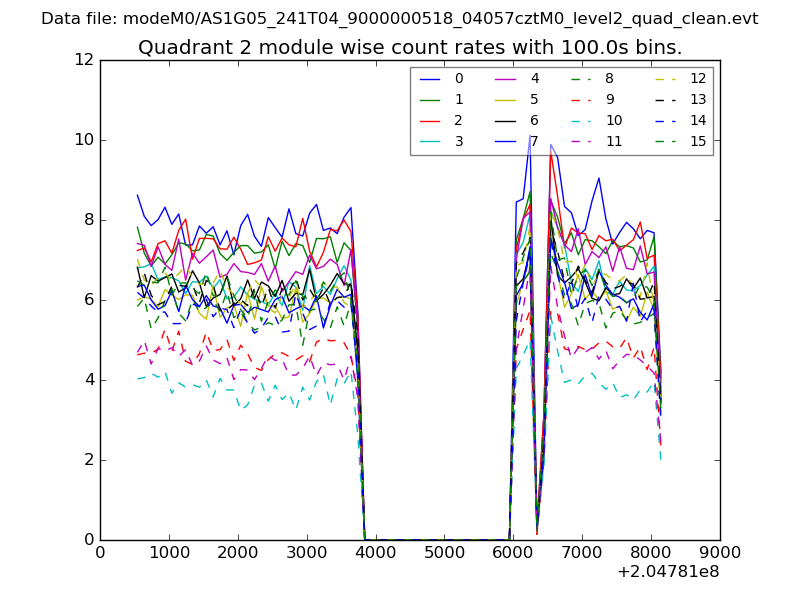
| Module-wise count rates for Quadrant B Data is divided into 100 sec bins |
 |
 |
| Module-wise count rates for Quadrant C Data is divided into 100 sec bins |
 |
 |
| Module-wise count rates for Quadrant D Data is divided into 100 sec bins |
 |
 |
| Parameter | Plot |
|---|---|
| CZT HV Monitor | 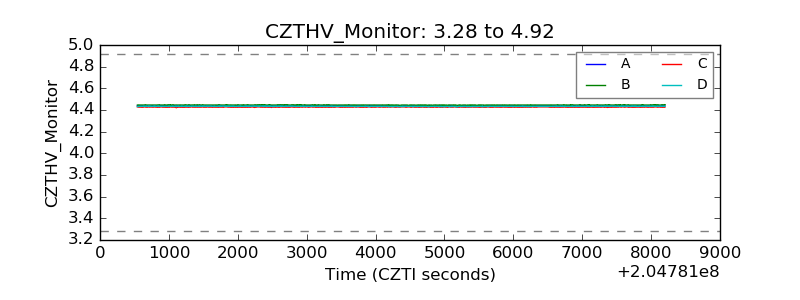 |
| D_VDD | 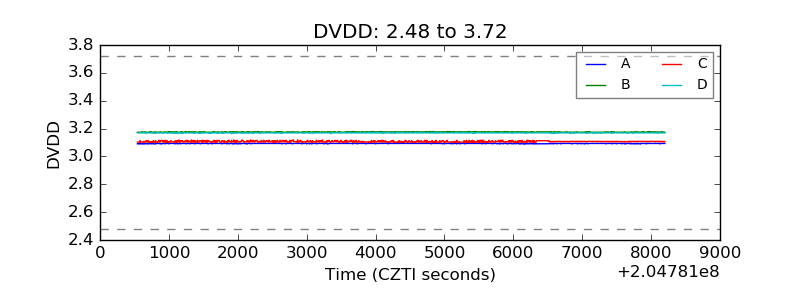 |
| Temperature 1 | 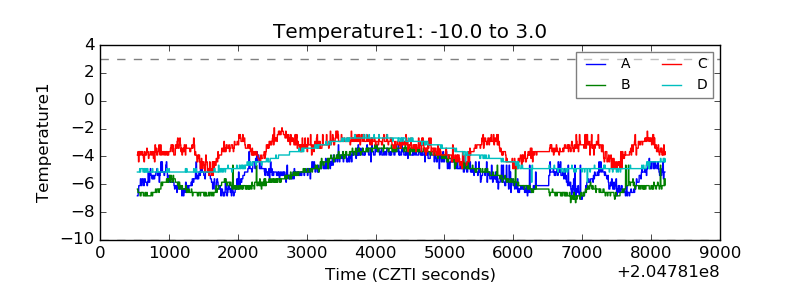 |
| Veto HV Monitor | 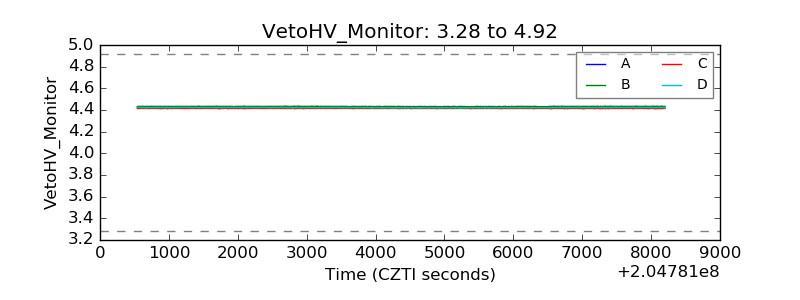 |
| Veto LLD | 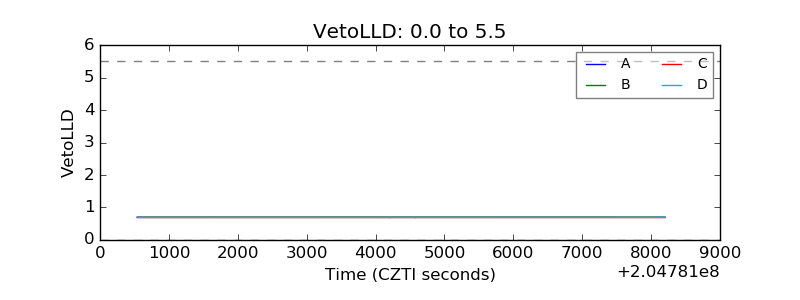 |
| Alpha Counter | 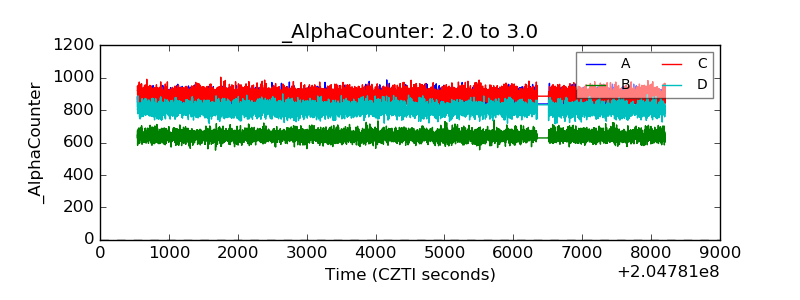 |
| _CPM_Rate | 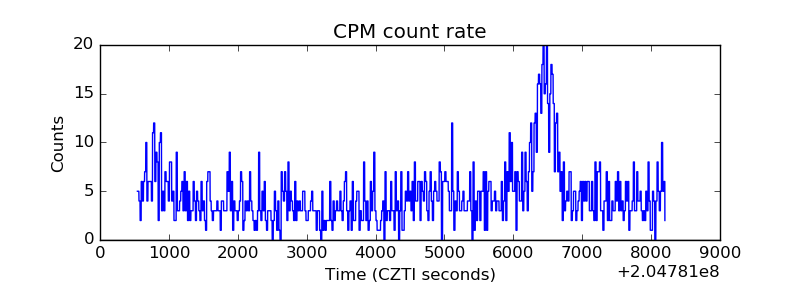 |
| CZT Counter | 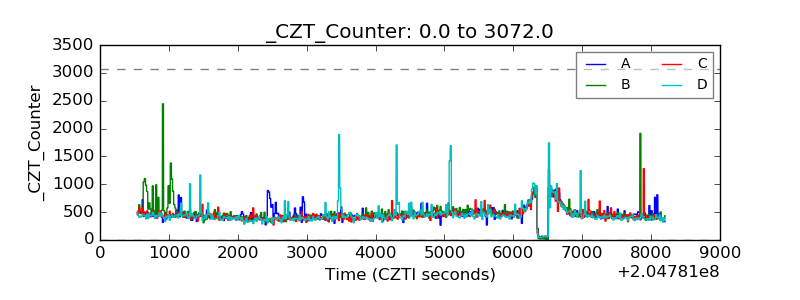 |
| +2.5 Volts monitor |  |
| +5 Volts monitor |  |
| _ROLL_ROT | 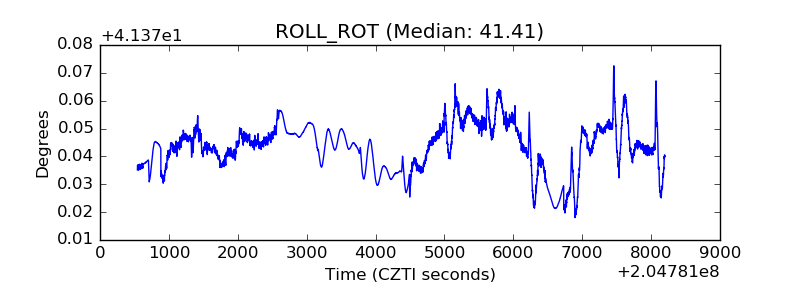 |
| _Roll_DEC | 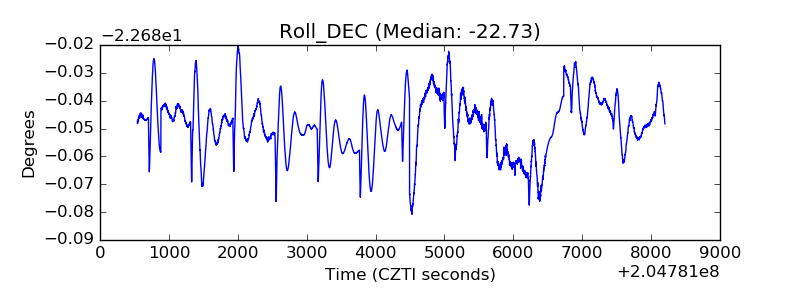 |
| _Roll_RA | 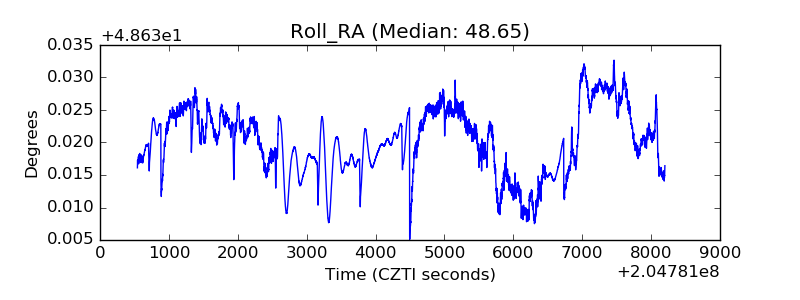 |
| Veto Counter | 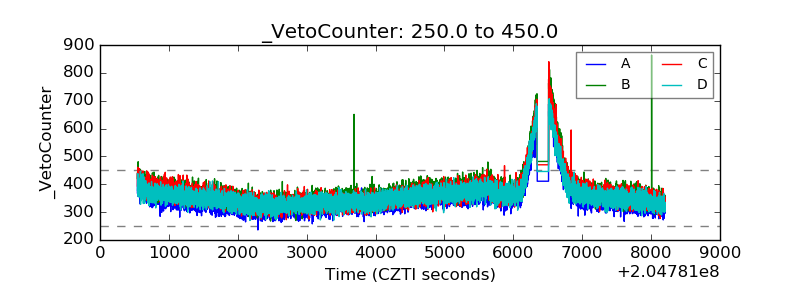 |