| Param | Original file | Final file |
|---|---|---|
| Filename | modeM0/AS1G05_241T04_9000000518_04062cztM0_level2.evt | modeM0/AS1G05_241T04_9000000518_04062cztM0_level2_quad_clean.evt |
| Size (bytes) | 451,946,880 | 67,691,520 |
| Size | 431.0 MB | 64.6 MB |
| Events in quadrant A | 3,756,993 | 398,885 |
| Events in quadrant B | 3,302,501 | 400,095 |
| Events in quadrant C | 2,971,616 | 398,249 |
| Events in quadrant D | 3,200,299 | 384,896 |
| Mode SS | |||
|---|---|---|---|
| Quadrant | BADHDUFLAG | Total packets | Discarded packets |
| A | 0 | 136 | 0 |
| B | 0 | 136 | 0 |
| C | 0 | 136 | 0 |
| D | 0 | 136 | 0 |
| Mode M0 | |||
|---|---|---|---|
| Quadrant | BADHDUFLAG | Total packets | Discarded packets |
| A | 0 | 15640 | 2 |
| B | 0 | 14066 | 1 |
| C | 0 | 13632 | 1 |
| D | 0 | 14442 | 1 |
| Mode M9 | |||
|---|---|---|---|
| Quadrant | BADHDUFLAG | Total packets | Discarded packets |
| A | 0 | 10 | 0 |
| B | 0 | 10 | 0 |
| C | 0 | 10 | 0 |
| D | 0 | 10 | 0 |
| Quadrant | Total seconds | Saturated seconds | Saturation percentage |
|---|---|---|---|
| A | 6704 | 248 | 3.699284% |
| B | 6704 | 77 | 1.148568% |
| C | 6704 | 46 | 0.686158% |
| D | 6704 | 97 | 1.446897% |
Noise dominated data is calculated using 1-second bins in cleaned event files. If a bin has >2000 counts, and if more than 50% of those come from <1% of pixels, then it is considered to be noise-dominated and hence unusable.
| Quadrant | # 1 sec bins | Bins with >0 counts | Bins with >2000 counts | High rate bins dominated by noise | Noise dominated (total time) | Noise dominated (detector-on time) | Marked lightcurve |
|---|---|---|---|---|---|---|---|
| A | 7639 | 6704 | 152 | 152 | 1.99% | 2.27% | 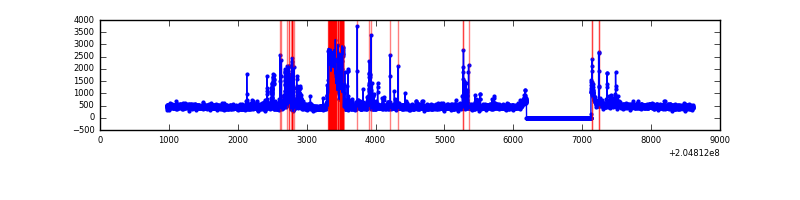 |
| B | 7639 | 6704 | 6 | 6 | 0.08% | 0.09% | 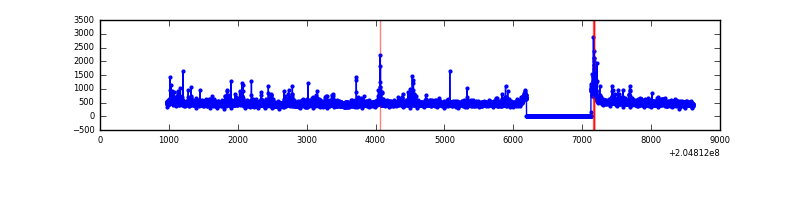 |
| C | 7639 | 6704 | 3 | 3 | 0.04% | 0.04% |  |
| D | 7639 | 6704 | 46 | 46 | 0.60% | 0.69% | 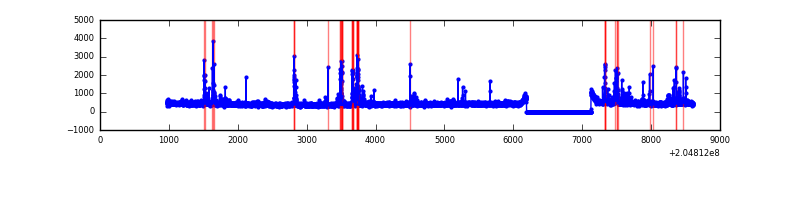 |
Top three noisy pixels from each quadrant. If the there are fewer than three noisy pixels in the level2.evt file, extra rows are filled as -1
| Pixel properties | Quadrant properties | ||||||
|---|---|---|---|---|---|---|---|
| Quadrant | DetID | PixID | Counts | Sigma | Mean | Median | Sigma |
| A | 0 | 50 | 533970 | 3376.39 | 769 | 752 | 157.9 |
| A | 0 | 199 | 180480 | 1138.05 | 769 | 752 | 157.9 |
| A | 0 | 226 | 28967 | 178.66 | 769 | 752 | 157.9 |
| B | 4 | 81 | 114591 | 744.97 | 783 | 765 | 152.8 |
| B | 15 | 204 | 69149 | 447.56 | 783 | 765 | 152.8 |
| B | 14 | 167 | 29958 | 191.06 | 783 | 765 | 152.8 |
| C | 9 | 144 | 26943 | 148.49 | 752 | 755 | 176.4 |
| C | 13 | 61 | 6225 | 31.02 | 752 | 755 | 176.4 |
| C | 10 | 65 | 3356 | 14.75 | 752 | 755 | 176.4 |
| D | 2 | 232 | 177589 | 968.7 | 751 | 729 | 182.6 |
| D | 13 | 239 | 111719 | 607.91 | 751 | 729 | 182.6 |
| D | 13 | 53 | 38760 | 208.3 | 751 | 729 | 182.6 |
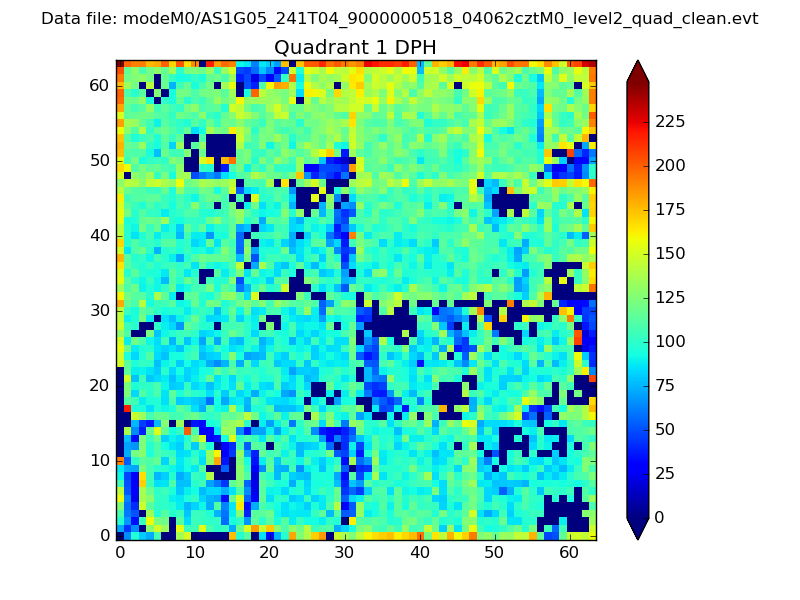
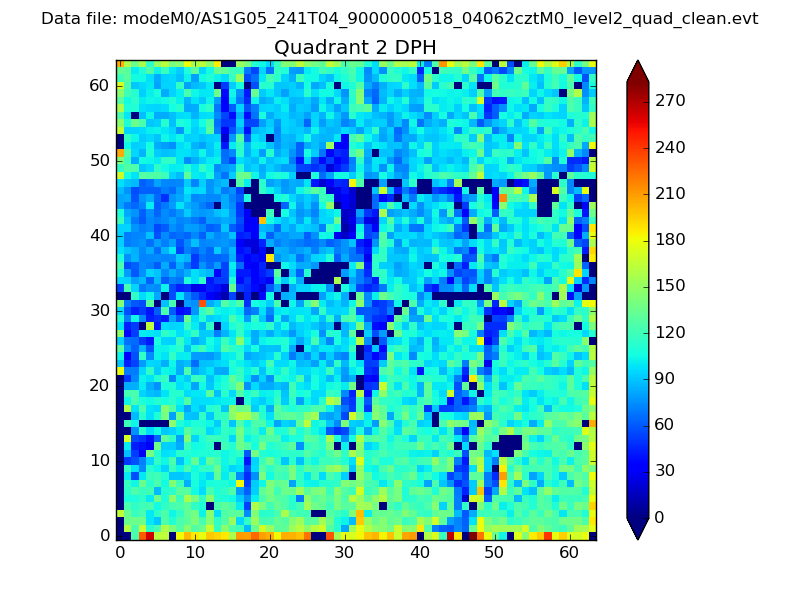
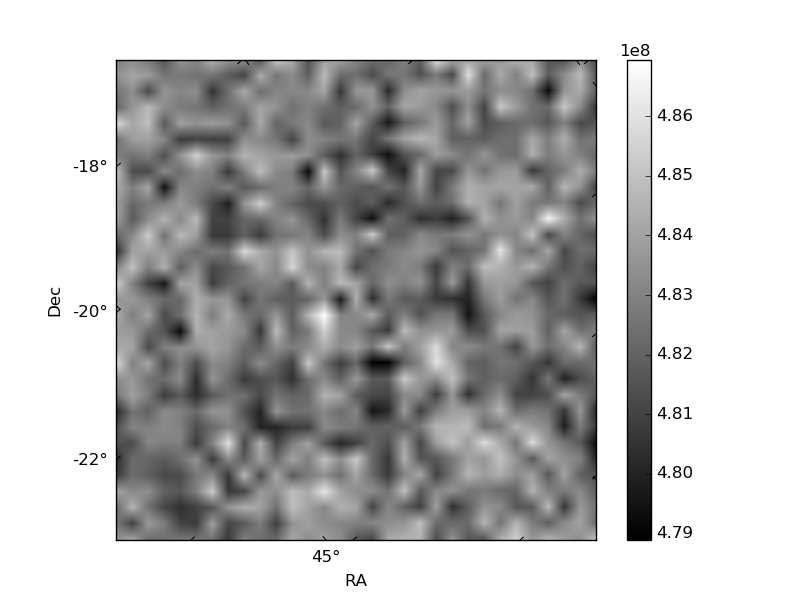
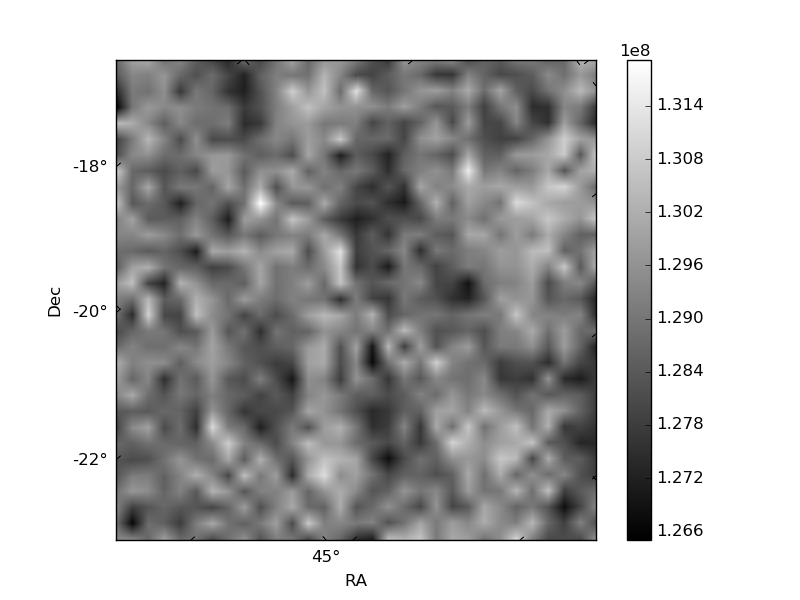
Histogram calculated using DETX and DETY for each event in the final _common_clean file
| Quadrant A | 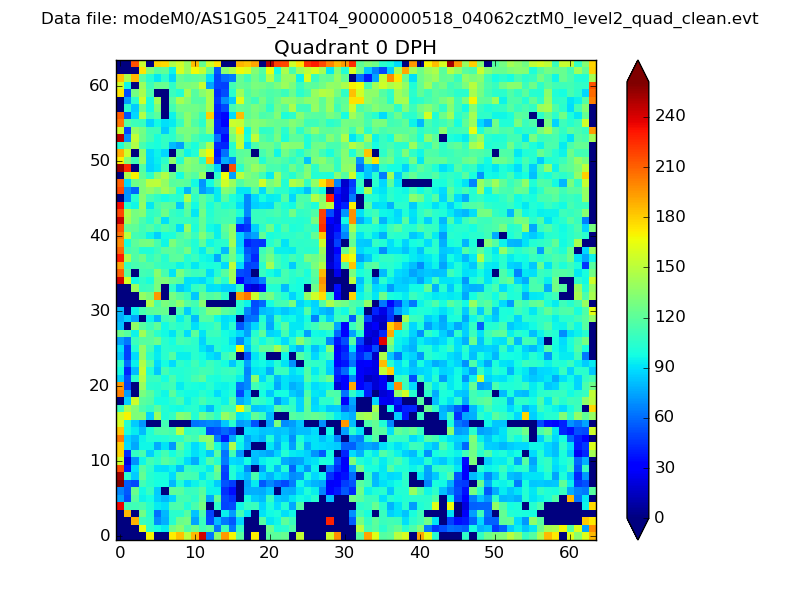 |
 |
Quadrant B |
|---|---|---|---|
| Quadrant D | 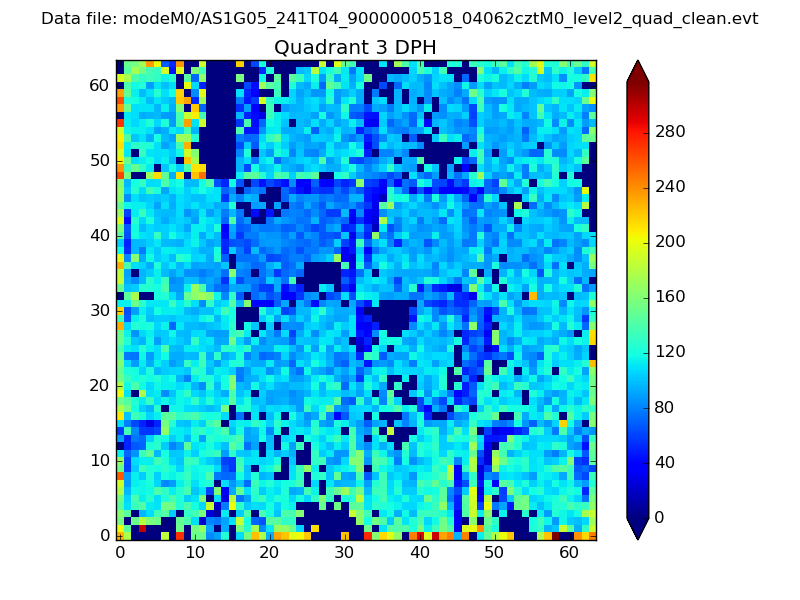 |
 |
Quadrant C |
| Plot type | Count rate plots | Images |
|---|---|---|
| Comparison with Poisson distribution Blue bars denote a histogram of data divided into 1 sec bins. Red curve is a Poisson curve with rate = median count rate of data. |
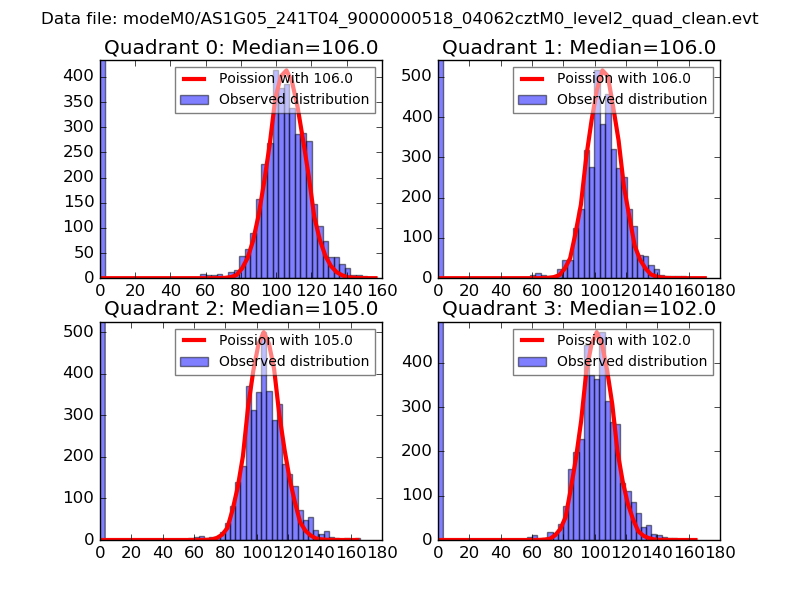 |
 |
| Quadrant-wise count rates Data is divided into 100 sec bins |
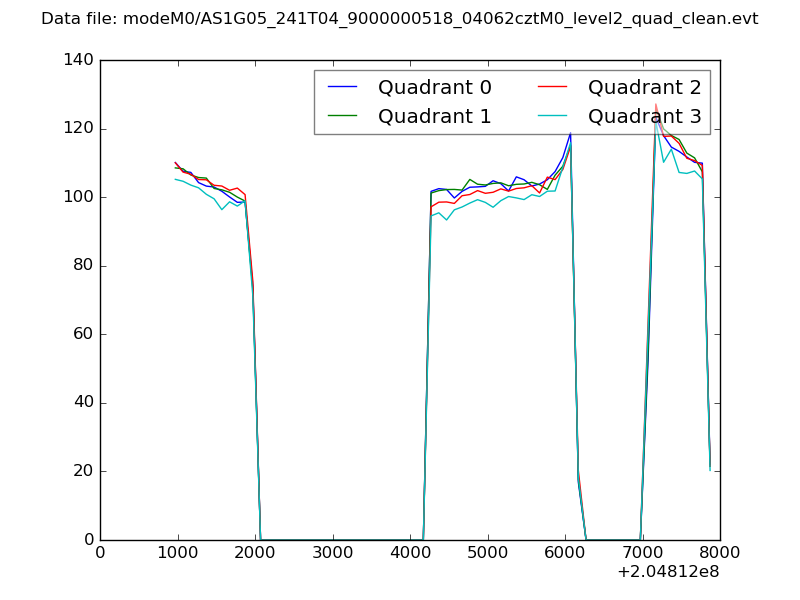 |
|
| Module-wise count rates for Quadrant A Data is divided into 100 sec bins |
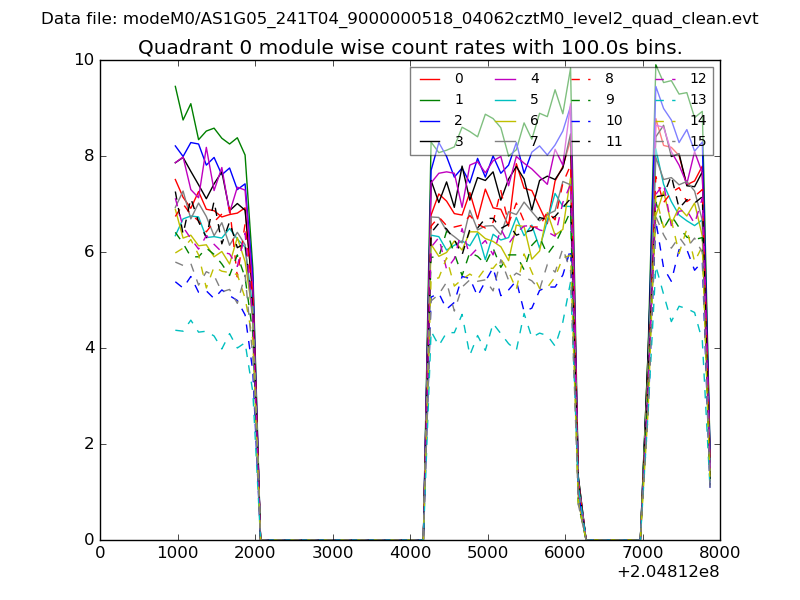 |
 |
| Module-wise count rates for Quadrant B Data is divided into 100 sec bins |
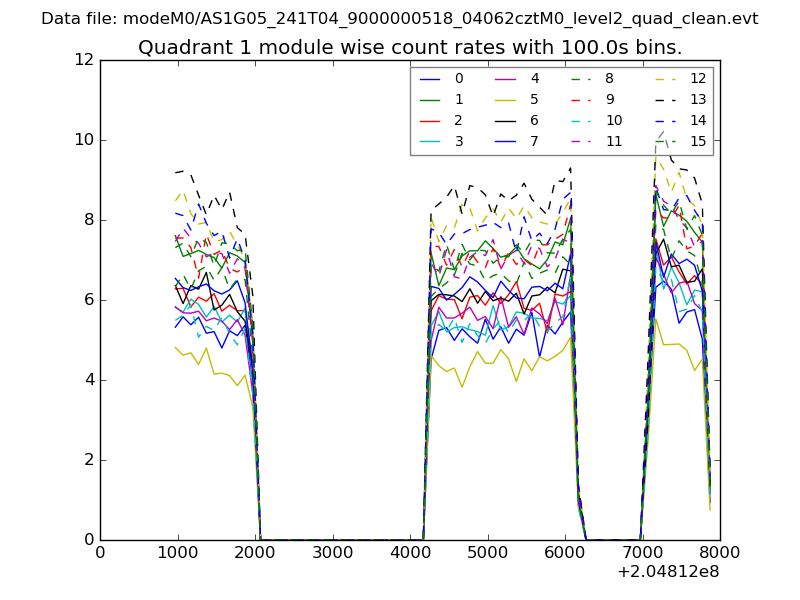 |
 |
| Module-wise count rates for Quadrant C Data is divided into 100 sec bins |
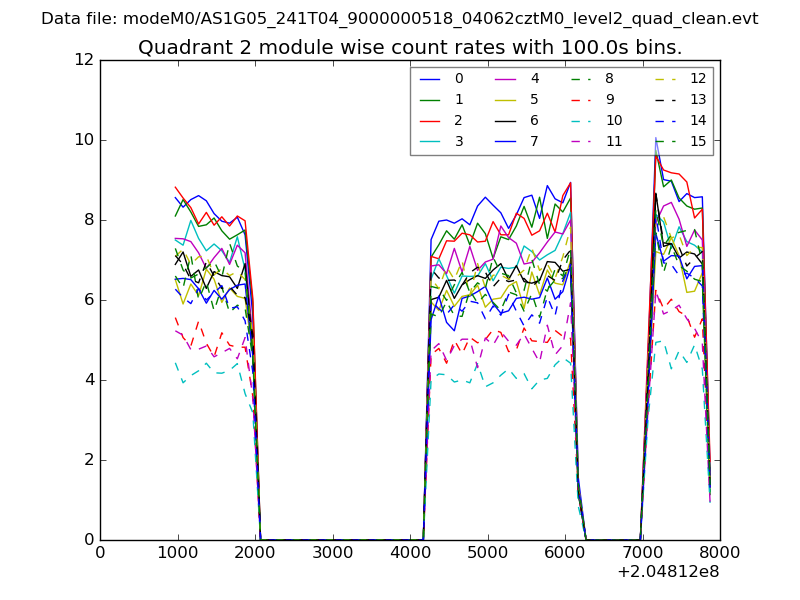 |
 |
| Module-wise count rates for Quadrant D Data is divided into 100 sec bins |
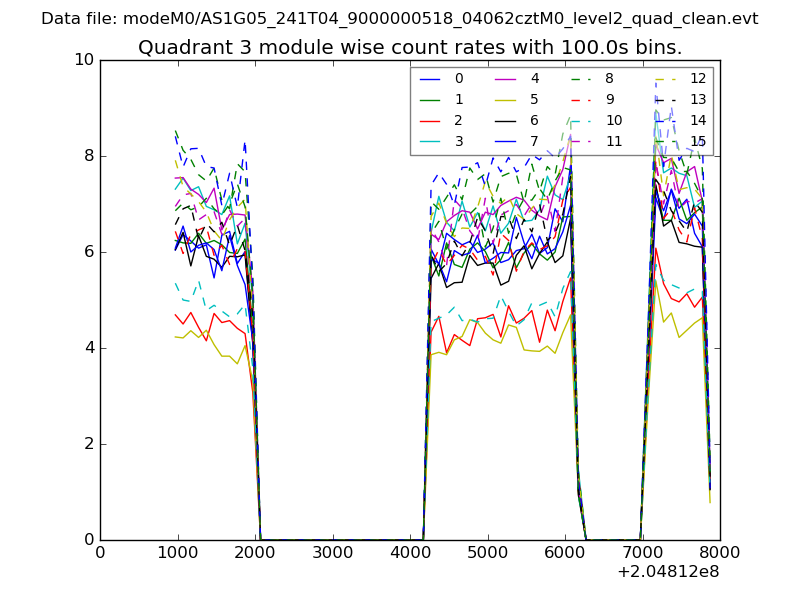 |
 |
| Parameter | Plot |
|---|---|
| CZT HV Monitor | 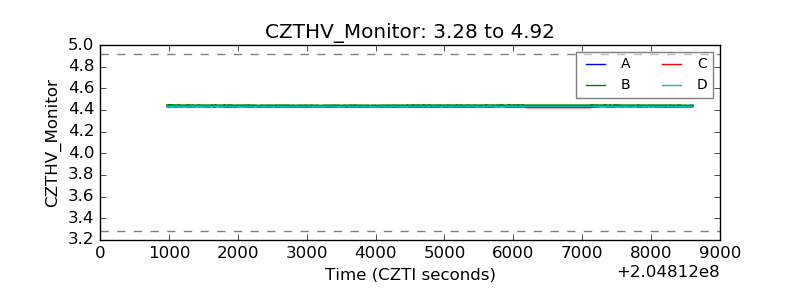 |
| D_VDD | 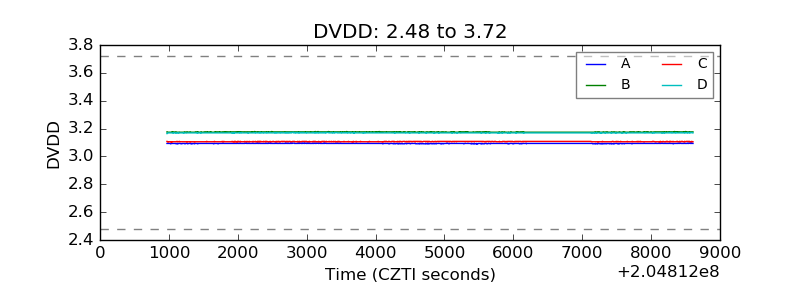 |
| Temperature 1 | 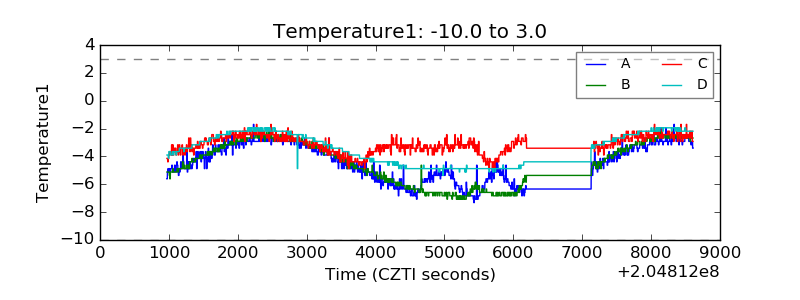 |
| Veto HV Monitor | 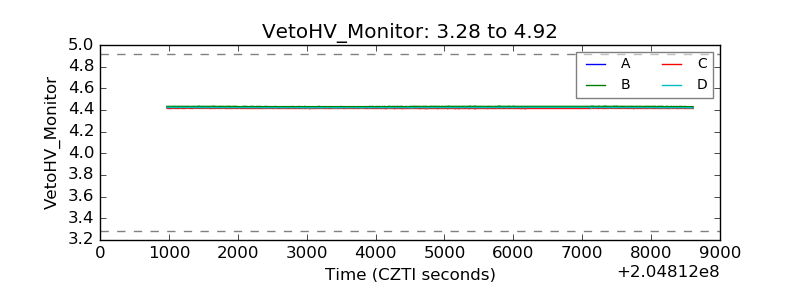 |
| Veto LLD | 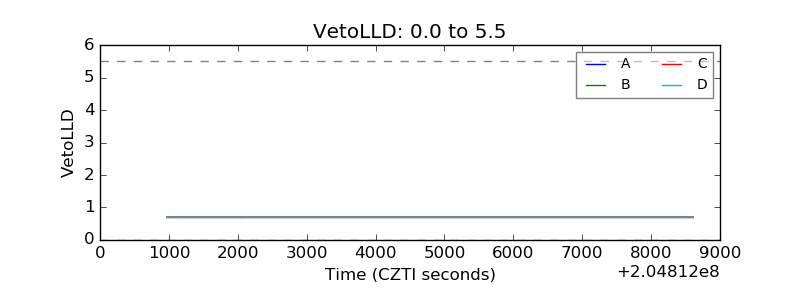 |
| Alpha Counter | 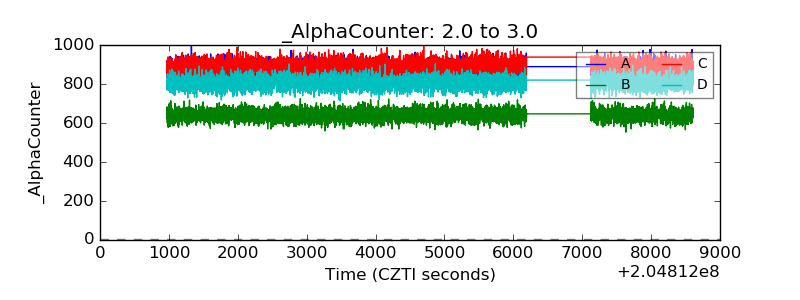 |
| _CPM_Rate | 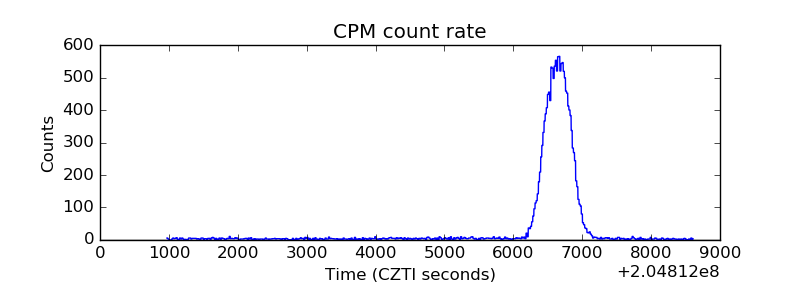 |
| CZT Counter | 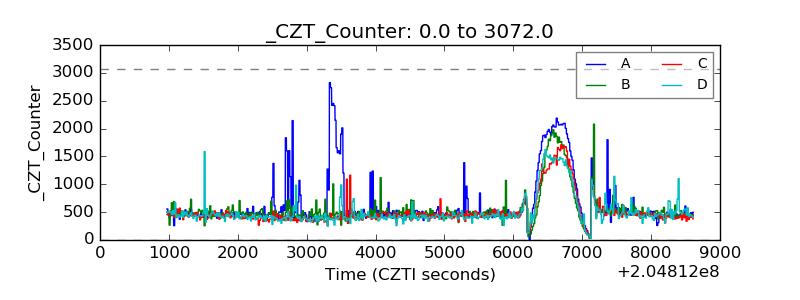 |
| +2.5 Volts monitor |  |
| +5 Volts monitor | 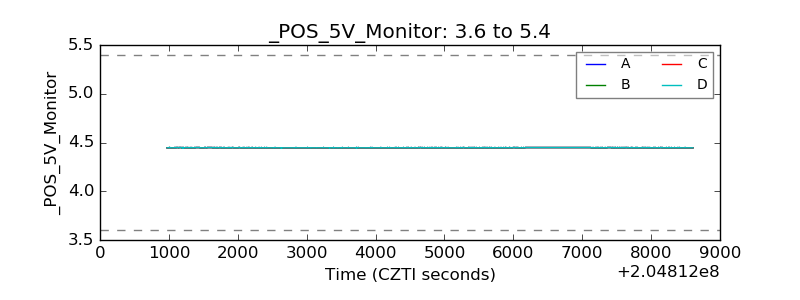 |
| _ROLL_ROT | 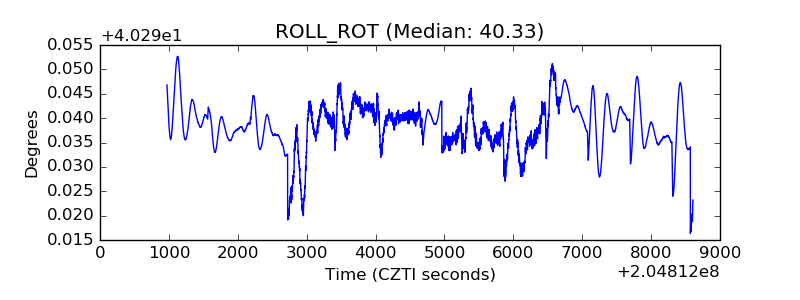 |
| _Roll_DEC | 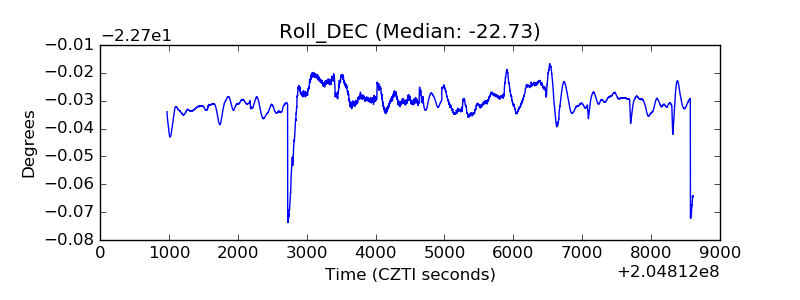 |
| _Roll_RA | 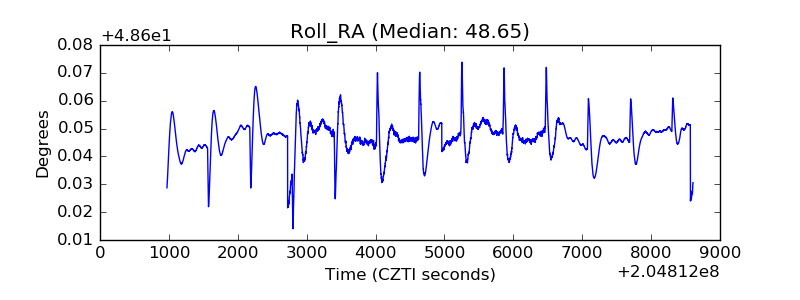 |
| Veto Counter | 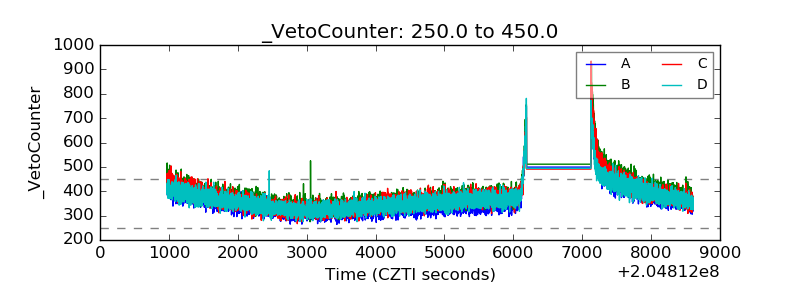 |