| Param | Original file | Final file |
|---|---|---|
| Filename | modeM0/AS1G05_241T04_9000000518_04064cztM0_level2.evt | modeM0/AS1G05_241T04_9000000518_04064cztM0_level2_quad_clean.evt |
| Size (bytes) | 476,314,560 | 61,652,160 |
| Size | 454.2 MB | 58.8 MB |
| Events in quadrant A | 3,411,386 | 359,363 |
| Events in quadrant B | 3,205,839 | 360,567 |
| Events in quadrant C | 2,918,834 | 354,596 |
| Events in quadrant D | 4,450,071 | 340,956 |
| Mode SS | |||
|---|---|---|---|
| Quadrant | BADHDUFLAG | Total packets | Discarded packets |
| A | 0 | 132 | 0 |
| B | 0 | 132 | 0 |
| C | 0 | 132 | 0 |
| D | 0 | 132 | 0 |
| Mode M0 | |||
|---|---|---|---|
| Quadrant | BADHDUFLAG | Total packets | Discarded packets |
| A | 0 | 14359 | 3 |
| B | 0 | 13669 | 2 |
| C | 0 | 13210 | 2 |
| D | 0 | 17711 | 2 |
| Mode M9 | |||
|---|---|---|---|
| Quadrant | BADHDUFLAG | Total packets | Discarded packets |
| A | 0 | 11 | 0 |
| B | 0 | 11 | 0 |
| C | 0 | 11 | 0 |
| D | 0 | 11 | 0 |
| Quadrant | Total seconds | Saturated seconds | Saturation percentage |
|---|---|---|---|
| A | 6463 | 116 | 1.794832% |
| B | 6463 | 78 | 1.206870% |
| C | 6463 | 35 | 0.541544% |
| D | 6463 | 250 | 3.868173% |
Noise dominated data is calculated using 1-second bins in cleaned event files. If a bin has >2000 counts, and if more than 50% of those come from <1% of pixels, then it is considered to be noise-dominated and hence unusable.
| Quadrant | # 1 sec bins | Bins with >0 counts | Bins with >2000 counts | High rate bins dominated by noise | Noise dominated (total time) | Noise dominated (detector-on time) | Marked lightcurve |
|---|---|---|---|---|---|---|---|
| A | 7548 | 6463 | 42 | 42 | 0.56% | 0.65% | 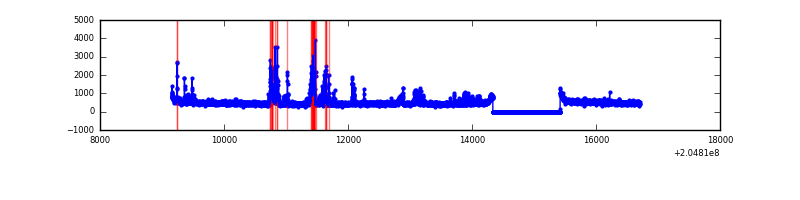 |
| B | 7548 | 6463 | 7 | 7 | 0.09% | 0.11% | 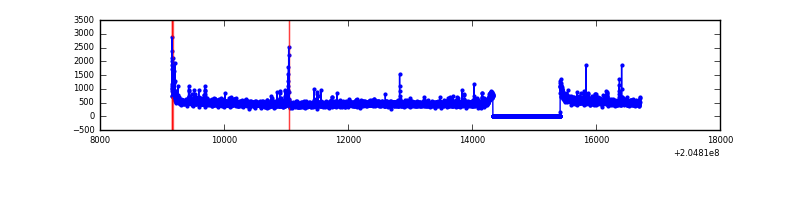 |
| C | 7548 | 6463 | 1 | 1 | 0.01% | 0.02% | 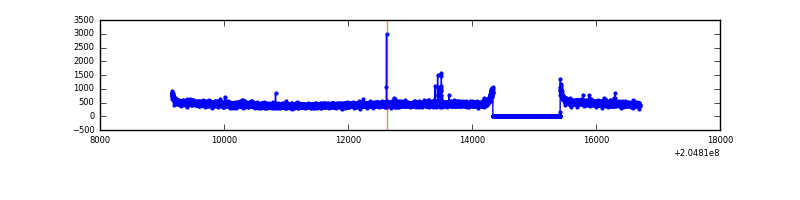 |
| D | 7548 | 6463 | 158 | 158 | 2.09% | 2.44% | 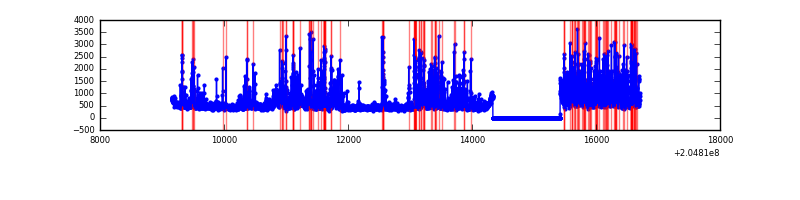 |
Top three noisy pixels from each quadrant. If the there are fewer than three noisy pixels in the level2.evt file, extra rows are filled as -1
| Pixel properties | Quadrant properties | ||||||
|---|---|---|---|---|---|---|---|
| Quadrant | DetID | PixID | Counts | Sigma | Mean | Median | Sigma |
| A | 0 | 50 | 320775 | 2031.58 | 772 | 756 | 157.5 |
| A | 0 | 199 | 75419 | 473.98 | 772 | 756 | 157.5 |
| A | 8 | 15 | 21595 | 132.29 | 772 | 756 | 157.5 |
| B | 4 | 81 | 85306 | 560.67 | 778 | 759 | 150.8 |
| B | 14 | 167 | 33034 | 214.03 | 778 | 759 | 150.8 |
| B | 15 | 204 | 28104 | 181.34 | 778 | 759 | 150.8 |
| C | 9 | 144 | 16279 | 90.49 | 741 | 744 | 171.7 |
| C | 12 | 4 | 9328 | 50.0 | 741 | 744 | 171.7 |
| C | 13 | 61 | 6109 | 31.25 | 741 | 744 | 171.7 |
| D | 10 | 172 | 925948 | 5182.33 | 736 | 716 | 178.5 |
| D | 13 | 53 | 300511 | 1679.19 | 736 | 716 | 178.5 |
| D | 2 | 232 | 224869 | 1255.51 | 736 | 716 | 178.5 |
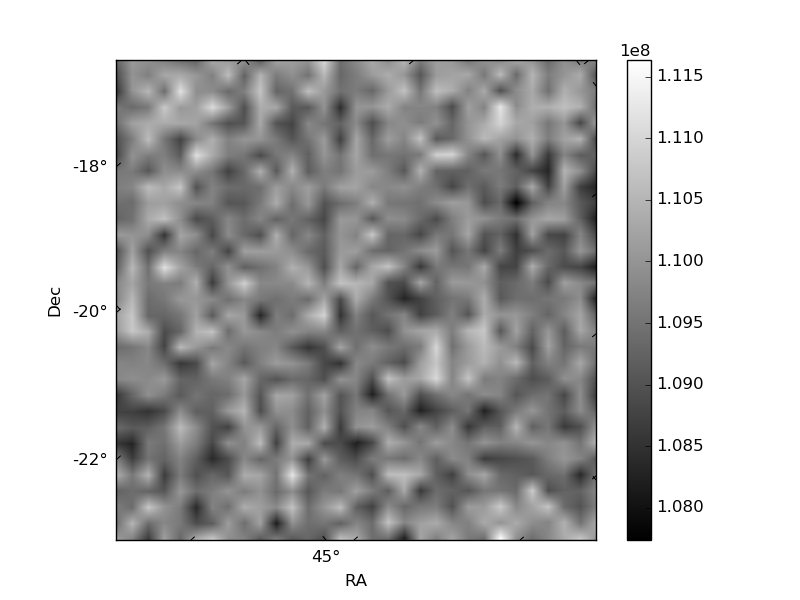
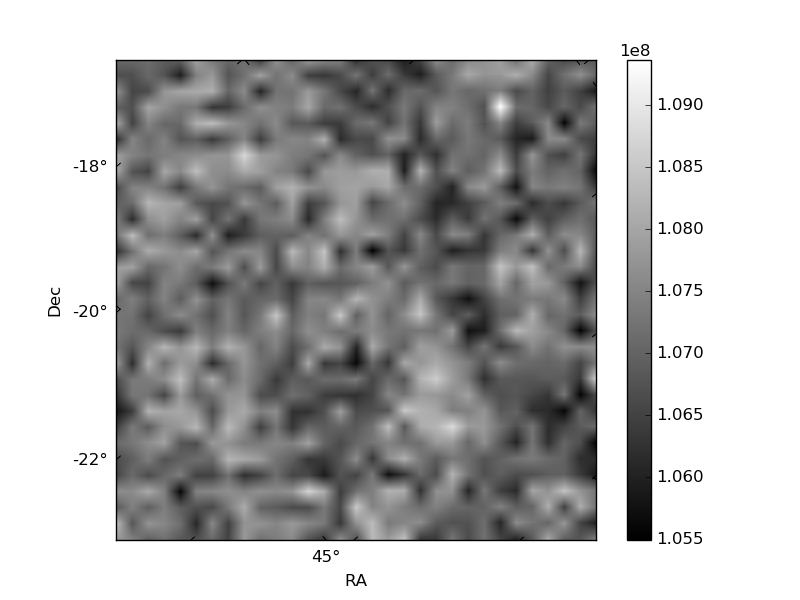
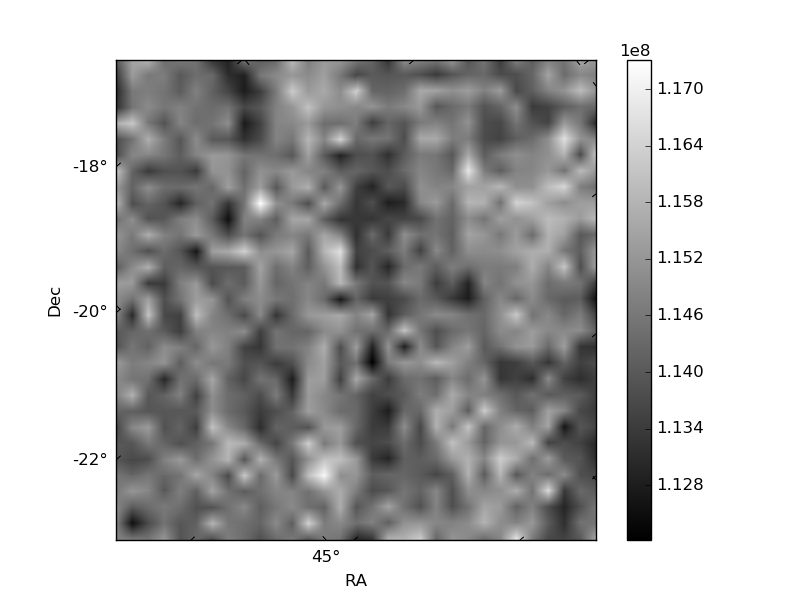
Histogram calculated using DETX and DETY for each event in the final _common_clean file
| Quadrant A | 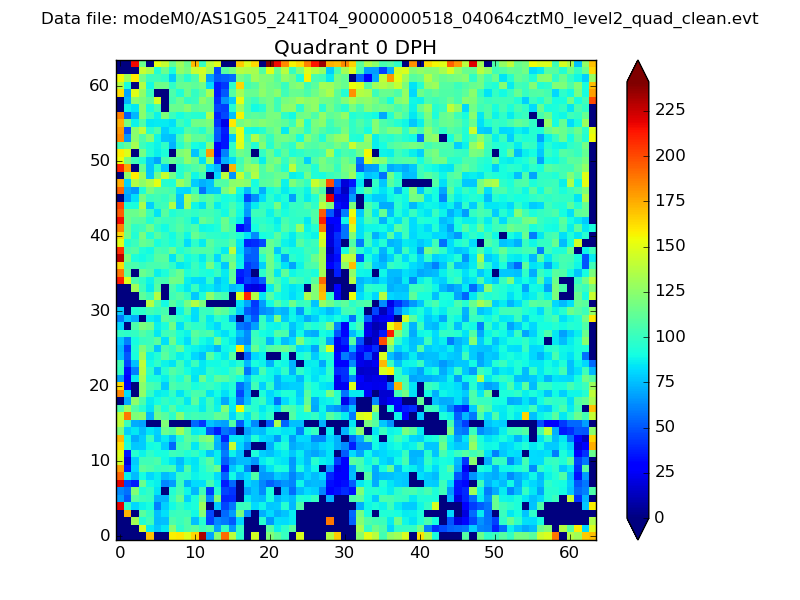 |
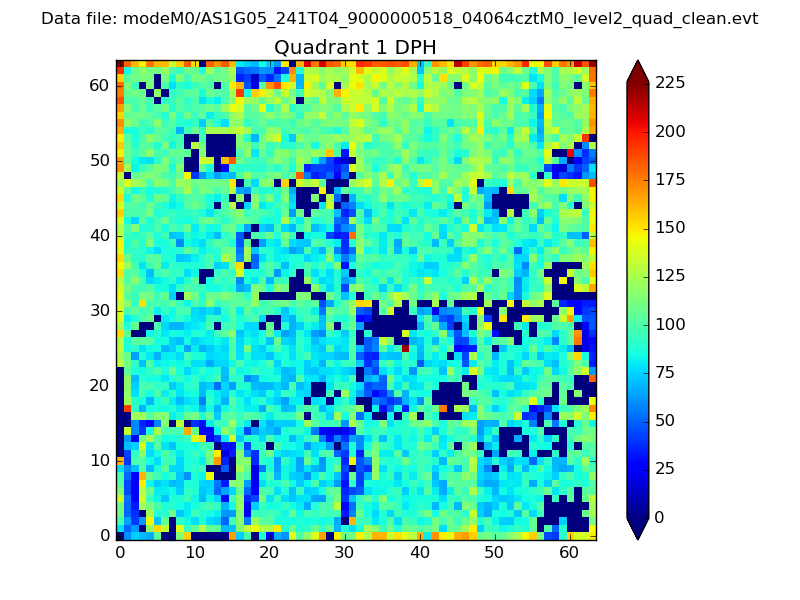 |
Quadrant B |
|---|---|---|---|
| Quadrant D | 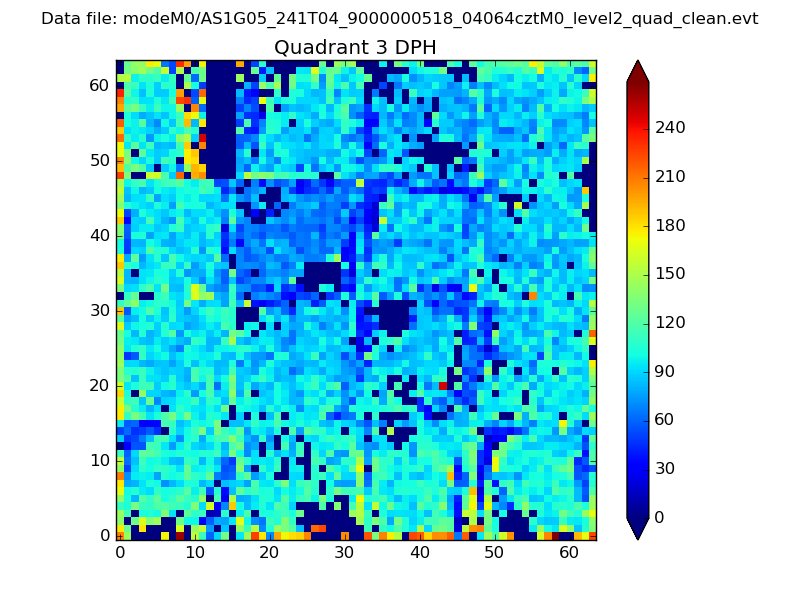 |
 |
Quadrant C |
| Plot type | Count rate plots | Images |
|---|---|---|
| Comparison with Poisson distribution Blue bars denote a histogram of data divided into 1 sec bins. Red curve is a Poisson curve with rate = median count rate of data. |
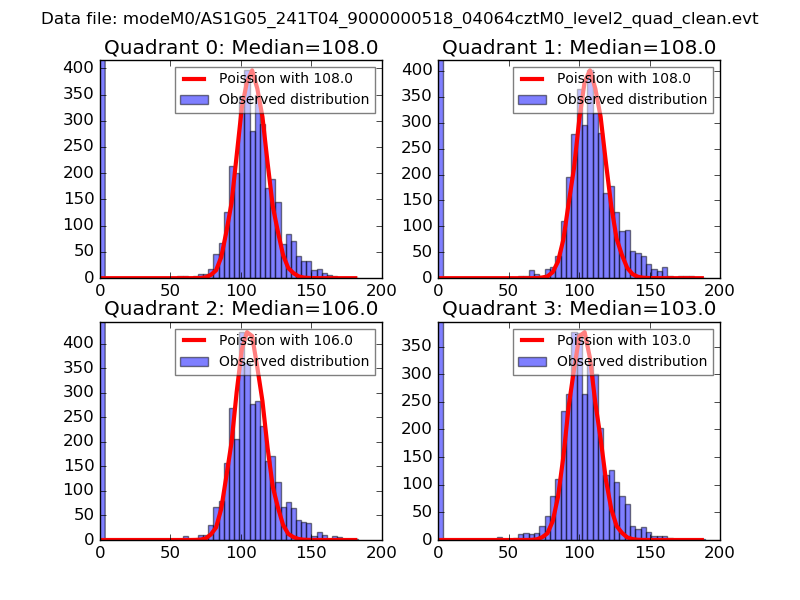 |
 |
| Quadrant-wise count rates Data is divided into 100 sec bins |
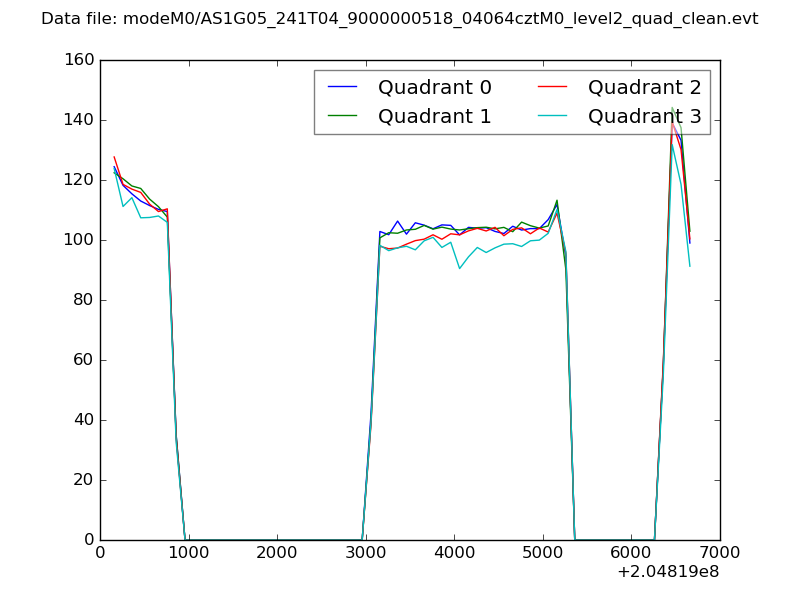 |
|
| Module-wise count rates for Quadrant A Data is divided into 100 sec bins |
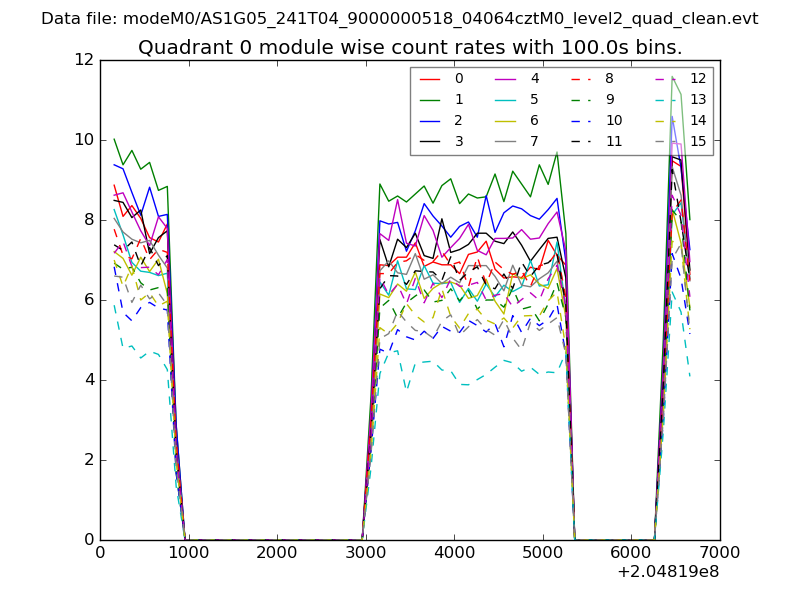 |
 |
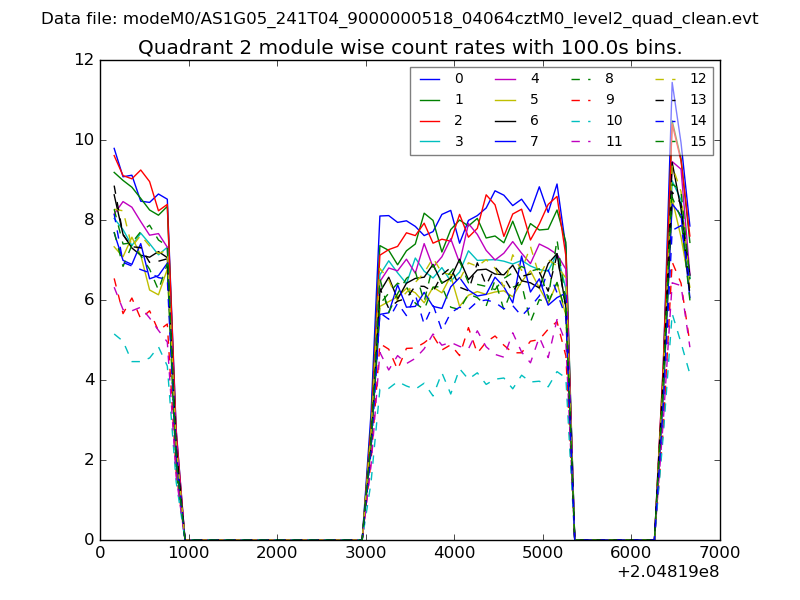
| Module-wise count rates for Quadrant B Data is divided into 100 sec bins |
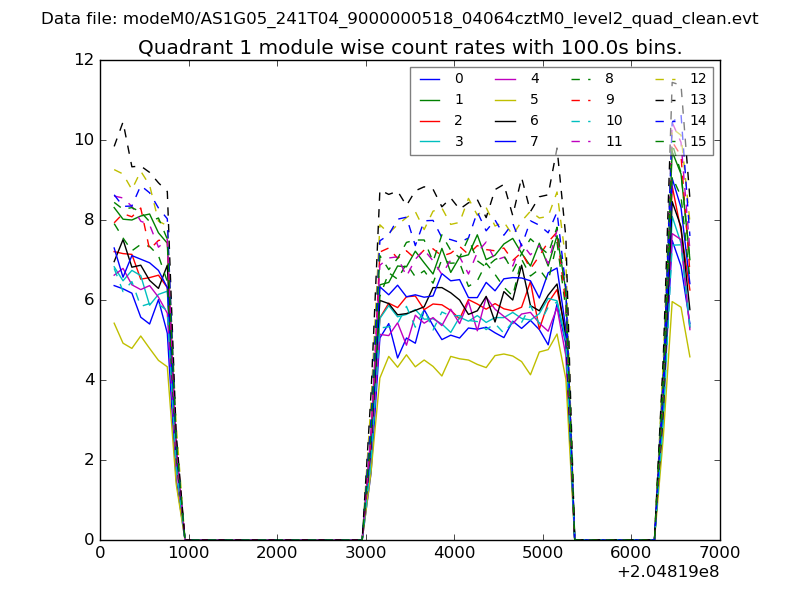 |
 |
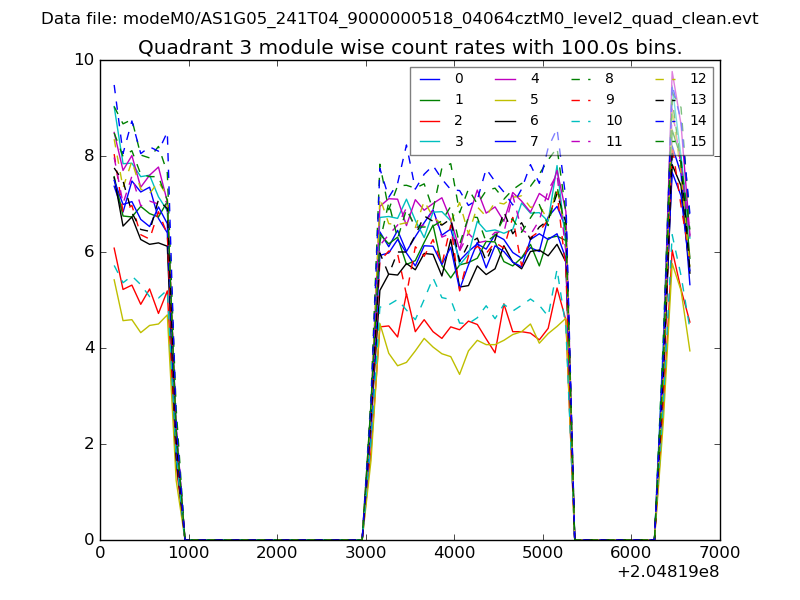
| Module-wise count rates for Quadrant C Data is divided into 100 sec bins |
 |
 |
| Module-wise count rates for Quadrant D Data is divided into 100 sec bins |
 |
 |
| Parameter | Plot |
|---|---|
| CZT HV Monitor | 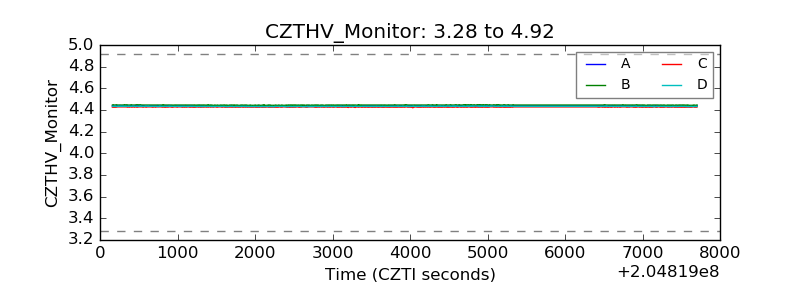 |
| D_VDD | 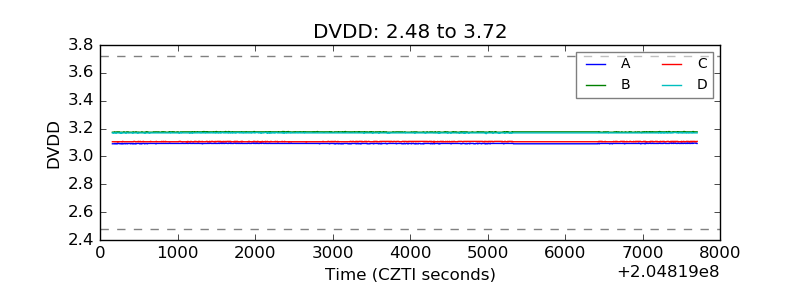 |
| Temperature 1 | 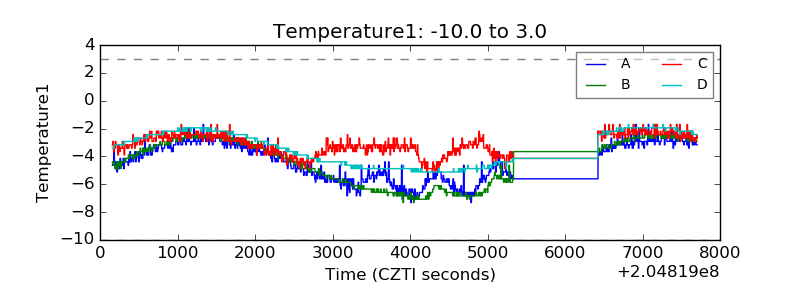 |
| Veto HV Monitor | 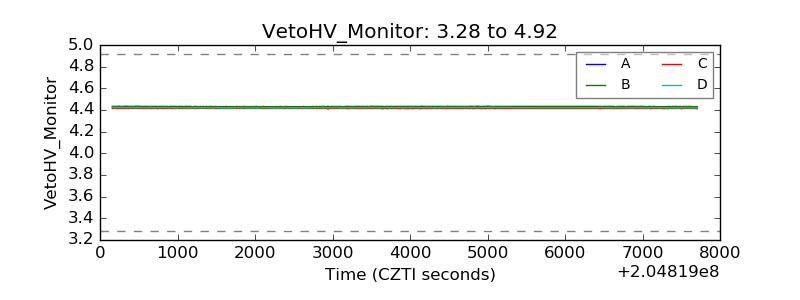 |
| Veto LLD | 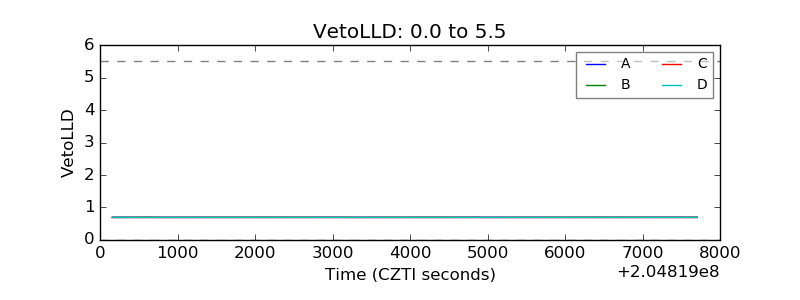 |
| Alpha Counter | 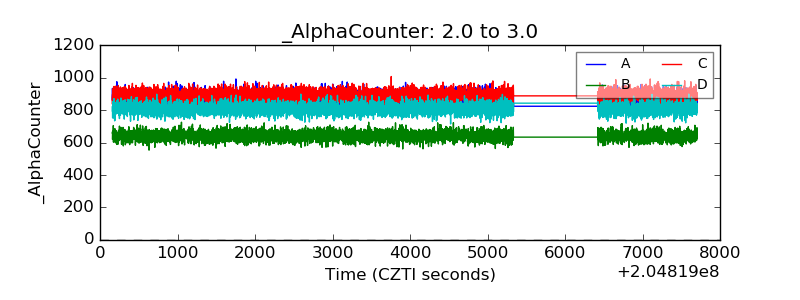 |
| _CPM_Rate | 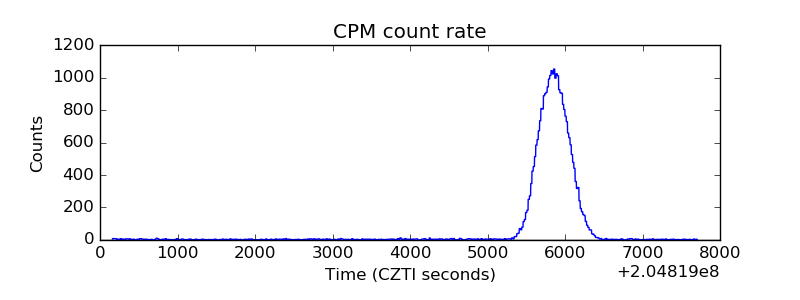 |
| CZT Counter | 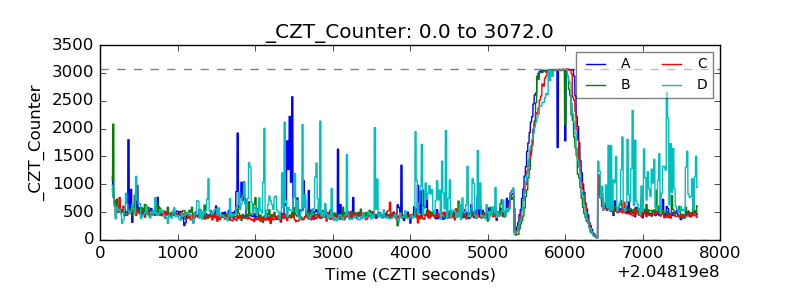 |
| +2.5 Volts monitor |  |
| +5 Volts monitor | 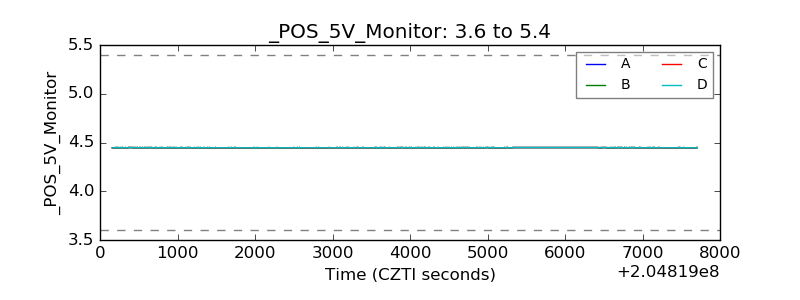 |
| _ROLL_ROT | 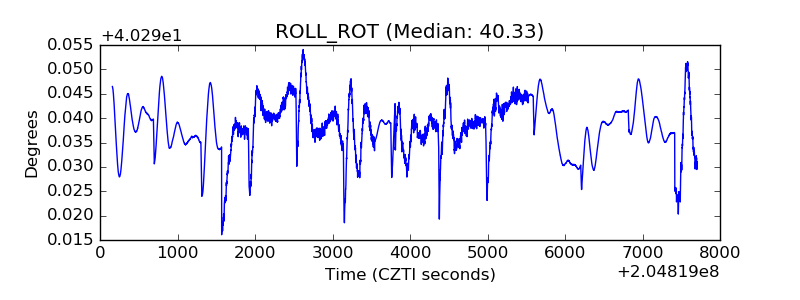 |
| _Roll_DEC | 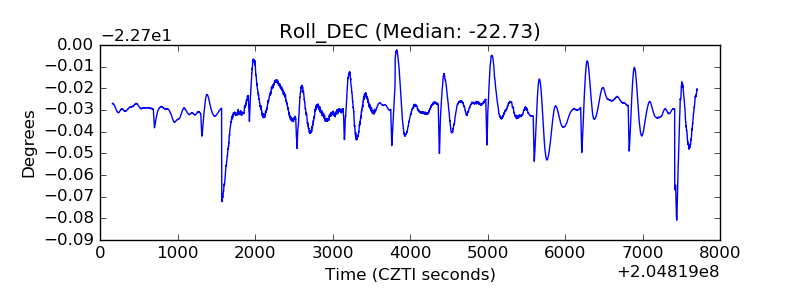 |
| _Roll_RA |  |
| Veto Counter | 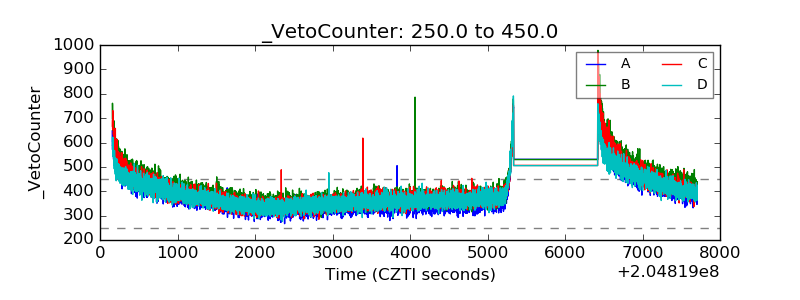 |