| Param | Original file | Final file |
|---|---|---|
| Filename | modeM0/AS1G05_241T04_9000000518_04066cztM0_level2.evt | modeM0/AS1G05_241T04_9000000518_04066cztM0_level2_quad_clean.evt |
| Size (bytes) | 478,503,360 | 54,953,280 |
| Size | 456.3 MB | 52.4 MB |
| Events in quadrant A | 4,082,157 | 313,657 |
| Events in quadrant B | 3,387,822 | 315,610 |
| Events in quadrant C | 2,972,717 | 307,945 |
| Events in quadrant D | 3,628,728 | 294,389 |
| Mode SS | |||
|---|---|---|---|
| Quadrant | BADHDUFLAG | Total packets | Discarded packets |
| A | 0 | 126 | 0 |
| B | 0 | 126 | 0 |
| C | 0 | 126 | 0 |
| D | 0 | 126 | 0 |
| Mode M0 | |||
|---|---|---|---|
| Quadrant | BADHDUFLAG | Total packets | Discarded packets |
| A | 0 | 16259 | 3 |
| B | 0 | 14086 | 2 |
| C | 0 | 12832 | 2 |
| D | 0 | 14980 | 2 |
| Mode M9 | |||
|---|---|---|---|
| Quadrant | BADHDUFLAG | Total packets | Discarded packets |
| A | 0 | 15 | 0 |
| B | 0 | 15 | 0 |
| C | 0 | 15 | 0 |
| D | 0 | 16 | 0 |
| Quadrant | Total seconds | Saturated seconds | Saturation percentage |
|---|---|---|---|
| A | 6187 | 223 | 3.604332% |
| B | 6187 | 128 | 2.068854% |
| C | 6187 | 52 | 0.840472% |
| D | 6187 | 142 | 2.295135% |
Noise dominated data is calculated using 1-second bins in cleaned event files. If a bin has >2000 counts, and if more than 50% of those come from <1% of pixels, then it is considered to be noise-dominated and hence unusable.
| Quadrant | # 1 sec bins | Bins with >0 counts | Bins with >2000 counts | High rate bins dominated by noise | Noise dominated (total time) | Noise dominated (detector-on time) | Marked lightcurve |
|---|---|---|---|---|---|---|---|
| A | 7452 | 6187 | 107 | 107 | 1.44% | 1.73% |  |
| B | 7452 | 6187 | 18 | 18 | 0.24% | 0.29% | 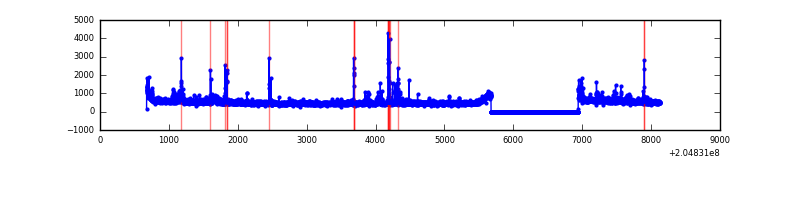 |
| C | 7452 | 6188 | 0 | 0 | 0.00% | 0.00% | 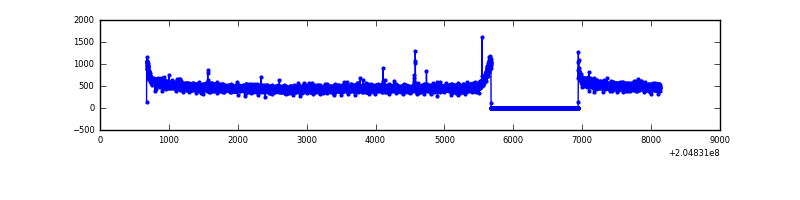 |
| D | 7452 | 6188 | 64 | 64 | 0.86% | 1.03% | 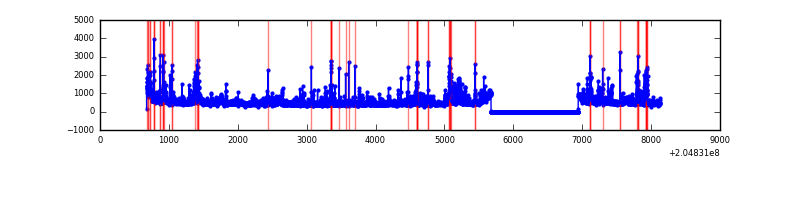 |
Top three noisy pixels from each quadrant. If the there are fewer than three noisy pixels in the level2.evt file, extra rows are filled as -1
| Pixel properties | Quadrant properties | ||||||
|---|---|---|---|---|---|---|---|
| Quadrant | DetID | PixID | Counts | Sigma | Mean | Median | Sigma |
| A | 8 | 15 | 627459 | 3978.82 | 780 | 764 | 157.5 |
| A | 0 | 118 | 341765 | 2164.98 | 780 | 764 | 157.5 |
| A | 0 | 50 | 75690 | 475.7 | 780 | 764 | 157.5 |
| B | 4 | 81 | 153363 | 1020.86 | 794 | 779 | 149.5 |
| B | 14 | 167 | 55977 | 369.3 | 794 | 779 | 149.5 |
| B | 15 | 204 | 36010 | 235.71 | 794 | 779 | 149.5 |
| C | 9 | 144 | 10358 | 54.51 | 758 | 764 | 176.0 |
| C | 13 | 61 | 6343 | 31.7 | 758 | 764 | 176.0 |
| C | 12 | 4 | 2513 | 9.94 | 758 | 764 | 176.0 |
| D | 10 | 172 | 423699 | 2340.75 | 750 | 727 | 180.7 |
| D | 2 | 14 | 99911 | 548.89 | 750 | 727 | 180.7 |
| D | 2 | 232 | 93672 | 514.36 | 750 | 727 | 180.7 |
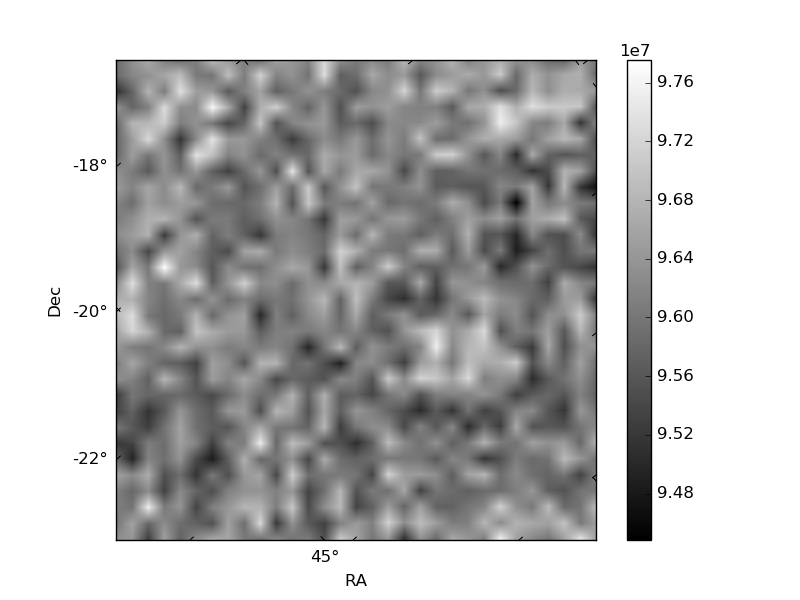
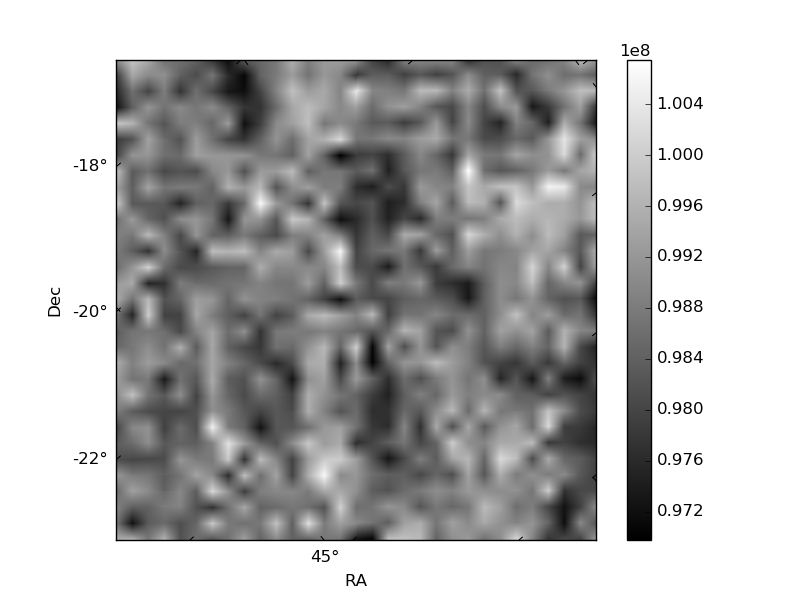
Histogram calculated using DETX and DETY for each event in the final _common_clean file
| Quadrant A |  |
 |
Quadrant B |
|---|---|---|---|
| Quadrant D | 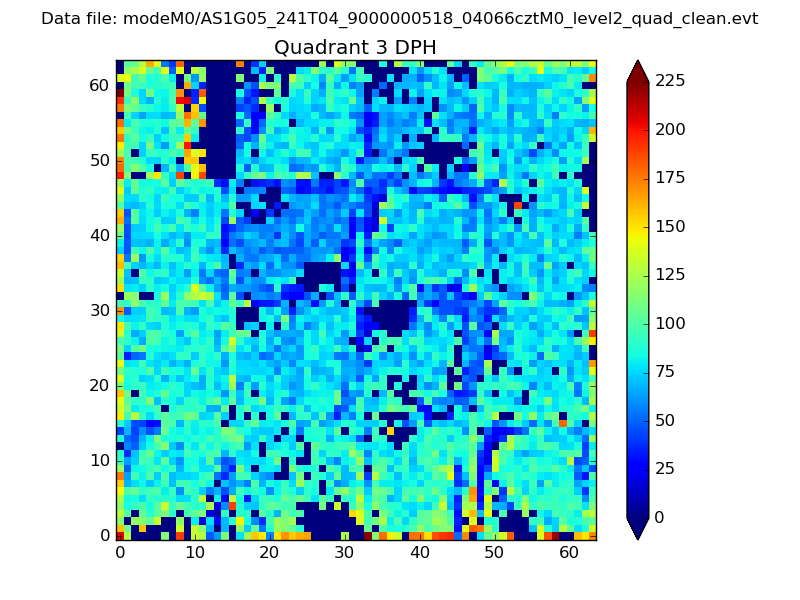 |
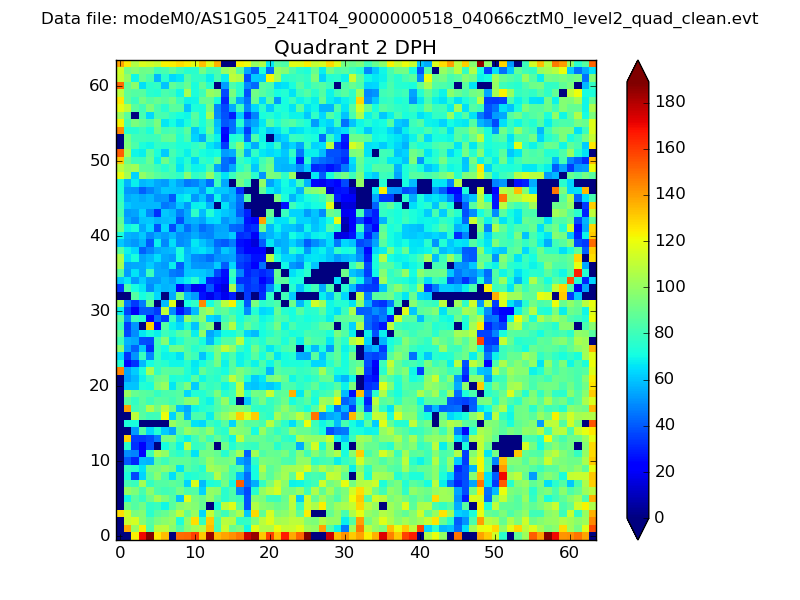 |
Quadrant C |
| Plot type | Count rate plots | Images |
|---|---|---|
| Comparison with Poisson distribution Blue bars denote a histogram of data divided into 1 sec bins. Red curve is a Poisson curve with rate = median count rate of data. |
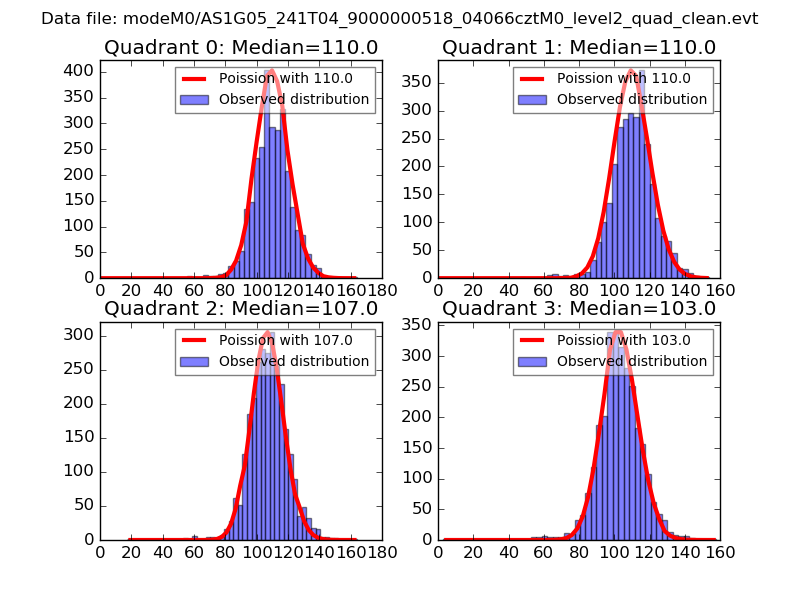 |
 |
| Quadrant-wise count rates Data is divided into 100 sec bins |
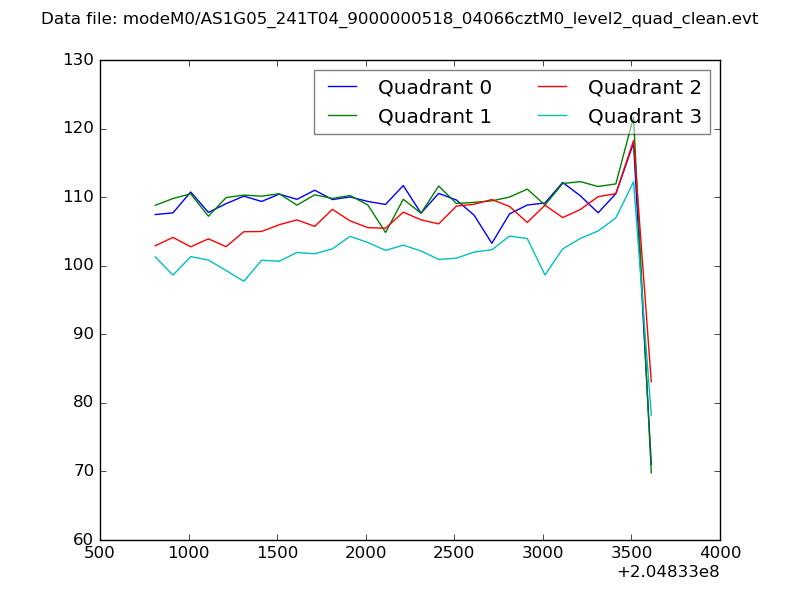 |
|
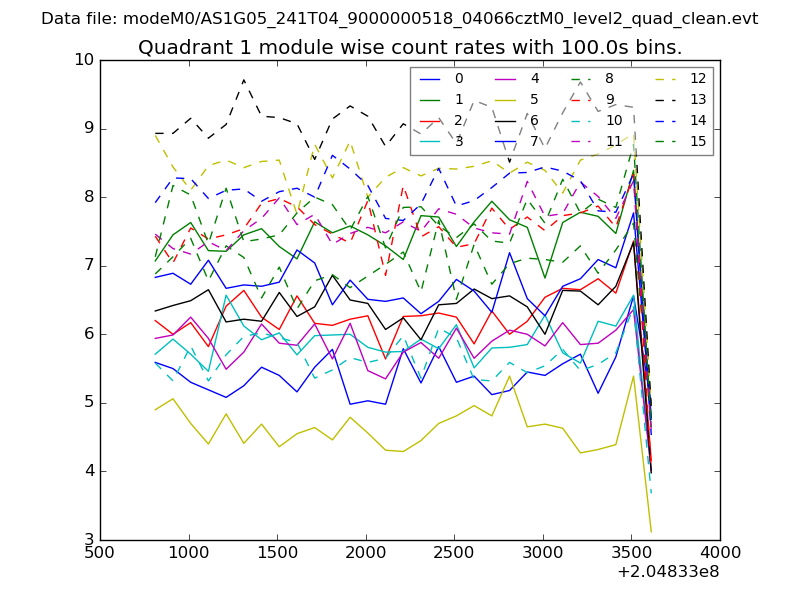
| Module-wise count rates for Quadrant A Data is divided into 100 sec bins |
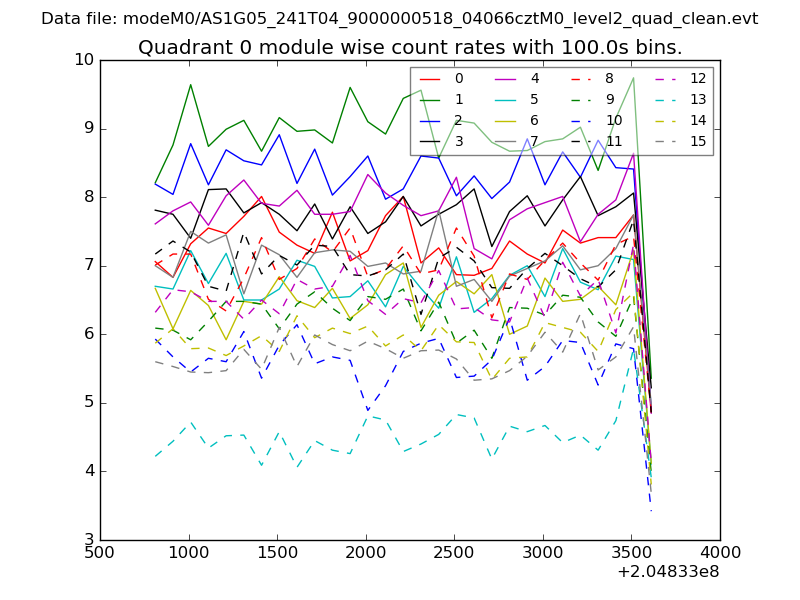 |
 |
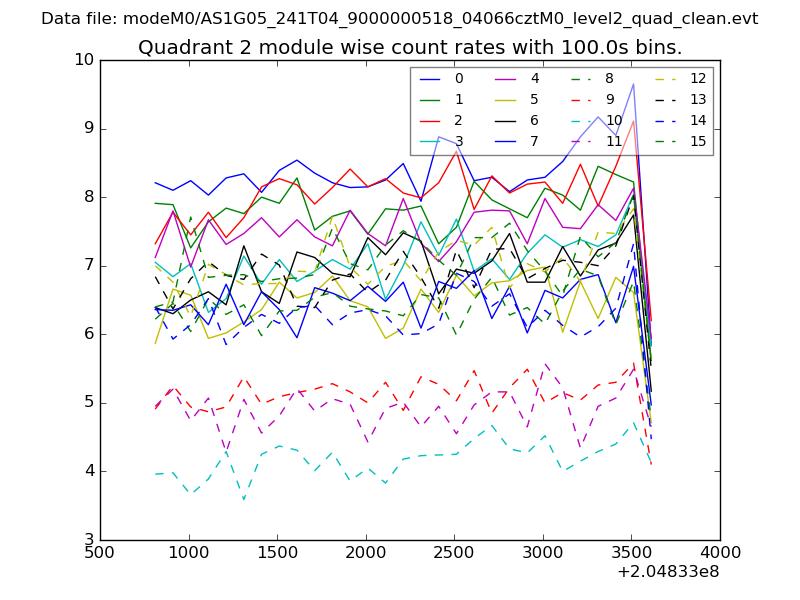
| Module-wise count rates for Quadrant B Data is divided into 100 sec bins |
 |
 |
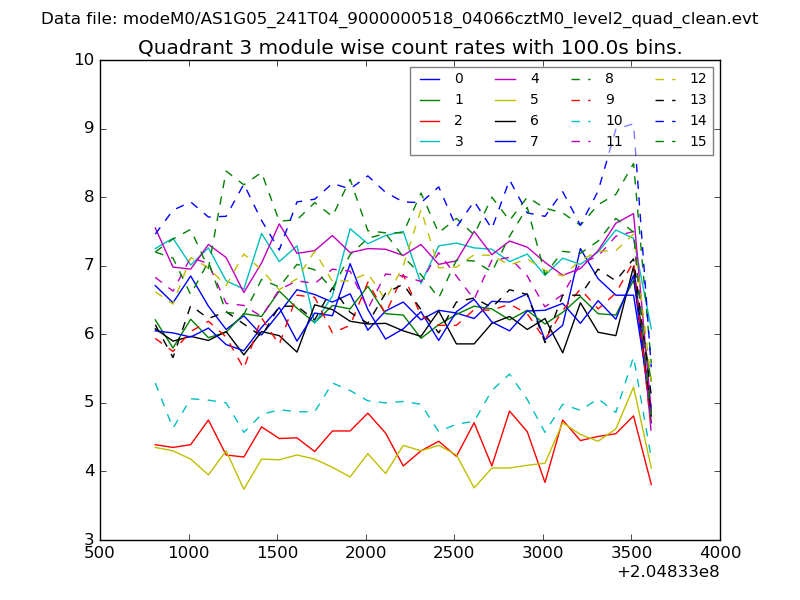
| Module-wise count rates for Quadrant C Data is divided into 100 sec bins |
 |
 |
| Module-wise count rates for Quadrant D Data is divided into 100 sec bins |
 |
 |
| Parameter | Plot |
|---|---|
| CZT HV Monitor | 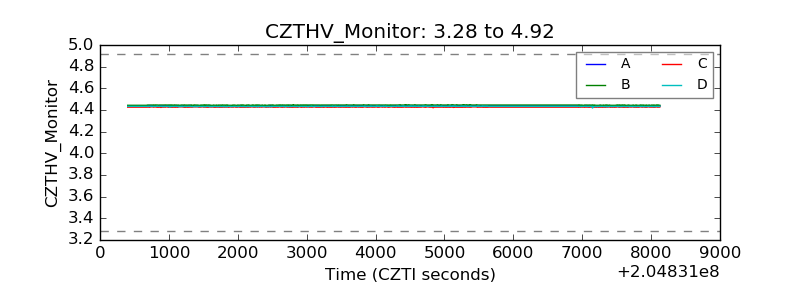 |
| D_VDD | 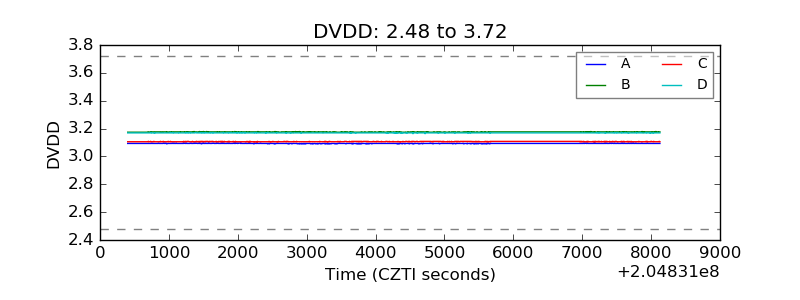 |
| Temperature 1 | 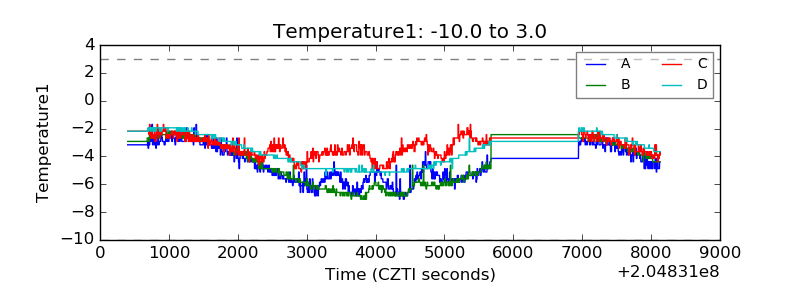 |
| Veto HV Monitor | 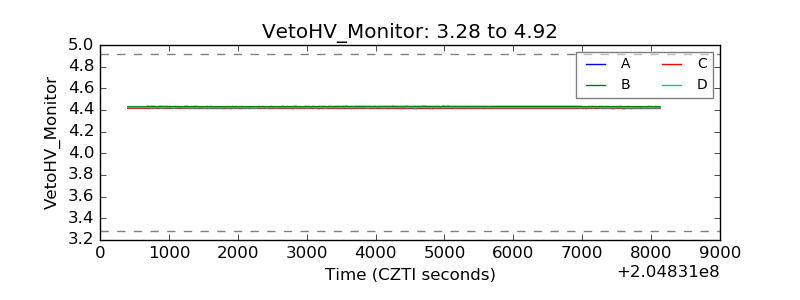 |
| Veto LLD | 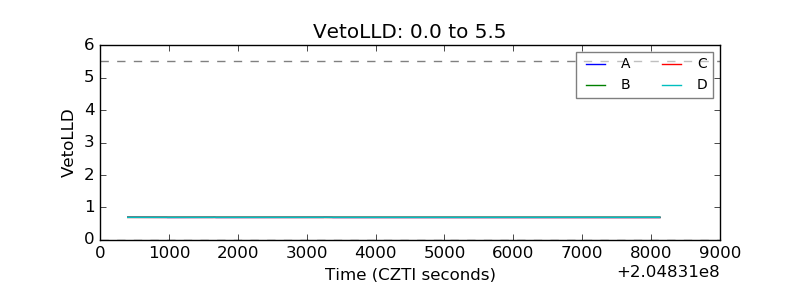 |
| Alpha Counter | 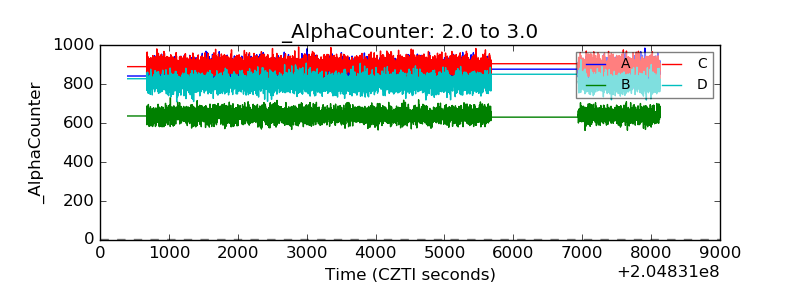 |
| _CPM_Rate | 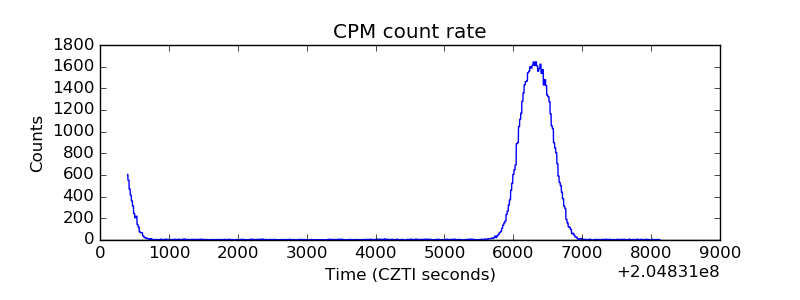 |
| CZT Counter | 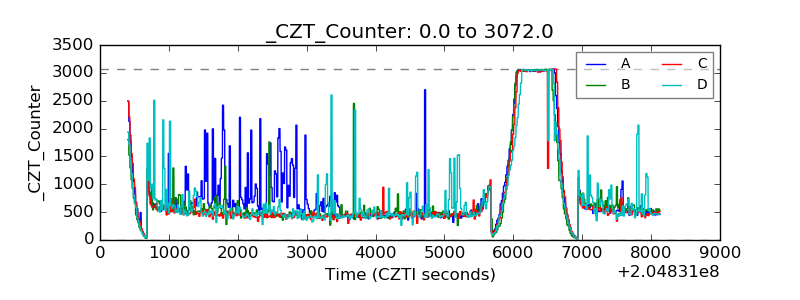 |
| +2.5 Volts monitor |  |
| +5 Volts monitor | 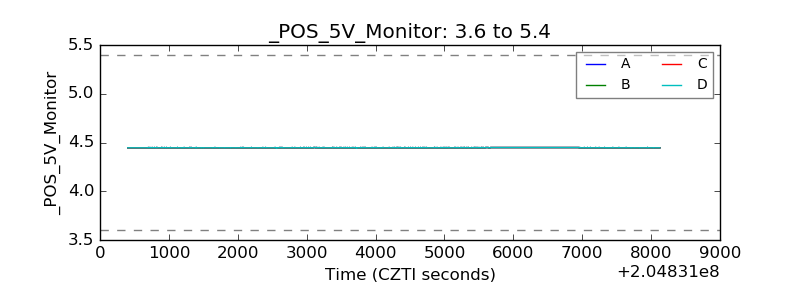 |
| _ROLL_ROT | 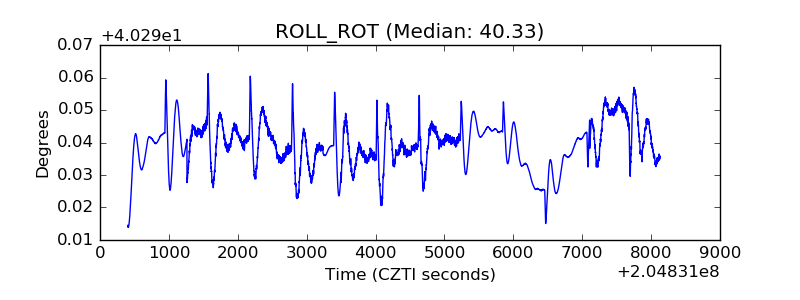 |
| _Roll_DEC | 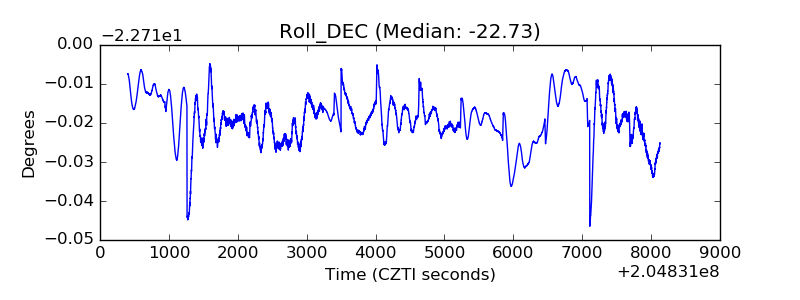 |
| _Roll_RA |  |
| Veto Counter | 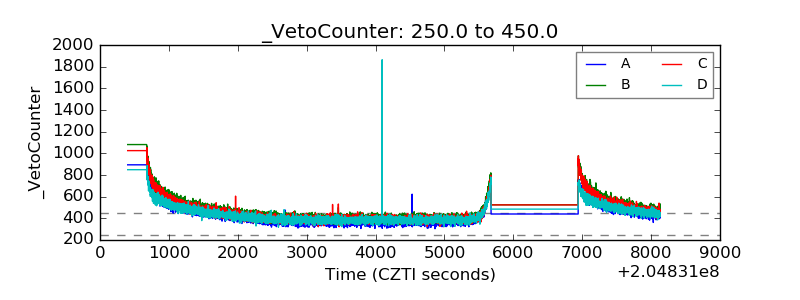 |