| Param | Original file | Final file |
|---|---|---|
| Filename | modeM0/AS1G05_241T04_9000000518_04068cztM0_level2.evt | modeM0/AS1G05_241T04_9000000518_04068cztM0_level2_quad_clean.evt |
| Size (bytes) | 163,575,360 | 12,674,880 |
| Size | 156.0 MB | 12.1 MB |
| Events in quadrant A | 1,856,938 | 63,474 |
| Events in quadrant B | 1,057,901 | 63,907 |
| Events in quadrant C | 895,109 | 60,784 |
| Events in quadrant D | 1,014,885 | 58,905 |
| Mode SS | |||
|---|---|---|---|
| Quadrant | BADHDUFLAG | Total packets | Discarded packets |
| A | 0 | 36 | 0 |
| B | 0 | 36 | 0 |
| C | 0 | 36 | 0 |
| D | 0 | 36 | 0 |
| Mode M0 | |||
|---|---|---|---|
| Quadrant | BADHDUFLAG | Total packets | Discarded packets |
| A | 0 | 6724 | 1 |
| B | 0 | 4313 | 7 |
| C | 0 | 3790 | 1 |
| D | 0 | 4212 | 1 |
| Mode M9 | |||
|---|---|---|---|
| Quadrant | BADHDUFLAG | Total packets | Discarded packets |
| A | 0 | 3 | 0 |
| B | 0 | 3 | 0 |
| C | 0 | 3 | 0 |
| D | 0 | 4 | 0 |
| Quadrant | Total seconds | Saturated seconds | Saturation percentage |
|---|---|---|---|
| A | 1866 | 525 | 28.135048% |
| B | 1864 | 14 | 0.751073% |
| C | 1866 | 3 | 0.160772% |
| D | 1866 | 33 | 1.768489% |
Noise dominated data is calculated using 1-second bins in cleaned event files. If a bin has >2000 counts, and if more than 50% of those come from <1% of pixels, then it is considered to be noise-dominated and hence unusable.
| Quadrant | # 1 sec bins | Bins with >0 counts | Bins with >2000 counts | High rate bins dominated by noise | Noise dominated (total time) | Noise dominated (detector-on time) | Marked lightcurve |
|---|---|---|---|---|---|---|---|
| A | 1866 | 1866 | 421 | 421 | 22.56% | 22.56% | 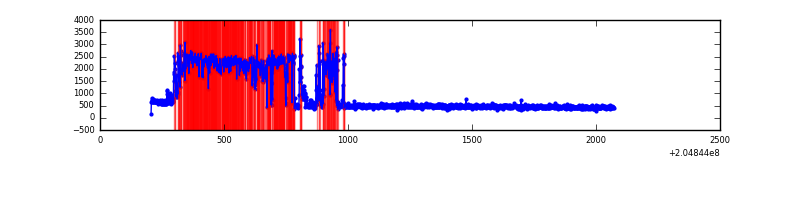 |
| B | 1866 | 1866 | 2 | 2 | 0.11% | 0.11% | 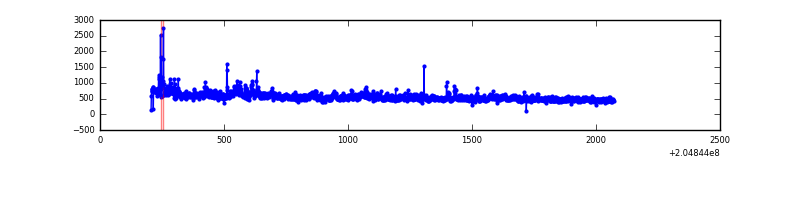 |
| C | 1866 | 1866 | 0 | 0 | 0.00% | 0.00% | 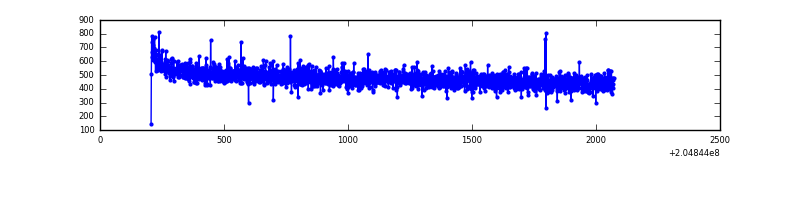 |
| D | 1866 | 1866 | 27 | 27 | 1.45% | 1.45% | 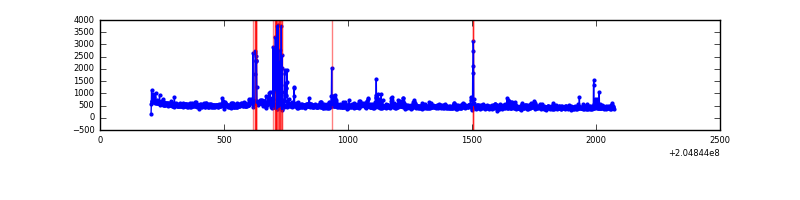 |
Top three noisy pixels from each quadrant. If the there are fewer than three noisy pixels in the level2.evt file, extra rows are filled as -1
| Pixel properties | Quadrant properties | ||||||
|---|---|---|---|---|---|---|---|
| Quadrant | DetID | PixID | Counts | Sigma | Mean | Median | Sigma |
| A | 0 | 50 | 1099964 | 26618.52 | 195 | 191 | 41.3 |
| A | 0 | 226 | 2235 | 49.47 | 195 | 191 | 41.3 |
| A | 12 | 194 | 2003 | 43.86 | 195 | 191 | 41.3 |
| B | 15 | 204 | 53840 | 1126.53 | 241 | 235 | 47.6 |
| B | 10 | 249 | 22797 | 474.15 | 241 | 235 | 47.6 |
| B | 4 | 81 | 19710 | 409.28 | 241 | 235 | 47.6 |
| C | 13 | 61 | 1868 | 30.06 | 228 | 229 | 54.5 |
| C | 10 | 65 | 1688 | 26.76 | 228 | 229 | 54.5 |
| C | 12 | 4 | 1187 | 17.57 | 228 | 229 | 54.5 |
| D | 2 | 122 | 92794 | 1675.33 | 224 | 218 | 55.3 |
| D | 10 | 172 | 22803 | 408.72 | 224 | 218 | 55.3 |
| D | 2 | 232 | 15452 | 275.69 | 224 | 218 | 55.3 |
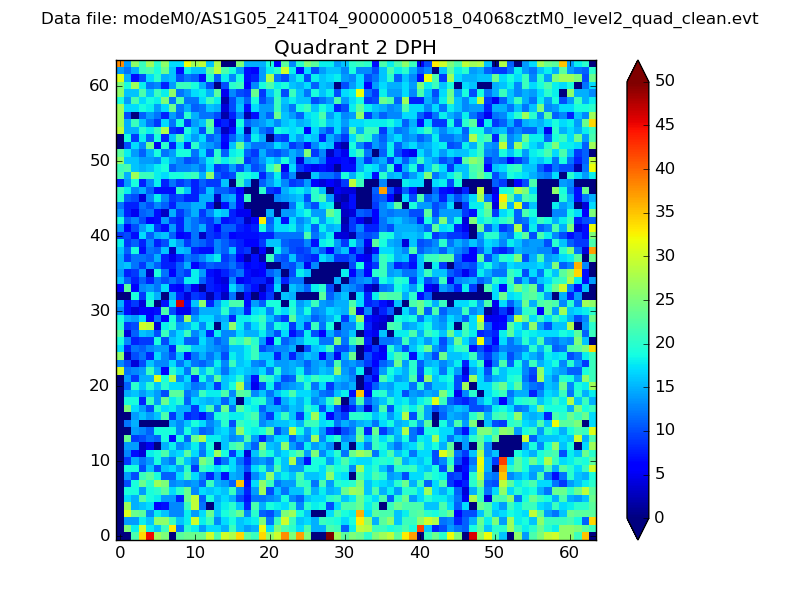
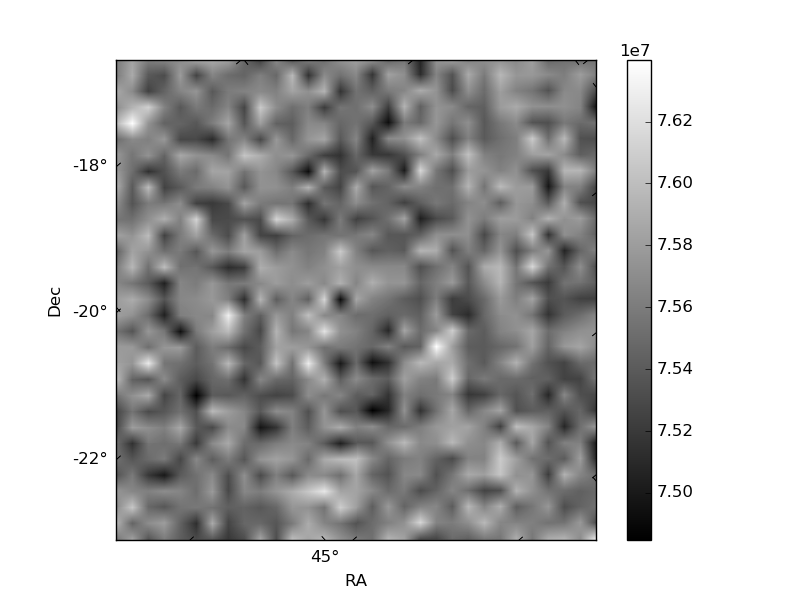
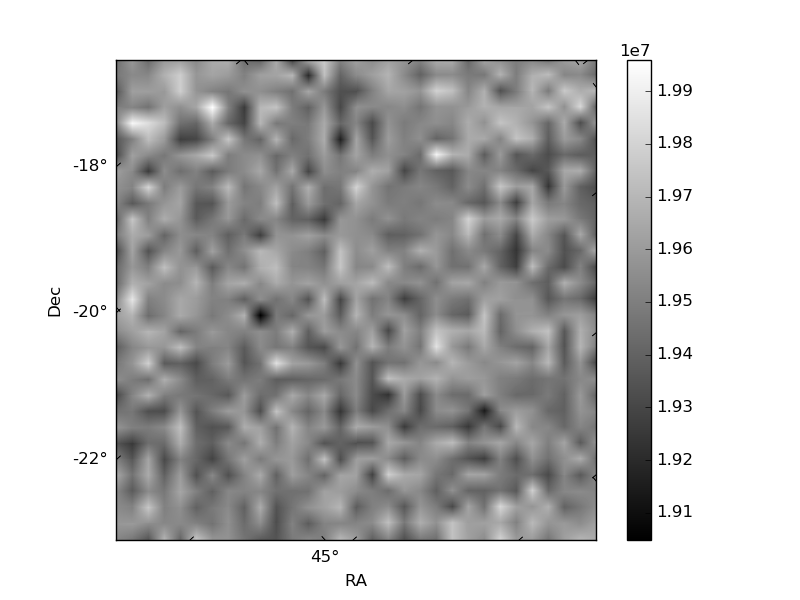
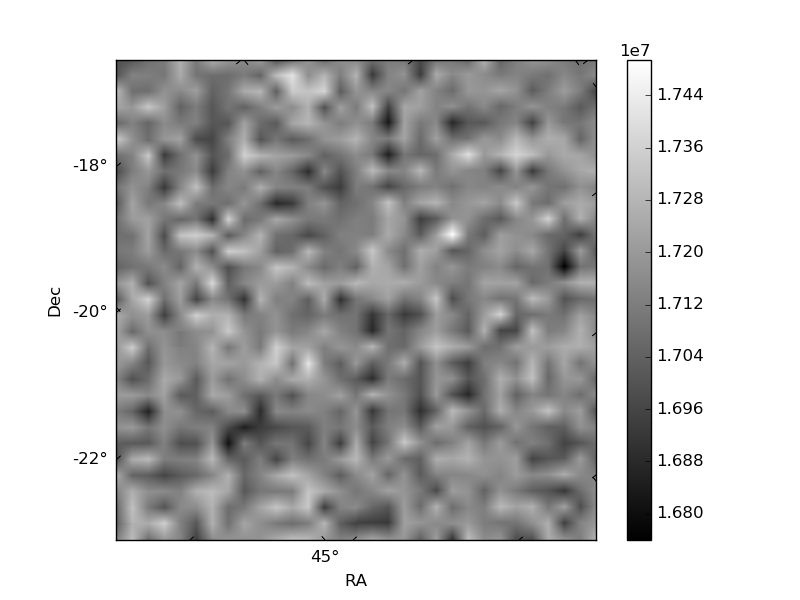
Histogram calculated using DETX and DETY for each event in the final _common_clean file
| Quadrant A | 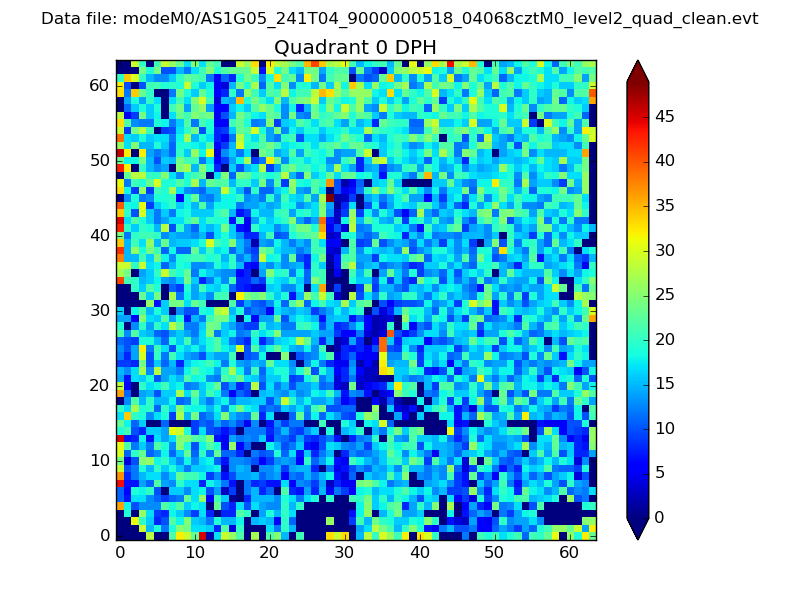 |
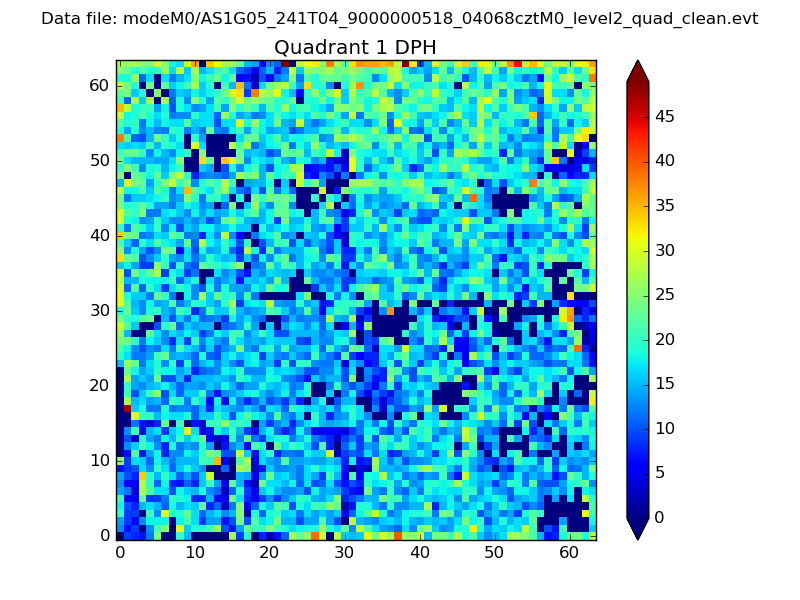 |
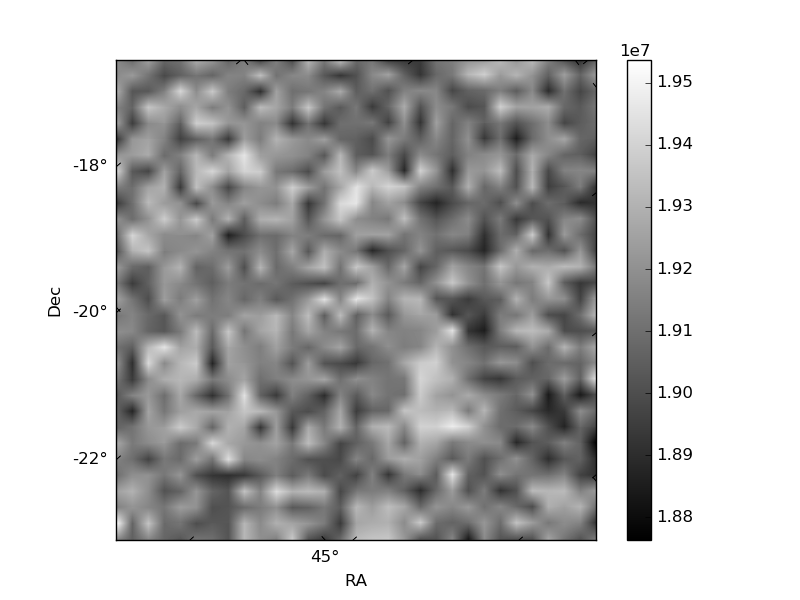
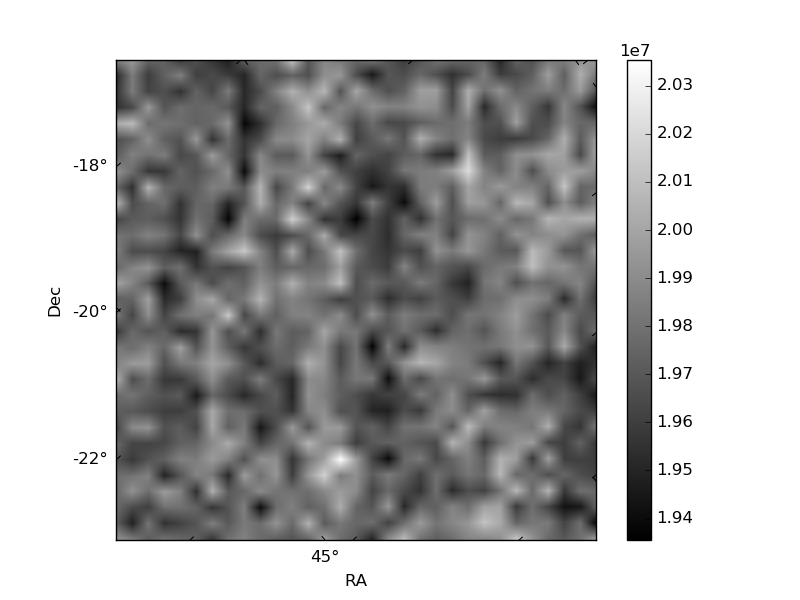
Quadrant B |
|---|---|---|---|
| Quadrant D | 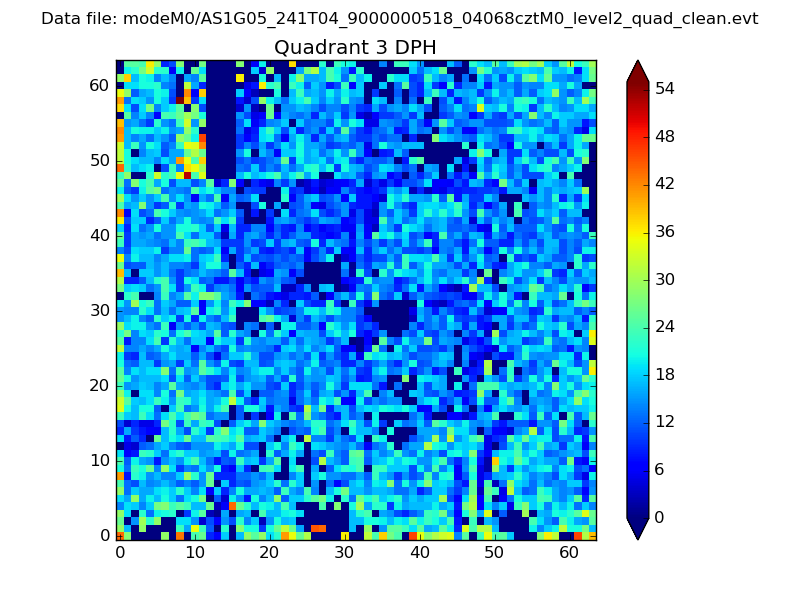 |
 |
Quadrant C |
| Plot type | Count rate plots | Images |
|---|---|---|
| Comparison with Poisson distribution Blue bars denote a histogram of data divided into 1 sec bins. Red curve is a Poisson curve with rate = median count rate of data. |
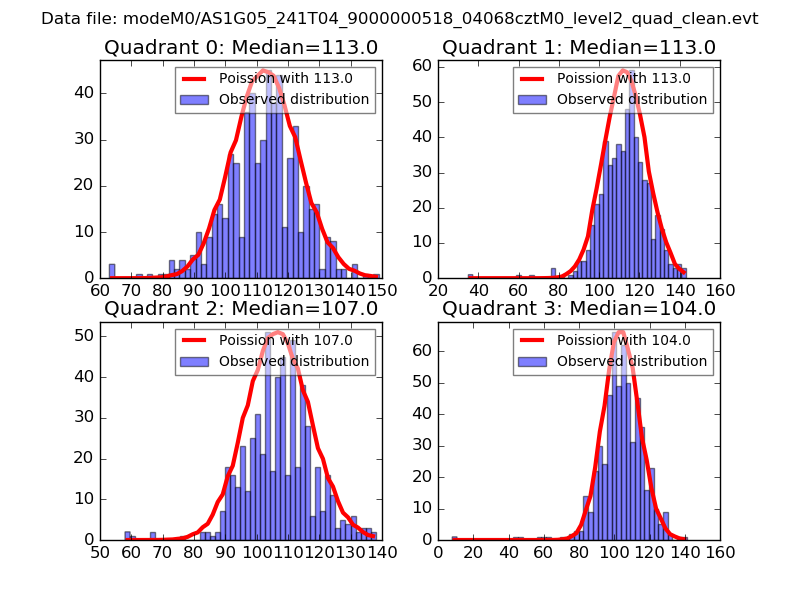 |
 |
| Quadrant-wise count rates Data is divided into 100 sec bins |
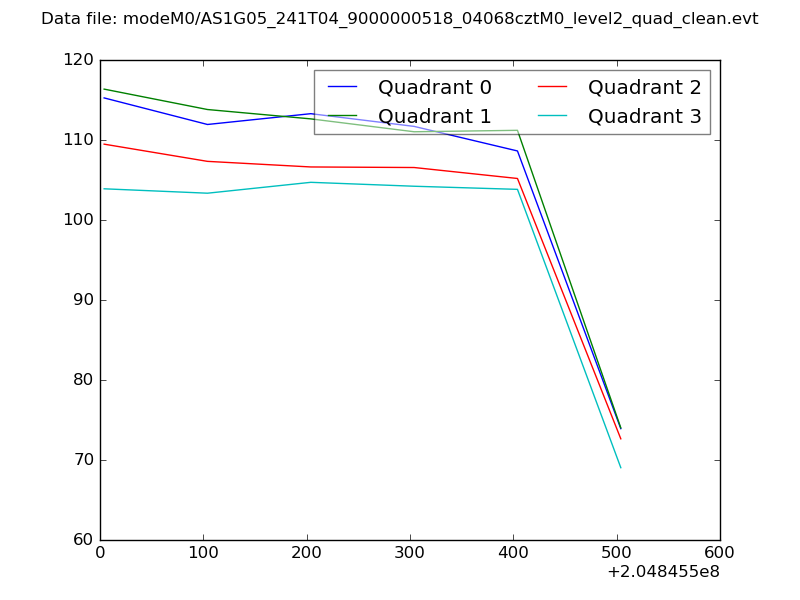 |
|
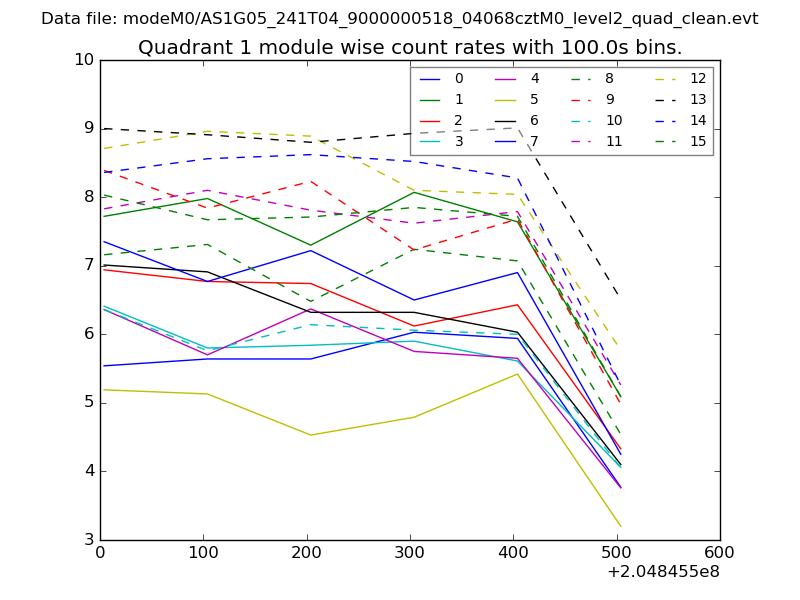
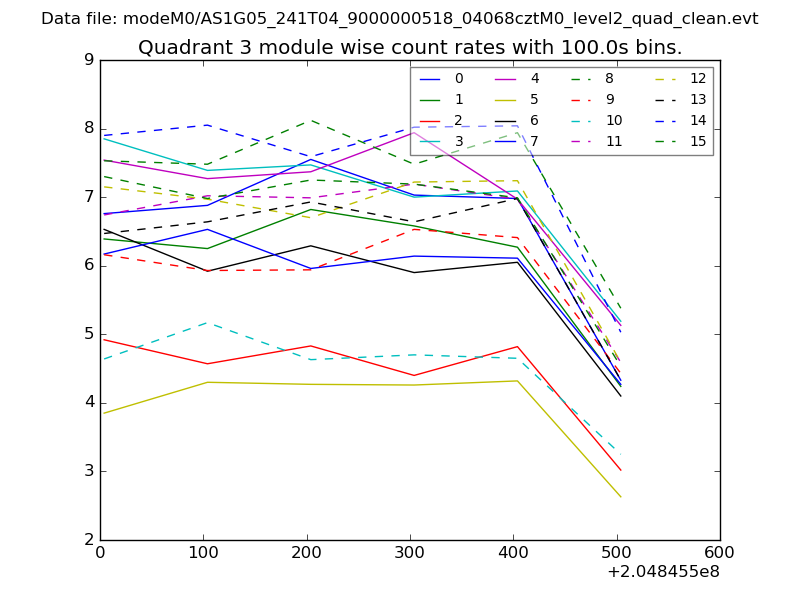
| Module-wise count rates for Quadrant A Data is divided into 100 sec bins |
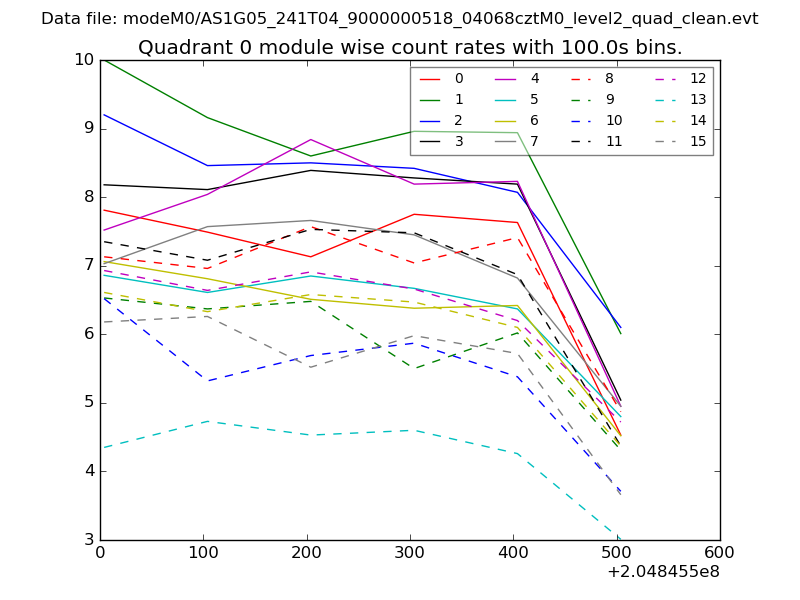 |
 |
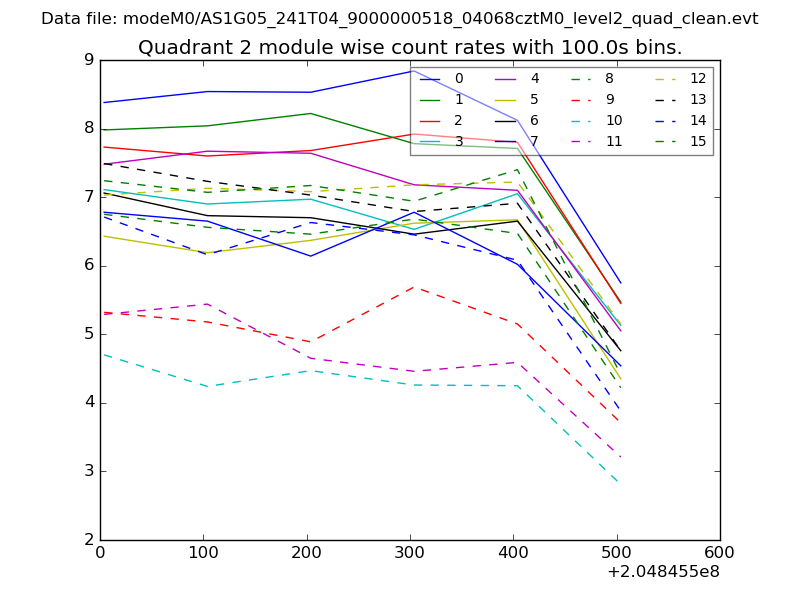
| Module-wise count rates for Quadrant B Data is divided into 100 sec bins |
 |
 |
| Module-wise count rates for Quadrant C Data is divided into 100 sec bins |
 |
 |
| Module-wise count rates for Quadrant D Data is divided into 100 sec bins |
 |
 |
| Parameter | Plot |
|---|---|
| CZT HV Monitor | 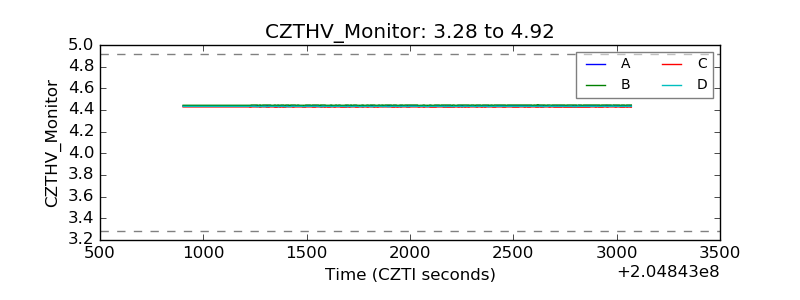 |
| D_VDD | 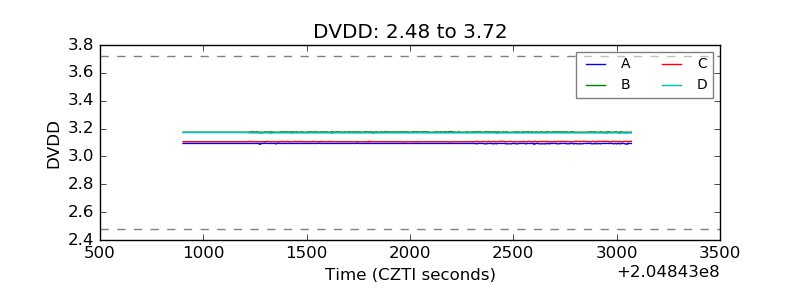 |
| Temperature 1 | 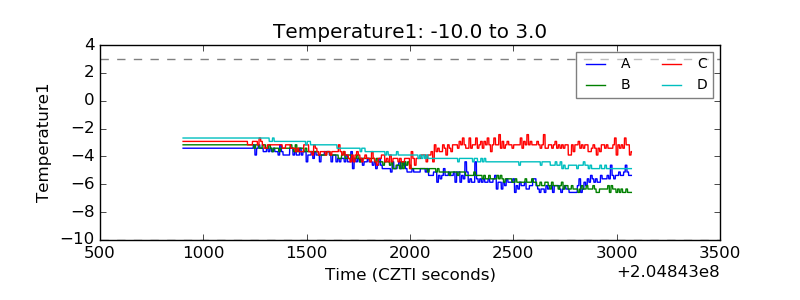 |
| Veto HV Monitor |  |
| Veto LLD | 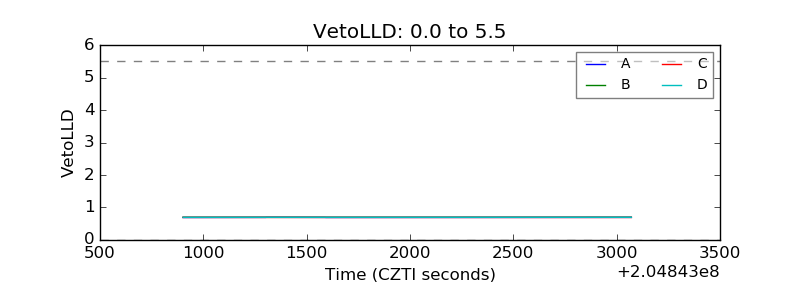 |
| Alpha Counter | 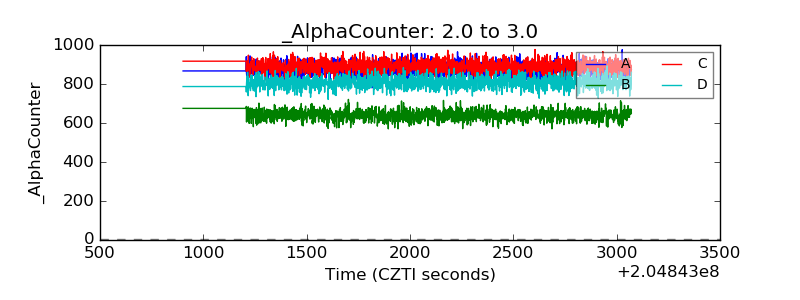 |
| _CPM_Rate | 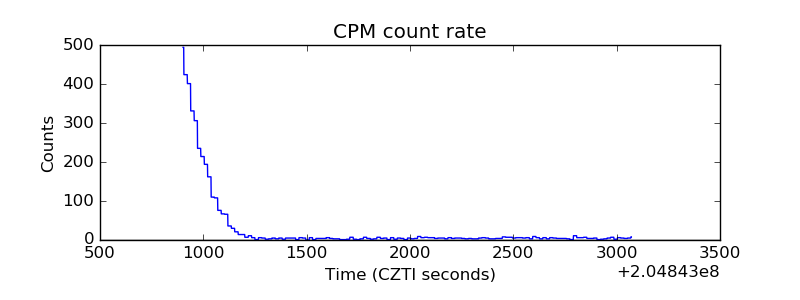 |
| CZT Counter | 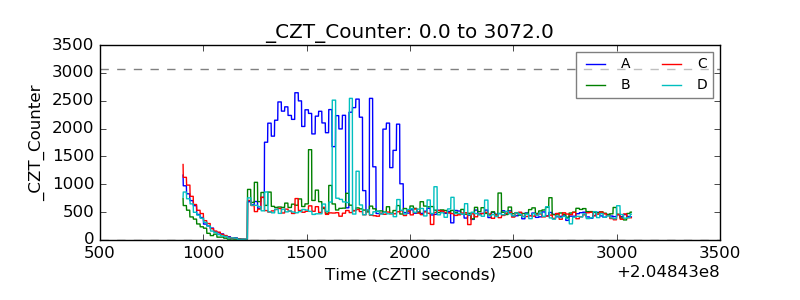 |
| +2.5 Volts monitor |  |
| +5 Volts monitor |  |
| _ROLL_ROT | 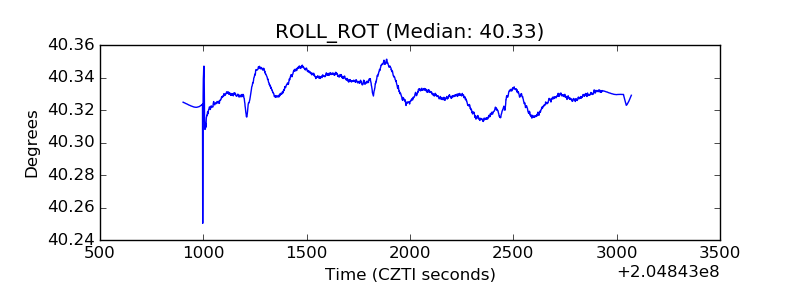 |
| _Roll_DEC | 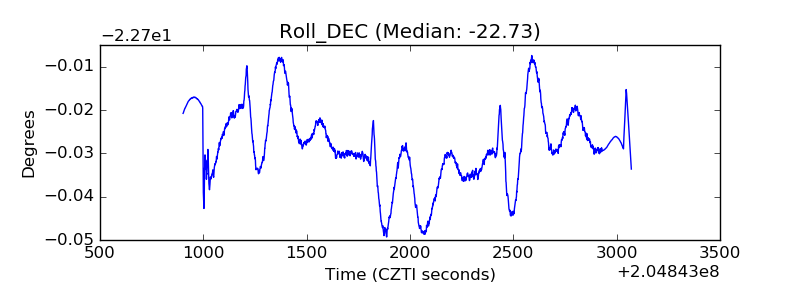 |
| _Roll_RA | 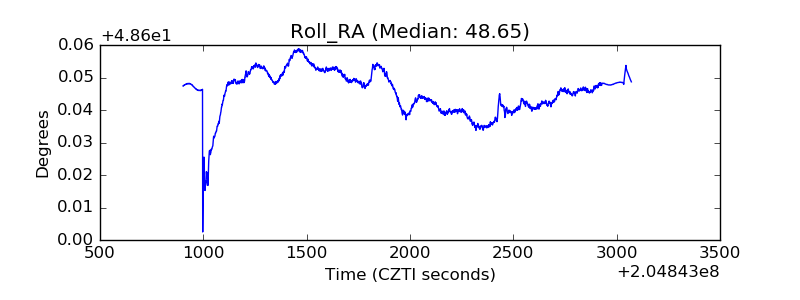 |
| Veto Counter | 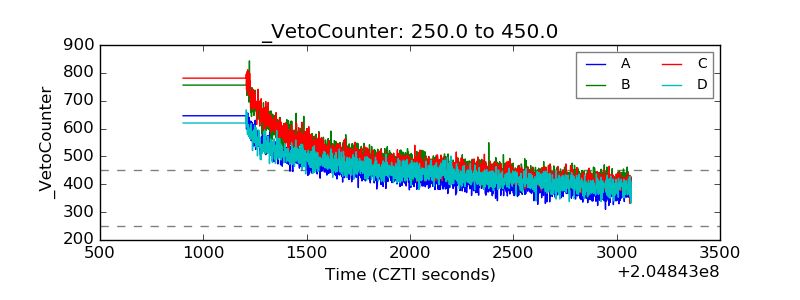 |