| Param | Original file | Final file |
|---|---|---|
| Filename | modeM0/AS1G05_222T01_9000000520cztM0_level2.fits | modeM0/AS1G05_222T01_9000000520cztM0_level2_quad_clean.evt |
| Size (bytes) | 1,188,060,480 | 1,182,130,560 |
| Size | 1.1 GB | 1.1 GB |
| Events in quadrant A | 7,123,924 | 7,113,750 |
| Events in quadrant B | 6,860,582 | 7,076,726 |
| Events in quadrant C | 6,922,500 | 6,364,864 |
| Events in quadrant D | 6,063,308 | 6,244,581 |
| Mode M9 | |||
|---|---|---|---|
| Quadrant | BADHDUFLAG | Total packets | Discarded packets |
| A | 0 | 180 | 0 |
| B | 0 | 180 | 0 |
| C | 0 | 180 | 0 |
| D | 0 | 180 | 0 |
| Mode SS | |||
|---|---|---|---|
| Quadrant | BADHDUFLAG | Total packets | Discarded packets |
| A | 0 | 2674 | 0 |
| B | 0 | 2678 | 0 |
| C | 0 | 2678 | 0 |
| D | 0 | 2681 | 0 |
| Mode M0 | |||
|---|---|---|---|
| Quadrant | BADHDUFLAG | Total packets | Discarded packets |
| A | 0 | 283883 | 0 |
| B | 0 | 297527 | 0 |
| C | 0 | 329676 | 0 |
| D | 0 | 299737 | 0 |
| Quadrant | Total seconds | Saturated seconds | Saturation percentage |
|---|---|---|---|
| A | 131418 | 2789 | 2.122236% |
| B | 131304 | 3819 | 2.908518% |
| C | 131401 | 9160 | 6.971028% |
| D | 131279 | 3624 | 2.760533% |
Noise dominated data is calculated using 1-second bins in cleaned event files. If a bin has >2000 counts, and if more than 50% of those come from <1% of pixels, then it is considered to be noise-dominated and hence unusable.
| Quadrant | # 1 sec bins | Bins with >0 counts | Bins with >2000 counts | High rate bins dominated by noise | Noise dominated (total time) | Noise dominated (detector-on time) | Marked lightcurve |
|---|---|---|---|---|---|---|---|
| A | 150465 | 132043 | 0 | 0 | 0.00% | 0.00% | 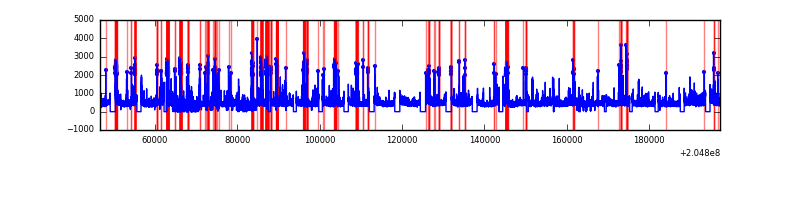 |
| B | 150466 | 131963 | 0 | 0 | 0.00% | 0.00% | 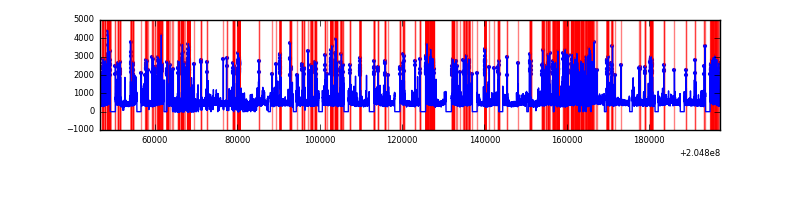 |
| C | 150465 | 132055 | 0 | 0 | 0.00% | 0.00% | 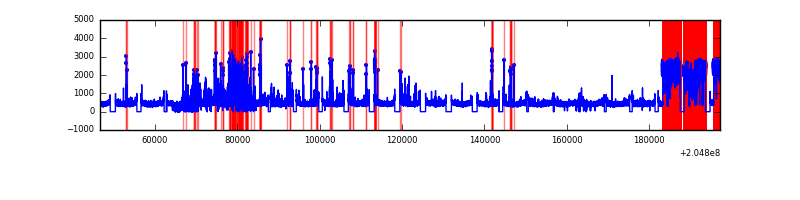 |
| D | 150465 | 131960 | 0 | 0 | 0.00% | 0.00% | 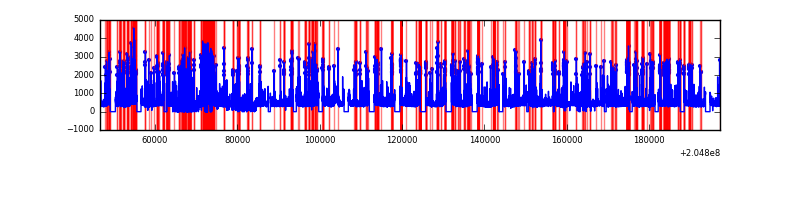 |
Top three noisy pixels from each quadrant. If the there are fewer than three noisy pixels in the level2.evt file, extra rows are filled as -1
| Pixel properties | Quadrant properties | ||||||
|---|---|---|---|---|---|---|---|
| Quadrant | DetID | PixID | Counts | Sigma | Mean | Median | Sigma |
| A | 0 | 29 | 6931 | 10.81 | 1852 | 1717 | 482.3 |
| A | 7 | 110 | 6119 | 9.13 | 1852 | 1717 | 482.3 |
| A | 9 | 19 | 5425 | 7.69 | 1852 | 1717 | 482.3 |
| B | 2 | 9 | 5768 | 10.88 | 1815 | 1716 | 372.3 |
| B | 12 | 226 | 5021 | 8.88 | 1815 | 1716 | 372.3 |
| B | 14 | 254 | 4855 | 8.43 | 1815 | 1716 | 372.3 |
| C | 1 | 80 | 5112 | 7.07 | 1824 | 1679 | 485.4 |
| C | 12 | 241 | 4920 | 6.68 | 1824 | 1679 | 485.4 |
| C | 1 | 81 | 4822 | 6.48 | 1824 | 1679 | 485.4 |
| D | 11 | 82 | 5203 | 7.8 | 1730 | 1566 | 466.1 |
| D | 3 | 14 | 4656 | 6.63 | 1730 | 1566 | 466.1 |
| D | 7 | 5 | 4424 | 6.13 | 1730 | 1566 | 466.1 |
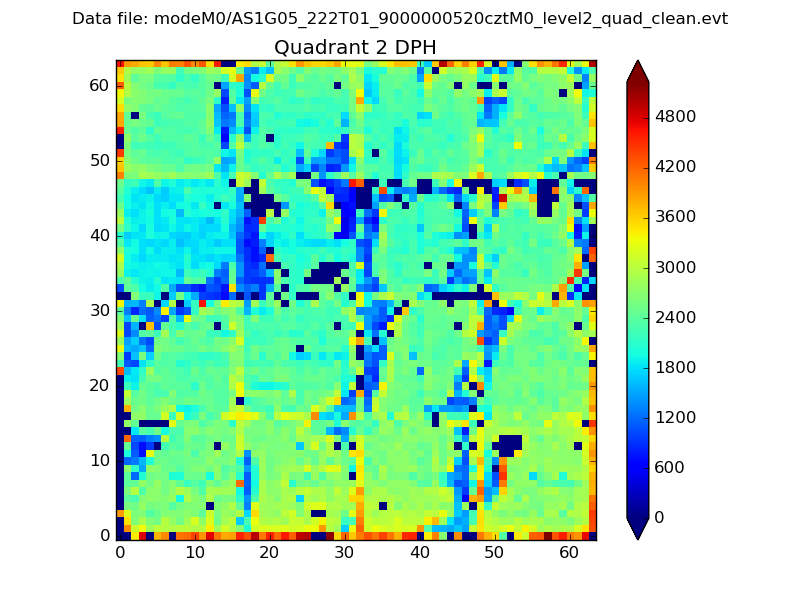
Histogram calculated using DETX and DETY for each event in the final _common_clean file
| Quadrant A | 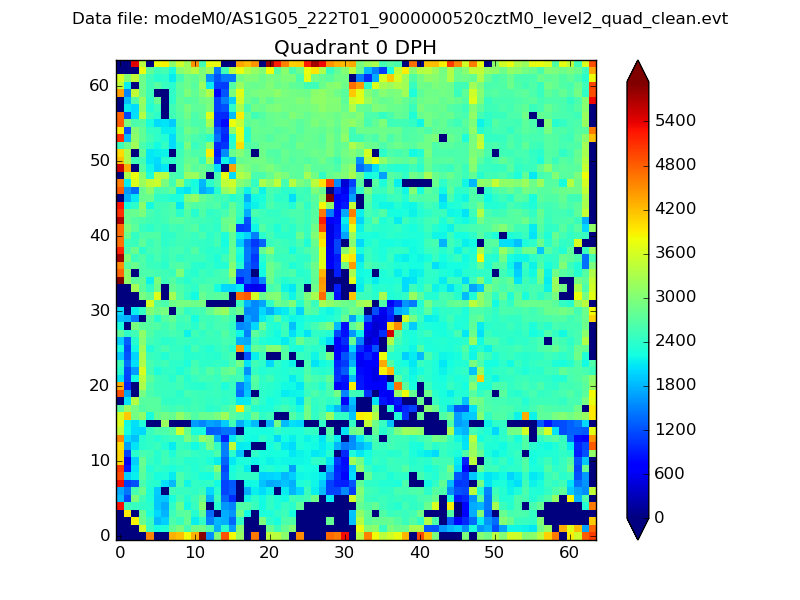 |
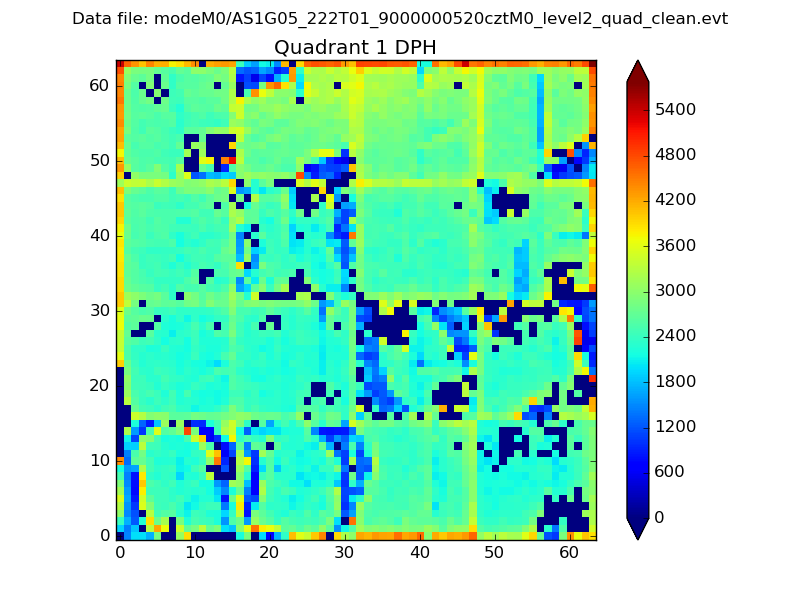 |
Quadrant B |
|---|---|---|---|
| Quadrant D | 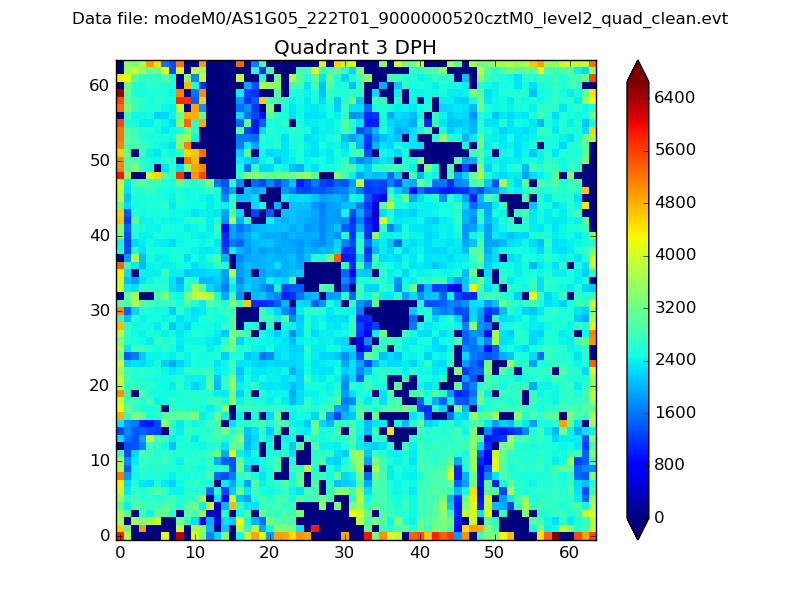 |
 |
Quadrant C |
| Plot type | Count rate plots | Images |
|---|---|---|
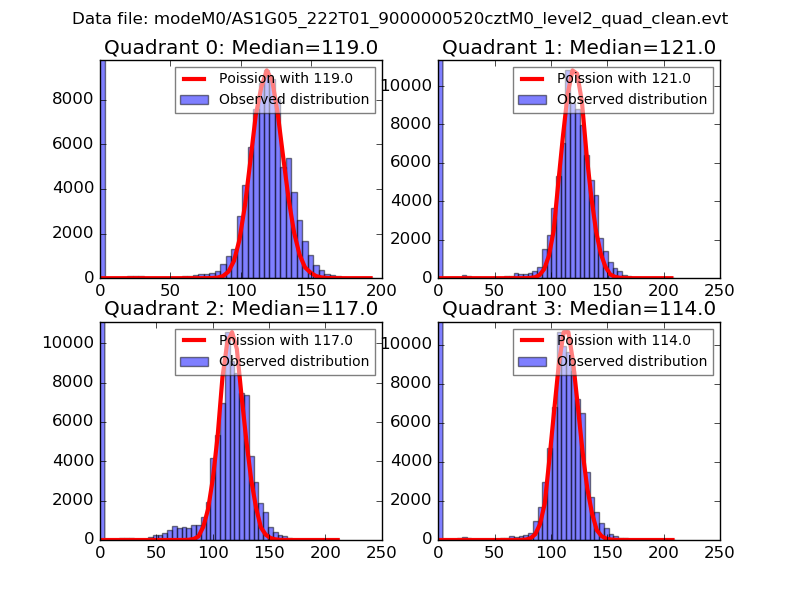
| Comparison with Poisson distribution Blue bars denote a histogram of data divided into 1 sec bins. Red curve is a Poisson curve with rate = median count rate of data. |
 |
 |
| Quadrant-wise count rates Data is divided into 100 sec bins |
 |
|
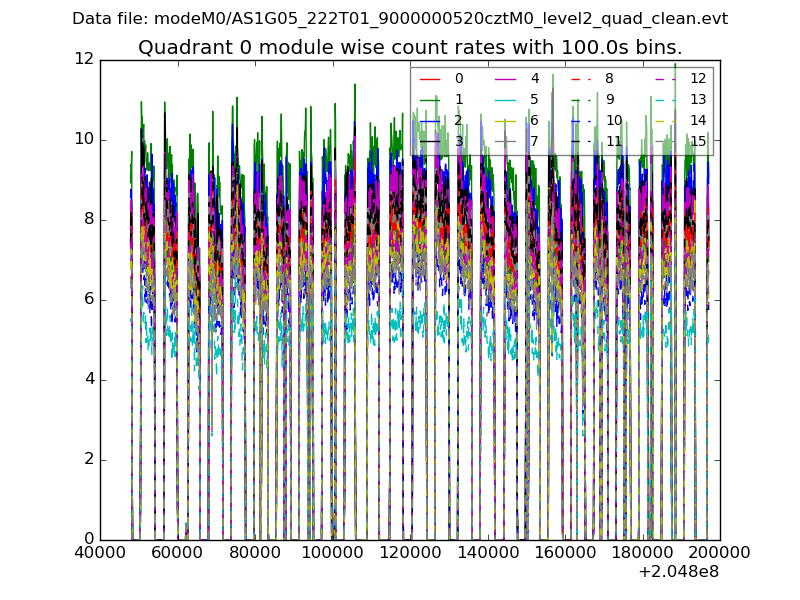
| Module-wise count rates for Quadrant A Data is divided into 100 sec bins |
 |
 |
| Module-wise count rates for Quadrant B Data is divided into 100 sec bins |
 |
 |
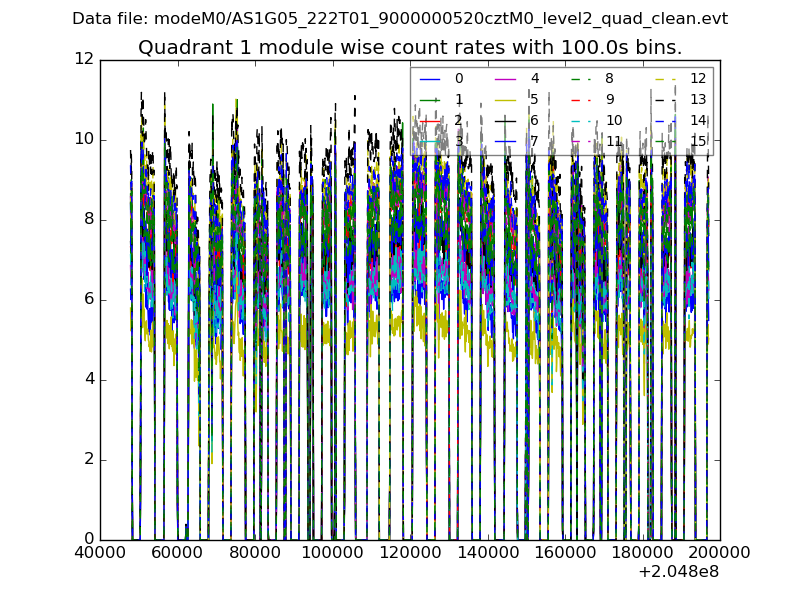
| Module-wise count rates for Quadrant C Data is divided into 100 sec bins |
 |
 |
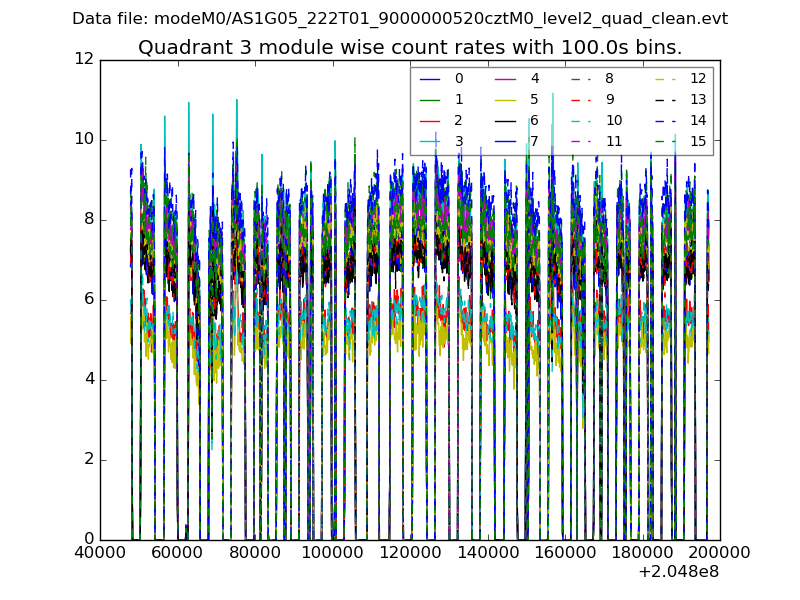
| Module-wise count rates for Quadrant D Data is divided into 100 sec bins |
 |
 |
| Parameter | Plot |
|---|---|
| CZT HV Monitor | 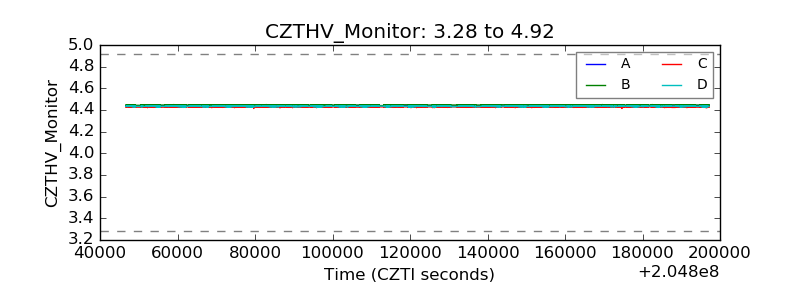 |
| D_VDD | 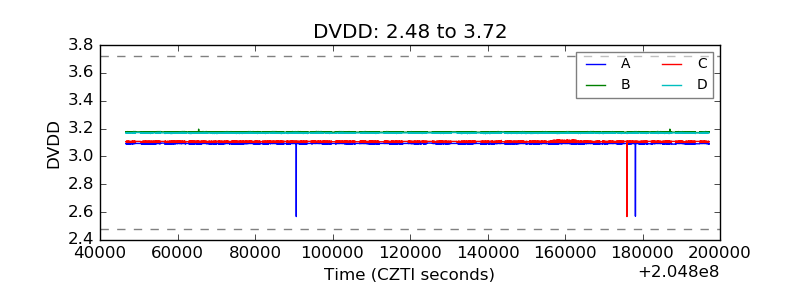 |
| Temperature 1 | 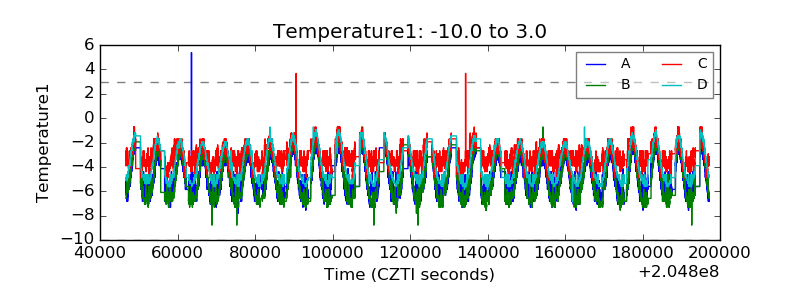 |
| Veto HV Monitor | 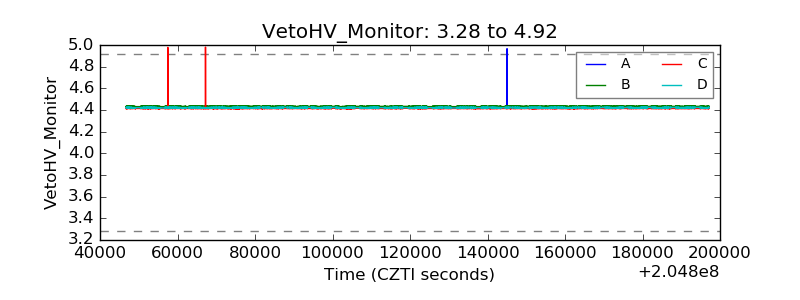 |
| Veto LLD | 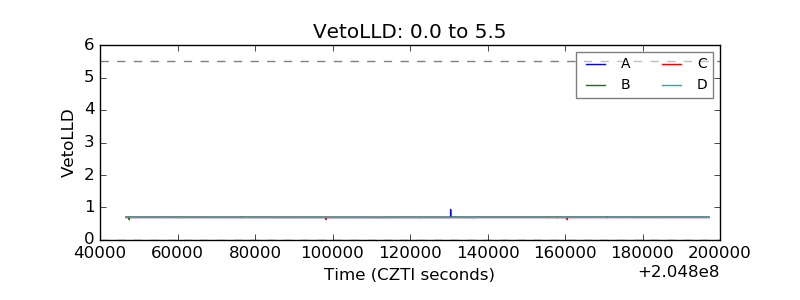 |
| Alpha Counter | 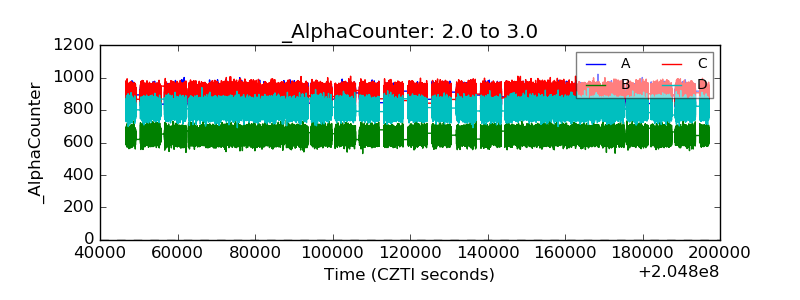 |
| _CPM_Rate | 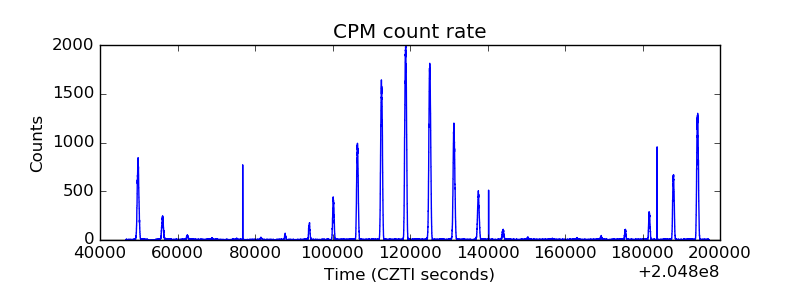 |
| CZT Counter | 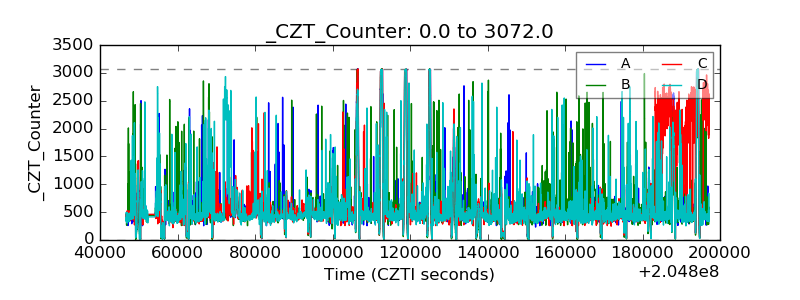 |
| +2.5 Volts monitor | 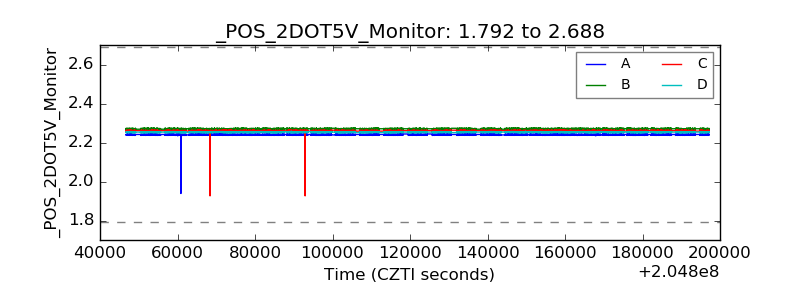 |
| +5 Volts monitor | 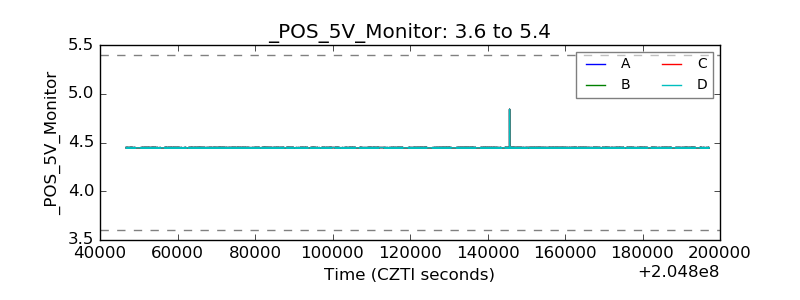 |
| _ROLL_ROT | 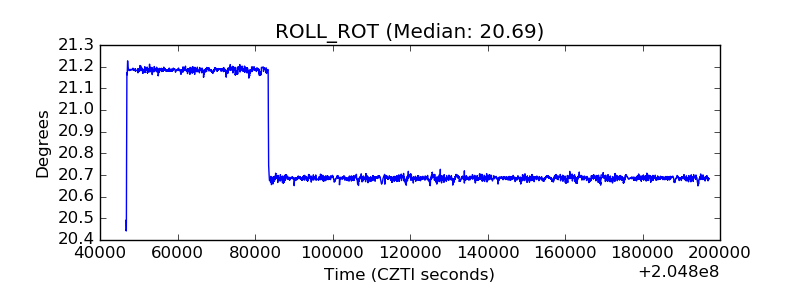 |
| _Roll_DEC | 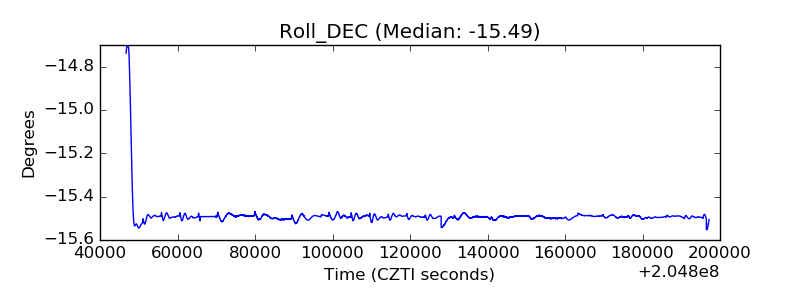 |
| _Roll_RA | 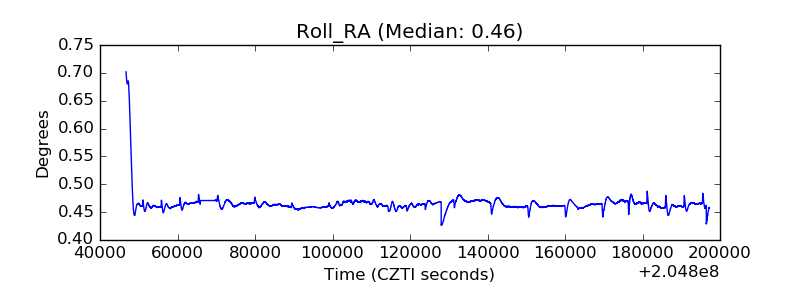 |
| Veto Counter | 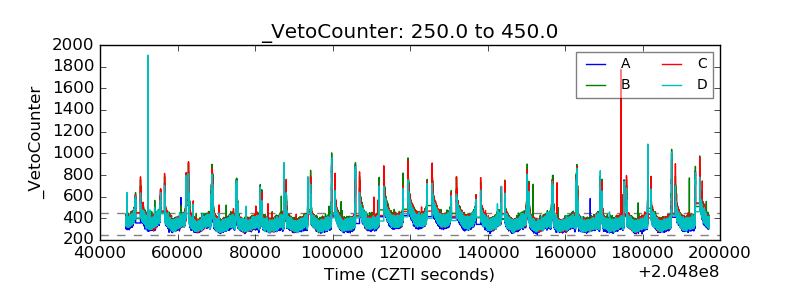 |