| Param | Original file | Final file |
|---|---|---|
| Filename | modeM0/AS1G05_222T01_9000000520_04069cztM0_level2.evt | modeM0/AS1G05_222T01_9000000520_04069cztM0_level2_quad_clean.evt |
| Size (bytes) | 458,519,040 | 82,725,120 |
| Size | 437.3 MB | 78.9 MB |
| Events in quadrant A | 3,482,127 | 515,463 |
| Events in quadrant B | 3,353,885 | 526,394 |
| Events in quadrant C | 2,971,778 | 517,372 |
| Events in quadrant D | 3,638,900 | 494,579 |
| Mode M9 | |||
|---|---|---|---|
| Quadrant | BADHDUFLAG | Total packets | Discarded packets |
| A | 0 | 17 | 0 |
| B | 0 | 17 | 0 |
| C | 0 | 17 | 0 |
| D | 0 | 18 | 0 |
| Mode SS | |||
|---|---|---|---|
| Quadrant | BADHDUFLAG | Total packets | Discarded packets |
| A | 0 | 132 | 0 |
| B | 0 | 132 | 0 |
| C | 0 | 132 | 0 |
| D | 0 | 132 | 0 |
| Mode M0 | |||
|---|---|---|---|
| Quadrant | BADHDUFLAG | Total packets | Discarded packets |
| A | 0 | 14732 | 7 |
| B | 0 | 14350 | 6 |
| C | 0 | 13314 | 2 |
| D | 0 | 15569 | 2 |
| Quadrant | Total seconds | Saturated seconds | Saturation percentage |
|---|---|---|---|
| A | 6465 | 190 | 2.938902% |
| B | 6465 | 86 | 1.330240% |
| C | 6467 | 36 | 0.556672% |
| D | 6467 | 135 | 2.087521% |
Noise dominated data is calculated using 1-second bins in cleaned event files. If a bin has >2000 counts, and if more than 50% of those come from <1% of pixels, then it is considered to be noise-dominated and hence unusable.
| Quadrant | # 1 sec bins | Bins with >0 counts | Bins with >2000 counts | High rate bins dominated by noise | Noise dominated (total time) | Noise dominated (detector-on time) | Marked lightcurve |
|---|---|---|---|---|---|---|---|
| A | 7482 | 6468 | 108 | 108 | 1.44% | 1.67% | 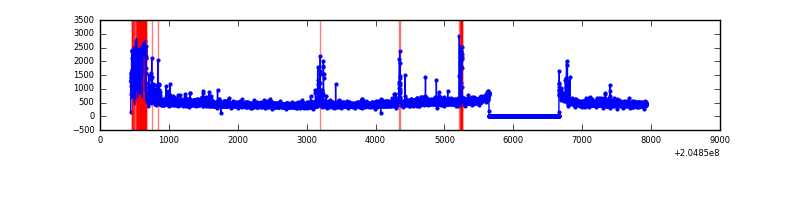 |
| B | 7482 | 6468 | 27 | 27 | 0.36% | 0.42% | 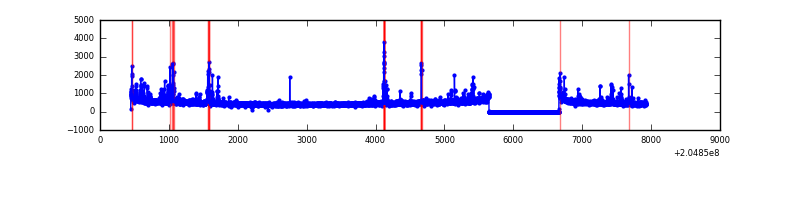 |
| C | 7482 | 6468 | 3 | 3 | 0.04% | 0.05% | 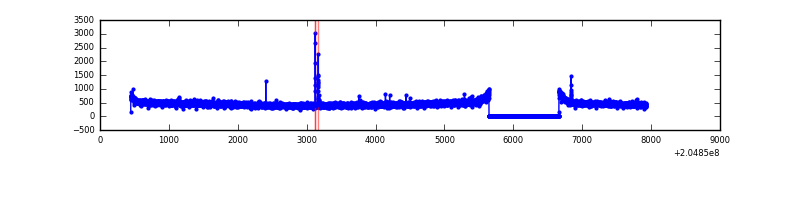 |
| D | 7482 | 6467 | 89 | 89 | 1.19% | 1.38% | 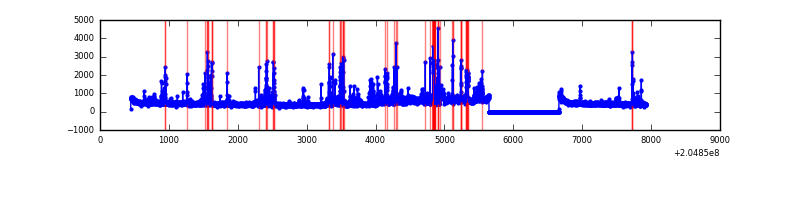 |
Top three noisy pixels from each quadrant. If the there are fewer than three noisy pixels in the level2.evt file, extra rows are filled as -1
| Pixel properties | Quadrant properties | ||||||
|---|---|---|---|---|---|---|---|
| Quadrant | DetID | PixID | Counts | Sigma | Mean | Median | Sigma |
| A | 0 | 50 | 395937 | 2558.9 | 754 | 737 | 154.4 |
| A | 8 | 15 | 165518 | 1066.95 | 754 | 737 | 154.4 |
| A | 0 | 226 | 8355 | 49.32 | 754 | 737 | 154.4 |
| B | 14 | 167 | 119428 | 793.25 | 776 | 758 | 149.6 |
| B | 10 | 16 | 71439 | 472.47 | 776 | 758 | 149.6 |
| B | 15 | 204 | 61285 | 404.59 | 776 | 758 | 149.6 |
| C | 9 | 144 | 22245 | 121.89 | 752 | 755 | 176.3 |
| C | 13 | 61 | 6251 | 31.17 | 752 | 755 | 176.3 |
| C | 12 | 4 | 5968 | 29.57 | 752 | 755 | 176.3 |
| D | 2 | 232 | 430436 | 2380.33 | 738 | 716 | 180.5 |
| D | 10 | 172 | 371921 | 2056.2 | 738 | 716 | 180.5 |
| D | 2 | 14 | 18942 | 100.96 | 738 | 716 | 180.5 |
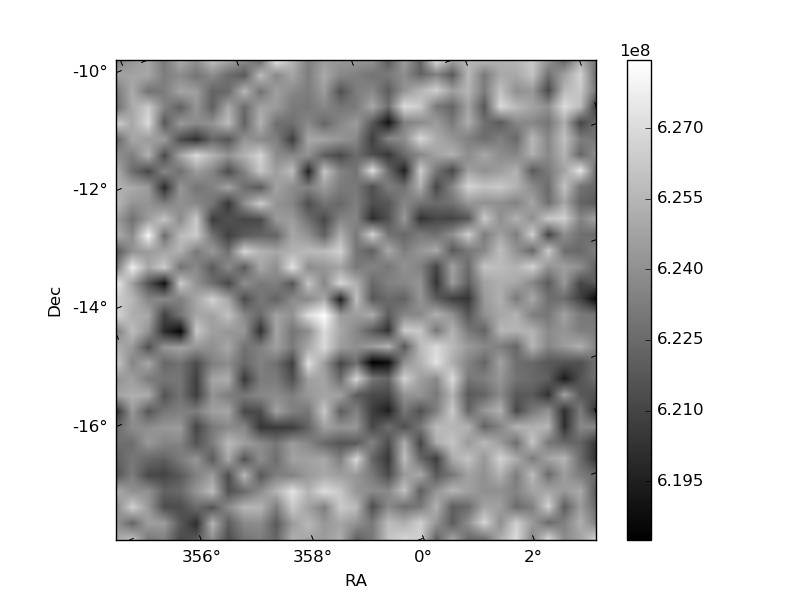
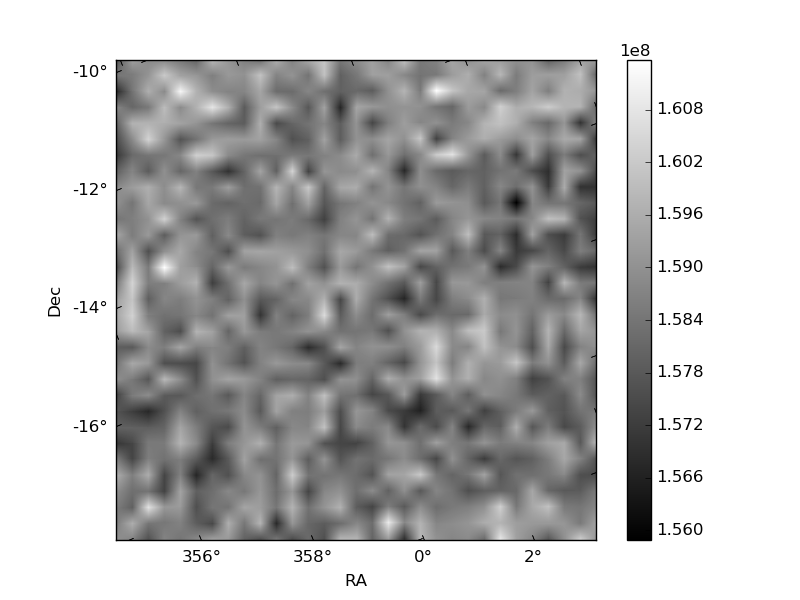
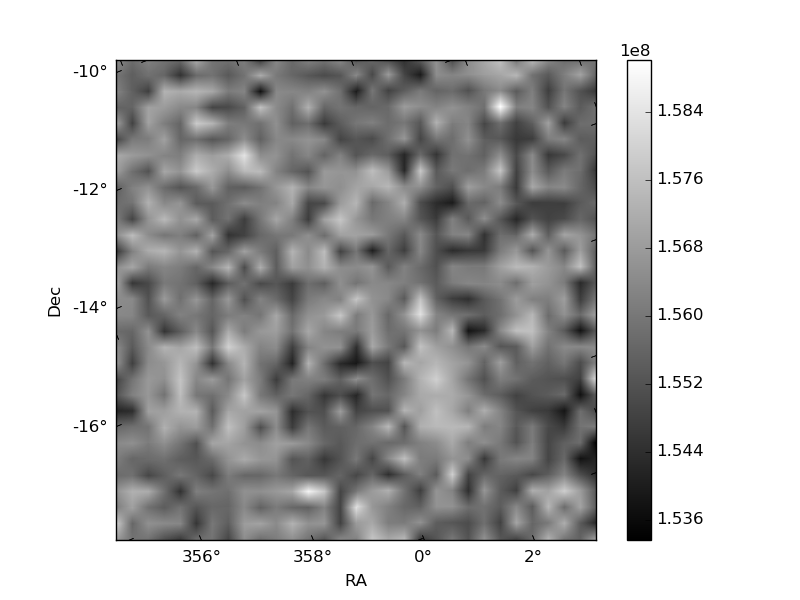
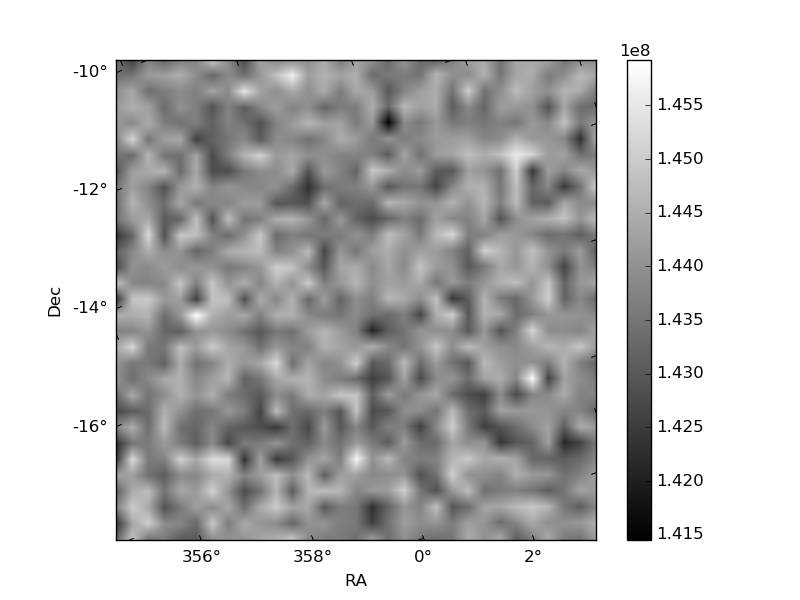
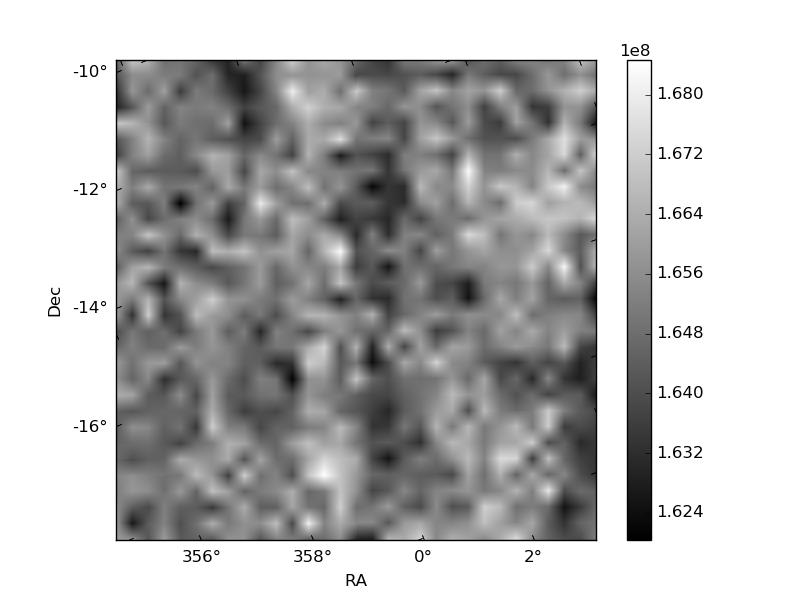
Histogram calculated using DETX and DETY for each event in the final _common_clean file
| Quadrant A | 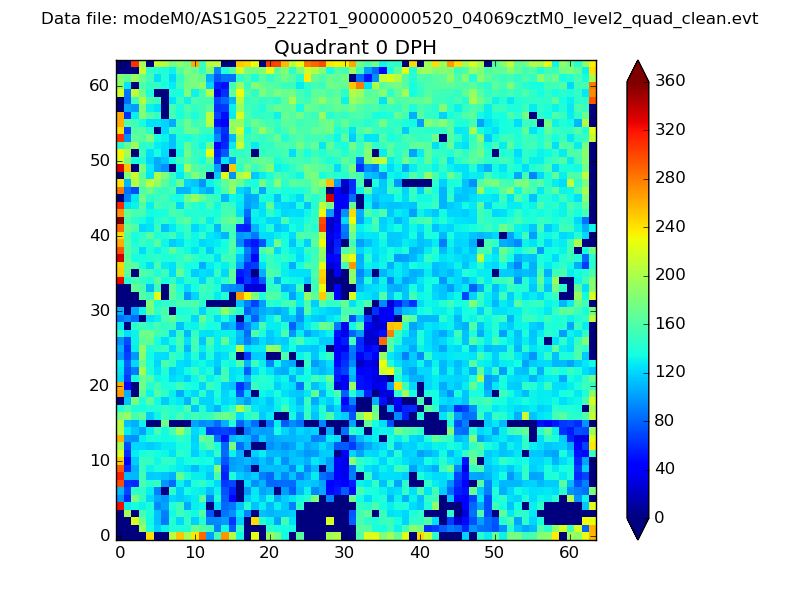 |
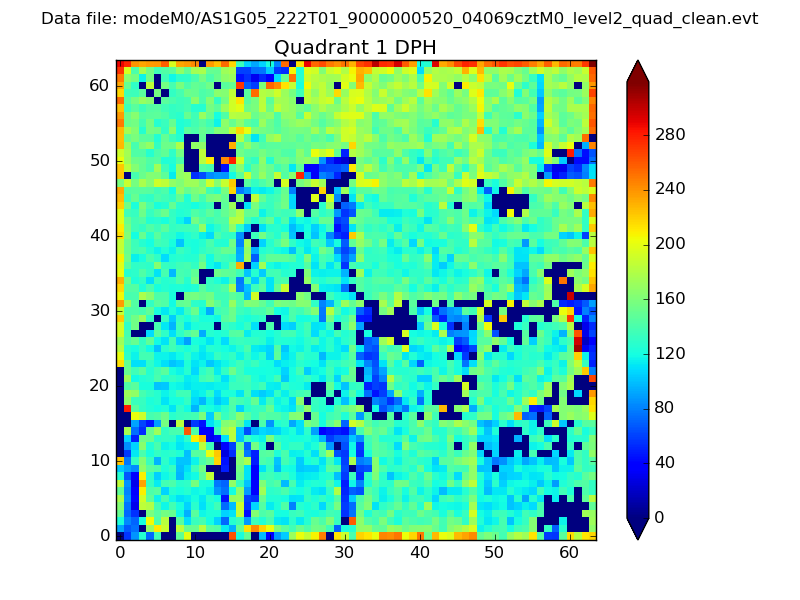 |
Quadrant B |
|---|---|---|---|
| Quadrant D | 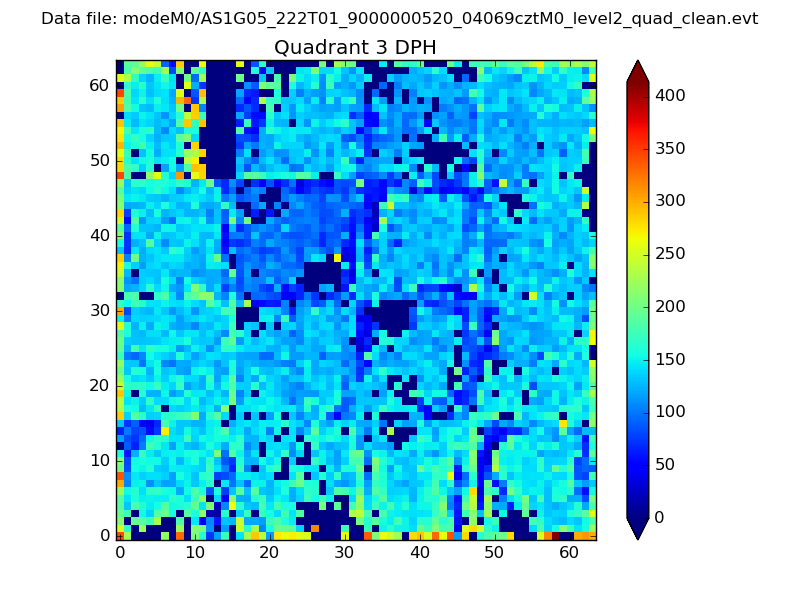 |
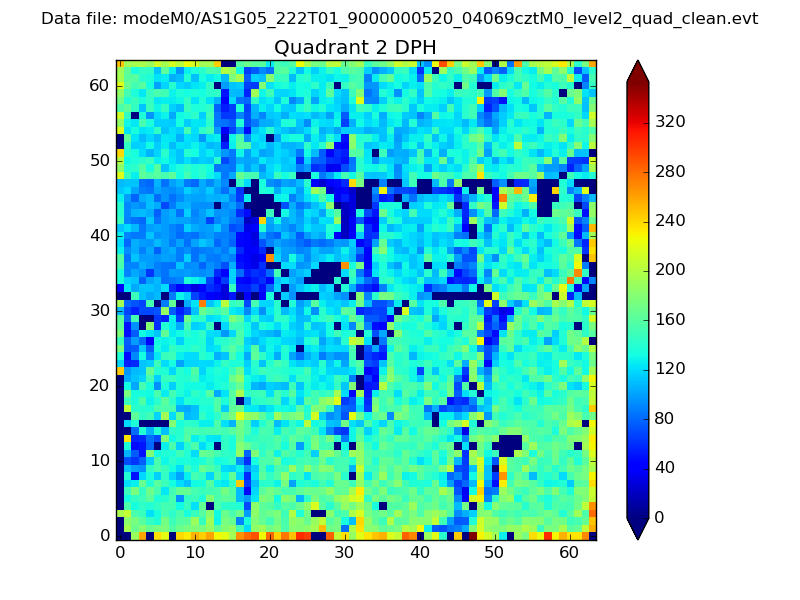 |
Quadrant C |
| Plot type | Count rate plots | Images |
|---|---|---|
| Comparison with Poisson distribution Blue bars denote a histogram of data divided into 1 sec bins. Red curve is a Poisson curve with rate = median count rate of data. |
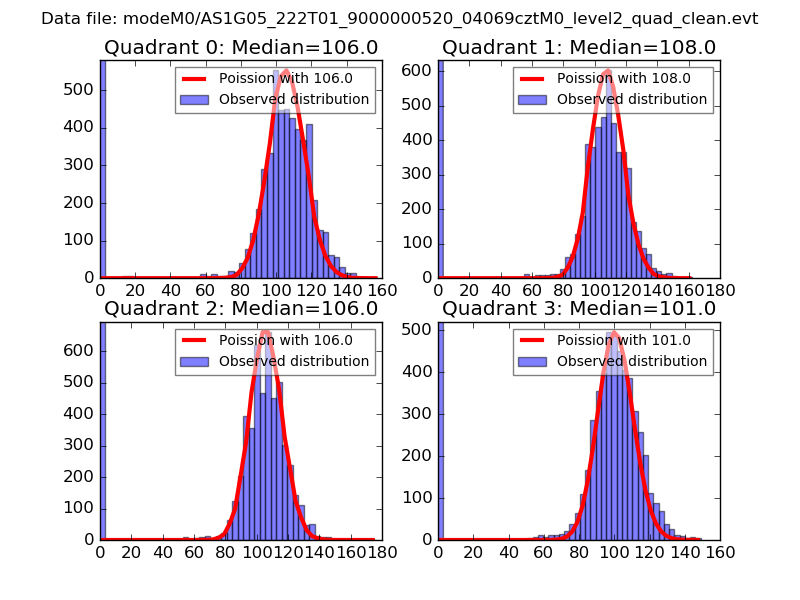 |
 |
| Quadrant-wise count rates Data is divided into 100 sec bins |
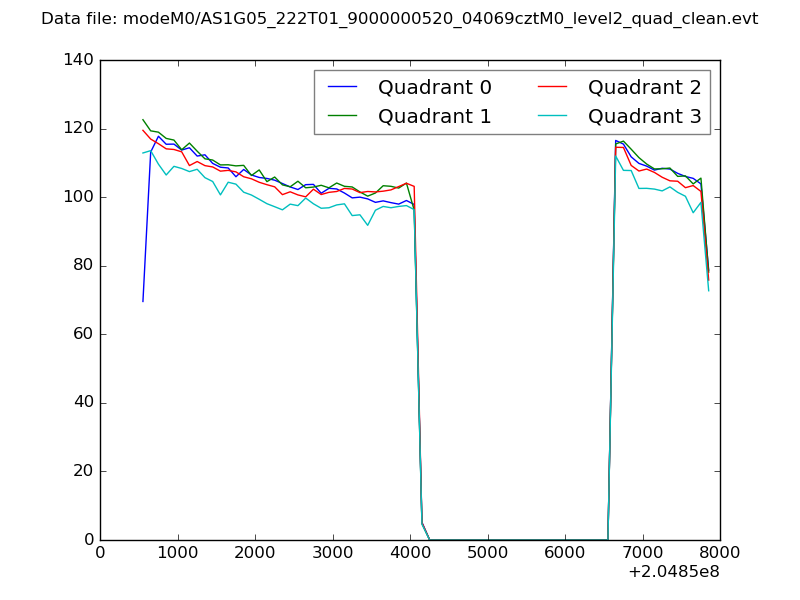 |
|
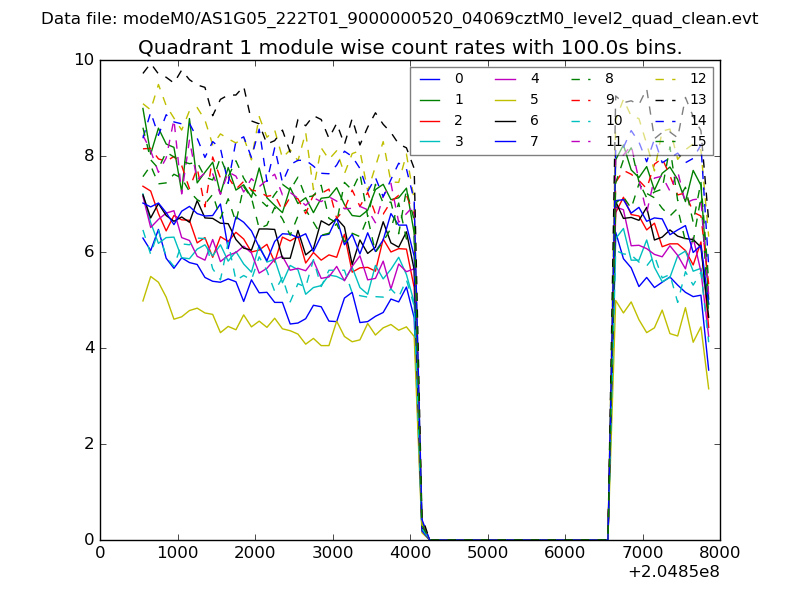
| Module-wise count rates for Quadrant A Data is divided into 100 sec bins |
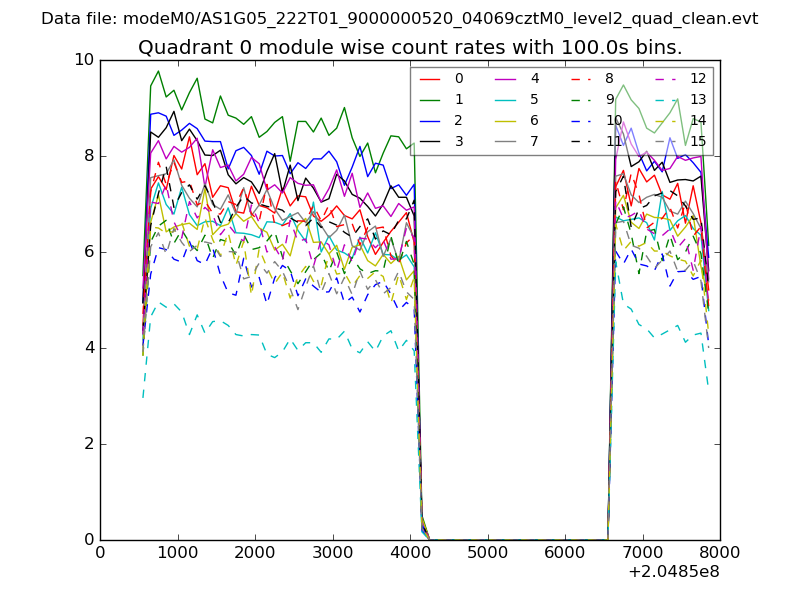 |
 |
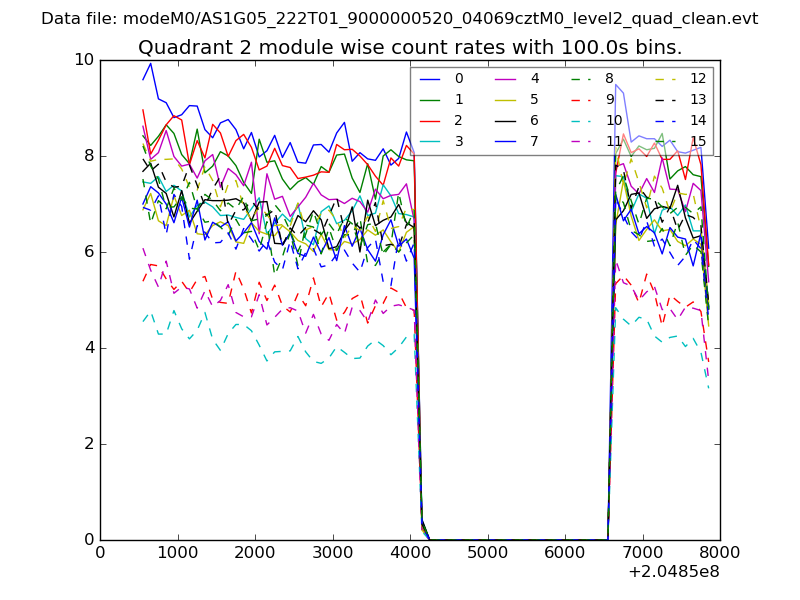
| Module-wise count rates for Quadrant B Data is divided into 100 sec bins |
 |
 |
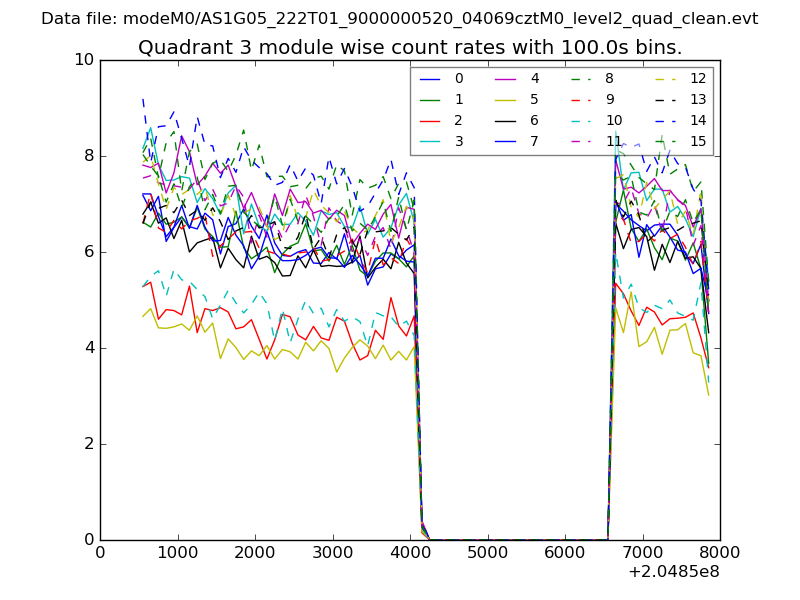
| Module-wise count rates for Quadrant C Data is divided into 100 sec bins |
 |
 |
| Module-wise count rates for Quadrant D Data is divided into 100 sec bins |
 |
 |
| Parameter | Plot |
|---|---|
| CZT HV Monitor | 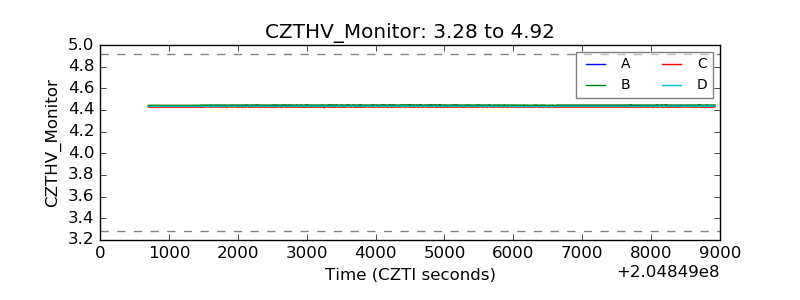 |
| D_VDD |  |
| Temperature 1 | 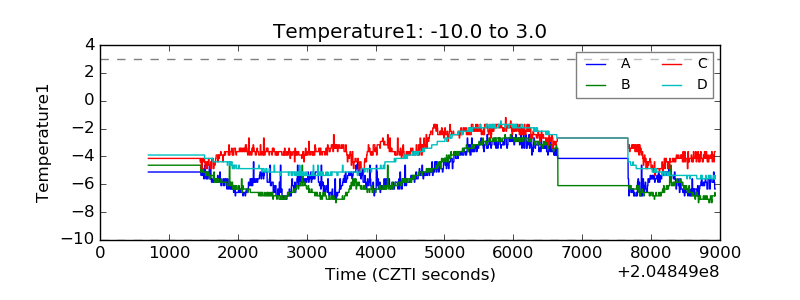 |
| Veto HV Monitor | 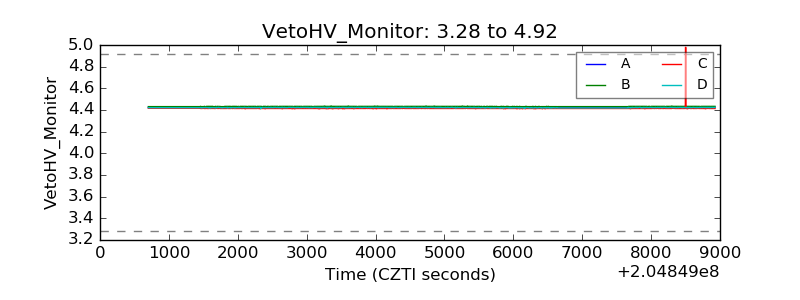 |
| Veto LLD | 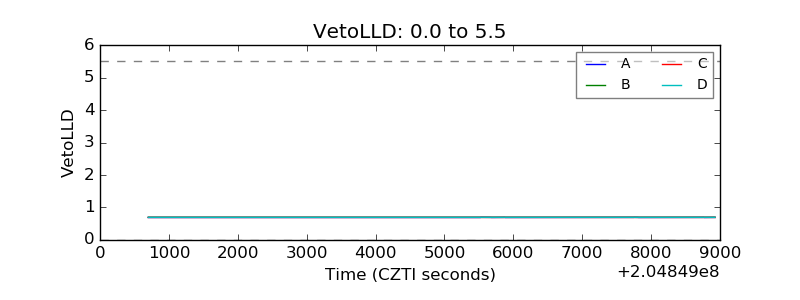 |
| Alpha Counter | 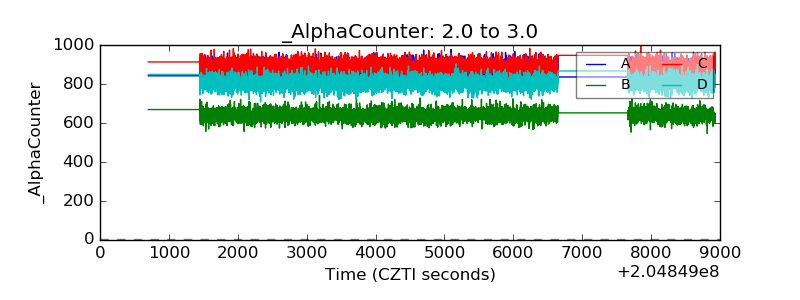 |
| _CPM_Rate | 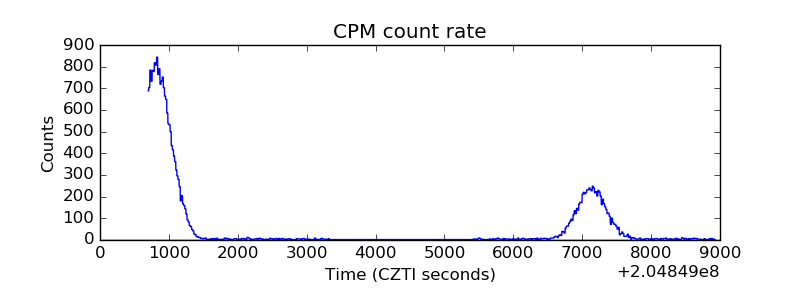 |
| CZT Counter | 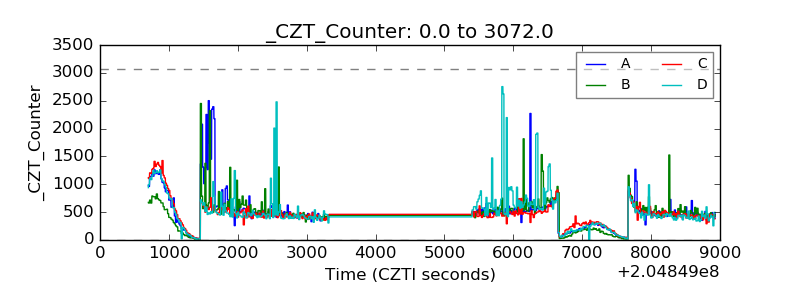 |
| +2.5 Volts monitor |  |
| +5 Volts monitor |  |
| _ROLL_ROT | 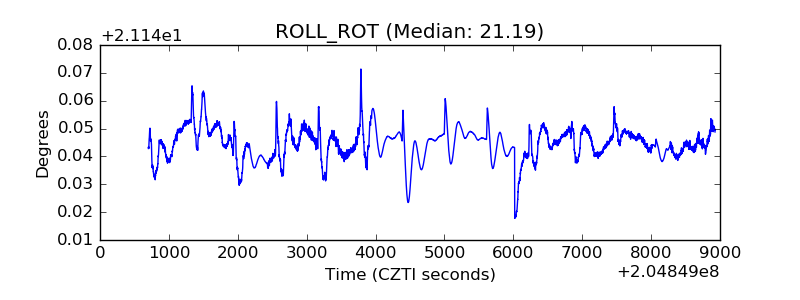 |
| _Roll_DEC | 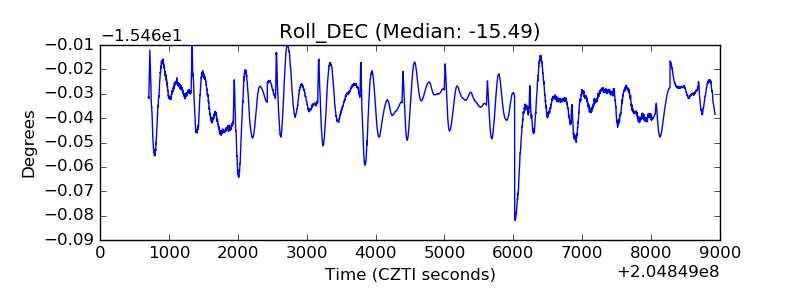 |
| _Roll_RA | 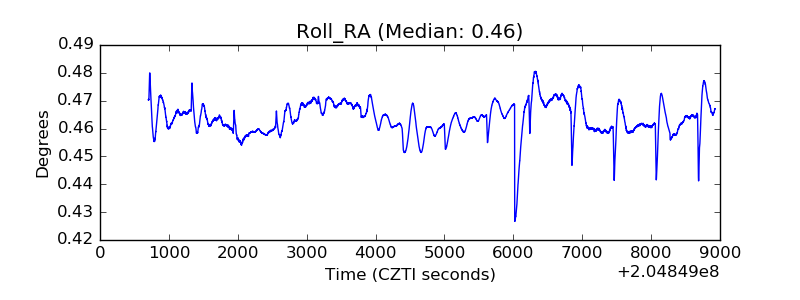 |
| Veto Counter | 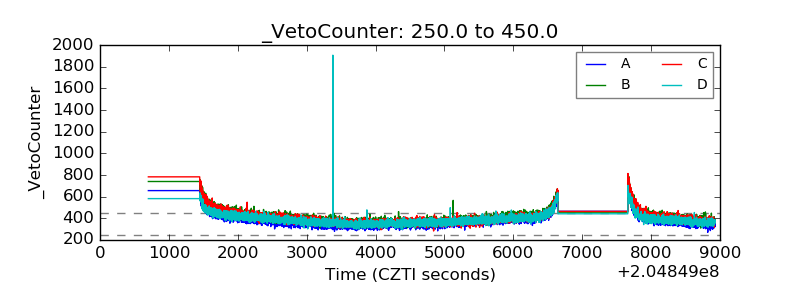 |