| Param | Original file | Final file |
|---|---|---|
| Filename | modeM0/AS1G05_222T01_9000000520_04070cztM0_level2.evt | modeM0/AS1G05_222T01_9000000520_04070cztM0_level2_quad_clean.evt |
| Size (bytes) | 563,250,240 | 82,707,840 |
| Size | 537.2 MB | 78.9 MB |
| Events in quadrant A | 4,237,863 | 495,538 |
| Events in quadrant B | 4,402,466 | 497,082 |
| Events in quadrant C | 3,605,338 | 494,537 |
| Events in quadrant D | 4,281,877 | 473,474 |
| Mode M9 | |||
|---|---|---|---|
| Quadrant | BADHDUFLAG | Total packets | Discarded packets |
| A | 0 | 16 | 1 |
| B | 0 | 16 | 0 |
| C | 0 | 16 | 0 |
| D | 0 | 16 | 0 |
| Mode SS | |||
|---|---|---|---|
| Quadrant | BADHDUFLAG | Total packets | Discarded packets |
| A | 0 | 162 | 0 |
| B | 0 | 162 | 0 |
| C | 0 | 162 | 0 |
| D | 0 | 162 | 0 |
| Mode M0 | |||
|---|---|---|---|
| Quadrant | BADHDUFLAG | Total packets | Discarded packets |
| A | 0 | 17891 | 11 |
| B | 0 | 18357 | 6 |
| C | 0 | 16233 | 4 |
| D | 0 | 18448 | 12 |
| Quadrant | Total seconds | Saturated seconds | Saturation percentage |
|---|---|---|---|
| A | 7810 | 269 | 3.444302% |
| B | 7812 | 291 | 3.725038% |
| C | 7813 | 94 | 1.203123% |
| D | 7810 | 196 | 2.509603% |
Noise dominated data is calculated using 1-second bins in cleaned event files. If a bin has >2000 counts, and if more than 50% of those come from <1% of pixels, then it is considered to be noise-dominated and hence unusable.
| Quadrant | # 1 sec bins | Bins with >0 counts | Bins with >2000 counts | High rate bins dominated by noise | Noise dominated (total time) | Noise dominated (detector-on time) | Marked lightcurve |
|---|---|---|---|---|---|---|---|
| A | 9439 | 7817 | 73 | 73 | 0.77% | 0.93% |  |
| B | 9439 | 7816 | 68 | 68 | 0.72% | 0.87% |  |
| C | 9439 | 7816 | 0 | 0 | 0.00% | 0.00% | 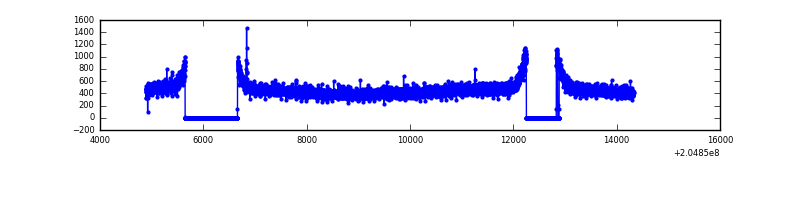 |
| D | 9439 | 7815 | 71 | 71 | 0.75% | 0.91% | 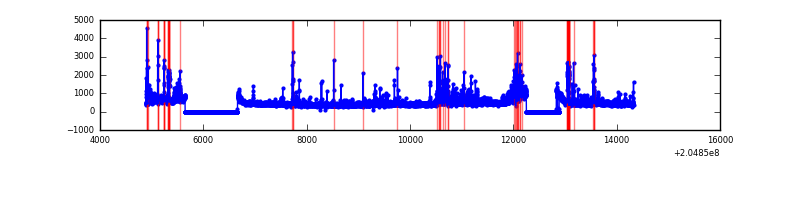 |
Top three noisy pixels from each quadrant. If the there are fewer than three noisy pixels in the level2.evt file, extra rows are filled as -1
| Pixel properties | Quadrant properties | ||||||
|---|---|---|---|---|---|---|---|
| Quadrant | DetID | PixID | Counts | Sigma | Mean | Median | Sigma |
| A | 0 | 50 | 454794 | 2359.03 | 931 | 907 | 192.4 |
| A | 8 | 15 | 93587 | 481.7 | 931 | 907 | 192.4 |
| A | 13 | 251 | 78430 | 402.92 | 931 | 907 | 192.4 |
| B | 10 | 16 | 286876 | 1568.42 | 944 | 920 | 182.3 |
| B | 14 | 167 | 279454 | 1527.72 | 944 | 920 | 182.3 |
| B | 15 | 204 | 76970 | 417.12 | 944 | 920 | 182.3 |
| C | 13 | 61 | 7610 | 30.92 | 921 | 924 | 216.2 |
| C | 9 | 144 | 5223 | 19.88 | 921 | 924 | 216.2 |
| C | 12 | 4 | 4999 | 18.85 | 921 | 924 | 216.2 |
| D | 2 | 232 | 401694 | 1798.44 | 912 | 886 | 222.9 |
| D | 10 | 172 | 285807 | 1278.45 | 912 | 886 | 222.9 |
| D | 13 | 53 | 46249 | 203.55 | 912 | 886 | 222.9 |
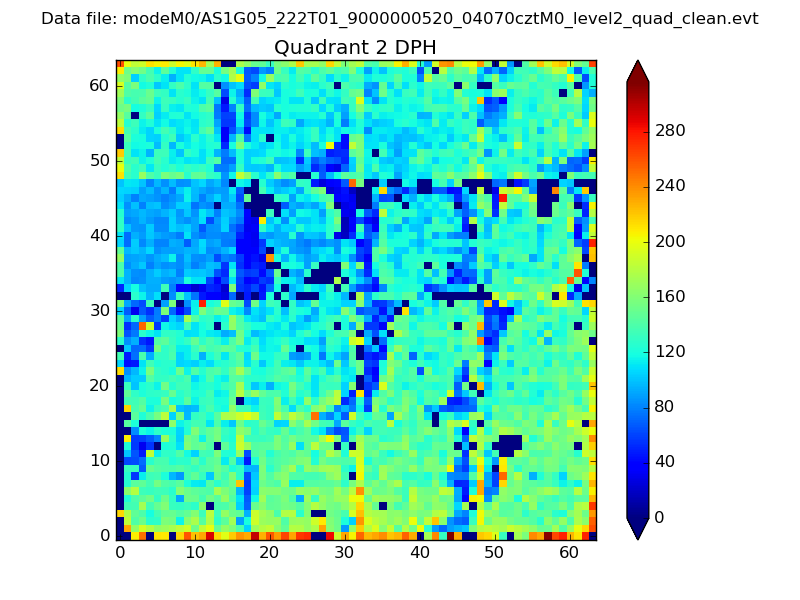
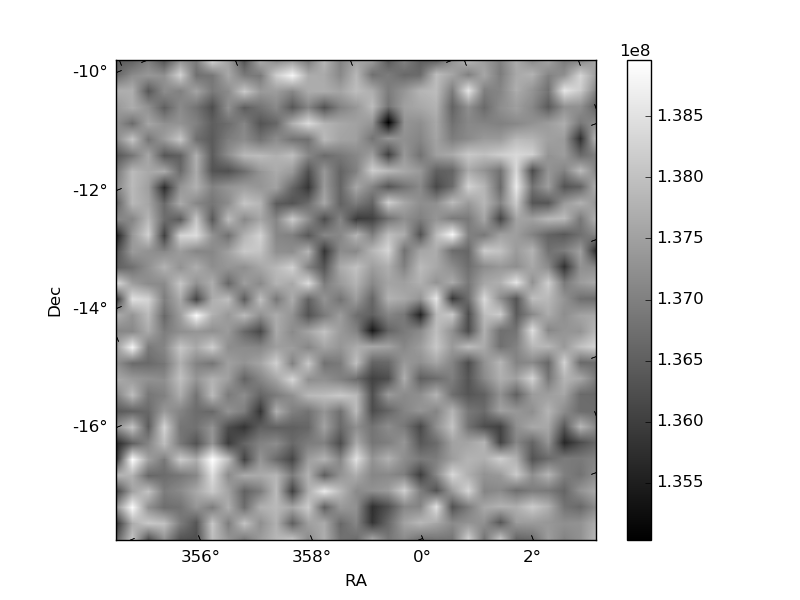
Histogram calculated using DETX and DETY for each event in the final _common_clean file
| Quadrant A | 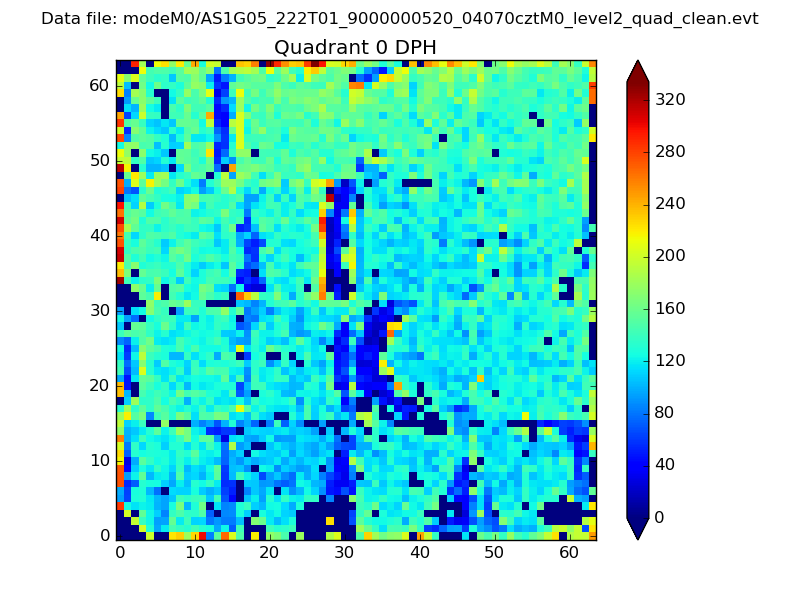 |
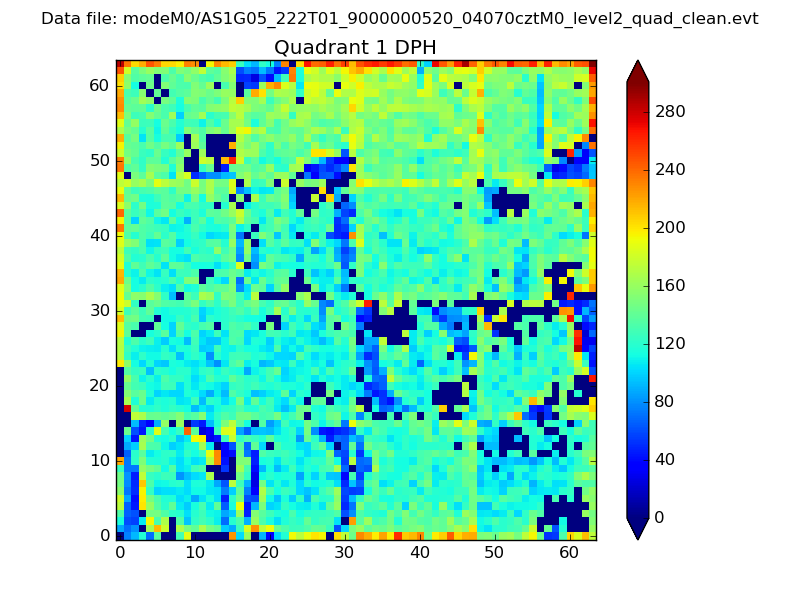 |
Quadrant B |
|---|---|---|---|
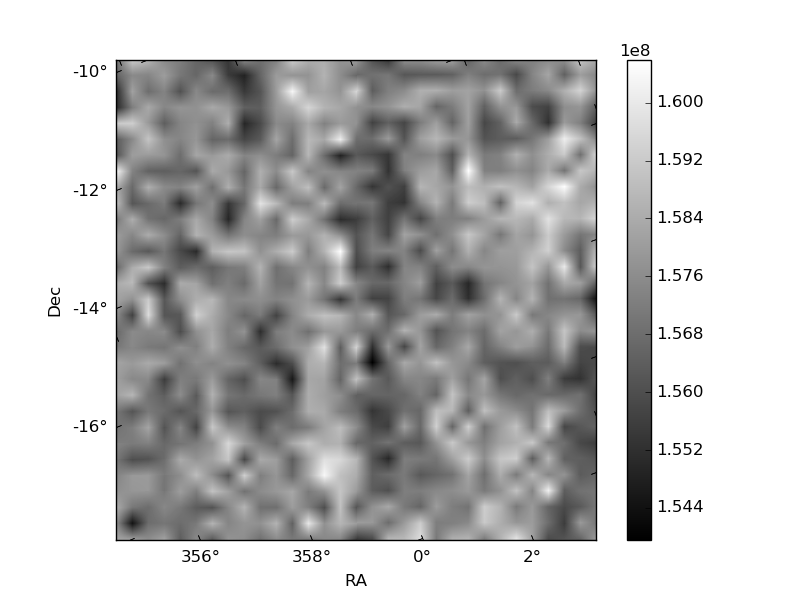
| Quadrant D | 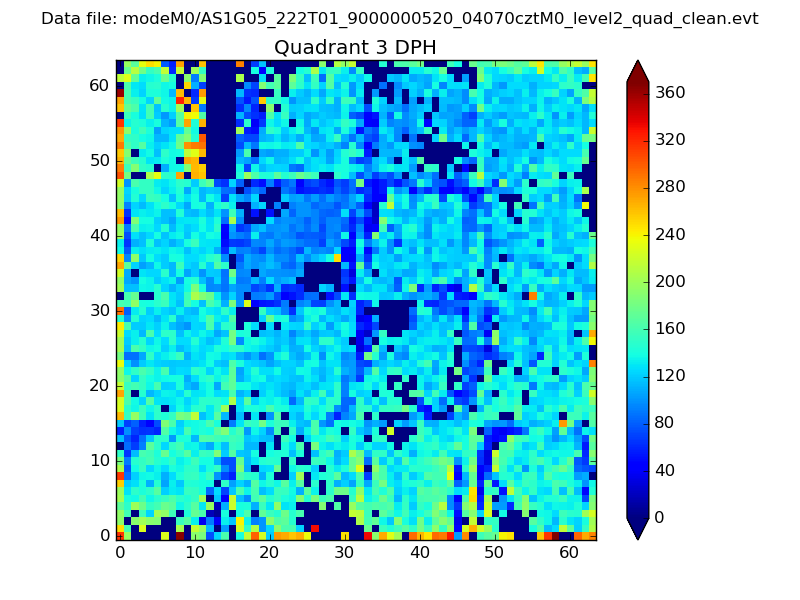 |
 |
Quadrant C |
| Plot type | Count rate plots | Images |
|---|---|---|
| Comparison with Poisson distribution Blue bars denote a histogram of data divided into 1 sec bins. Red curve is a Poisson curve with rate = median count rate of data. |
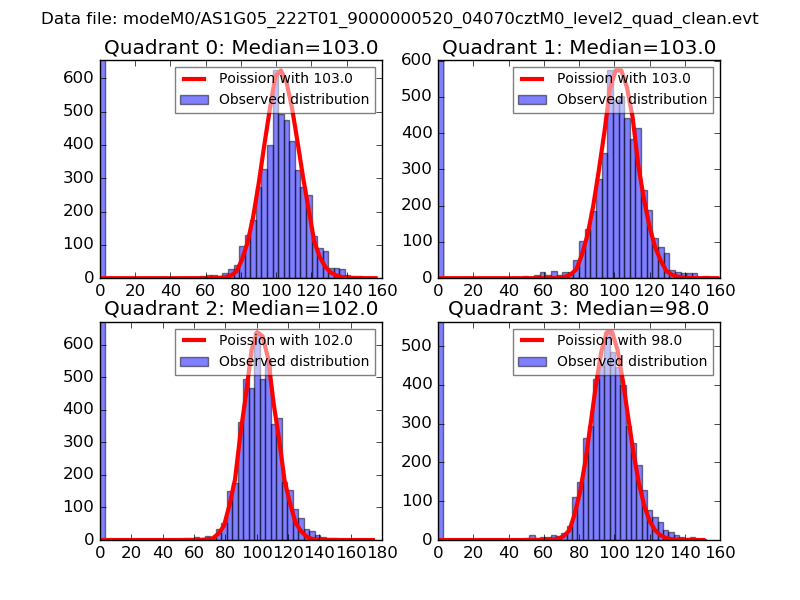 |
 |
| Quadrant-wise count rates Data is divided into 100 sec bins |
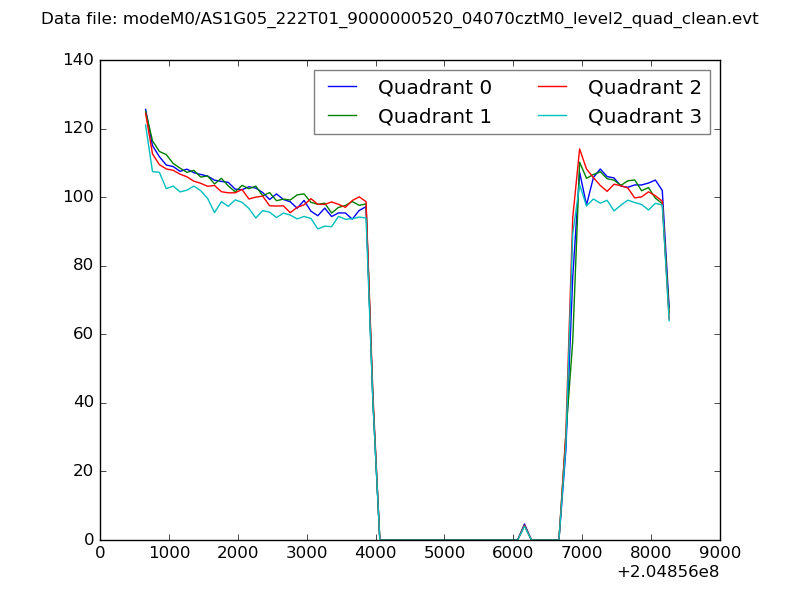 |
|
| Module-wise count rates for Quadrant A Data is divided into 100 sec bins |
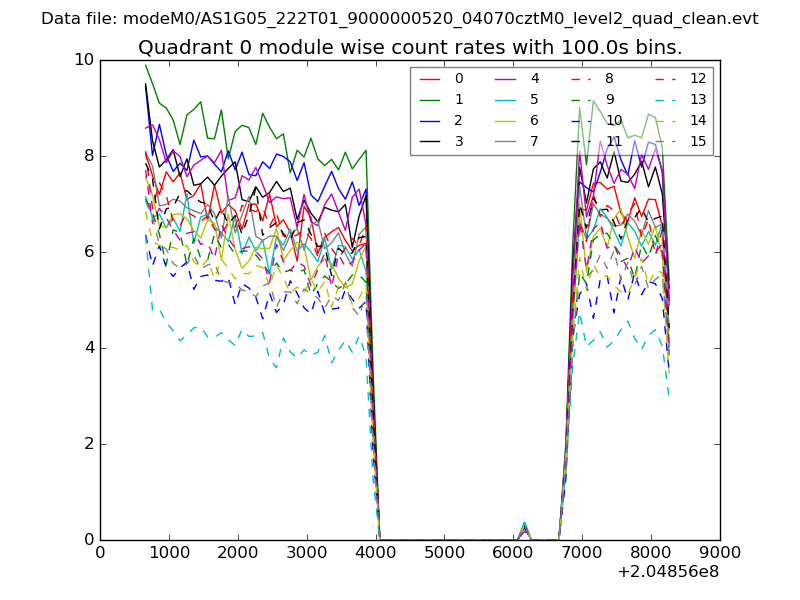 |
 |
| Module-wise count rates for Quadrant B Data is divided into 100 sec bins |
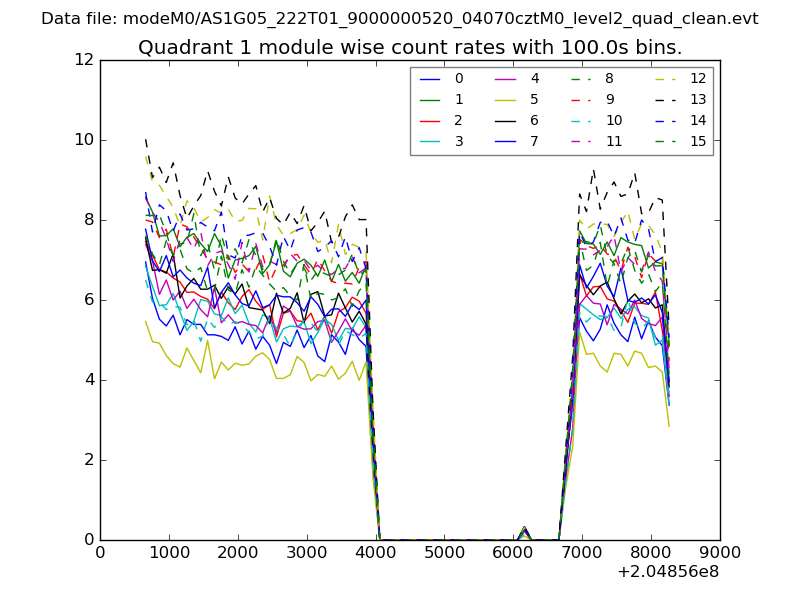 |
 |
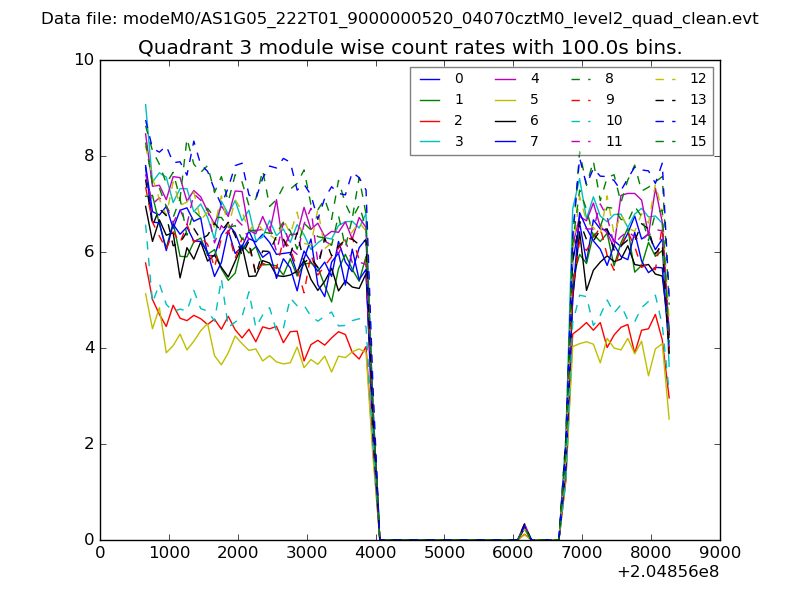
| Module-wise count rates for Quadrant C Data is divided into 100 sec bins |
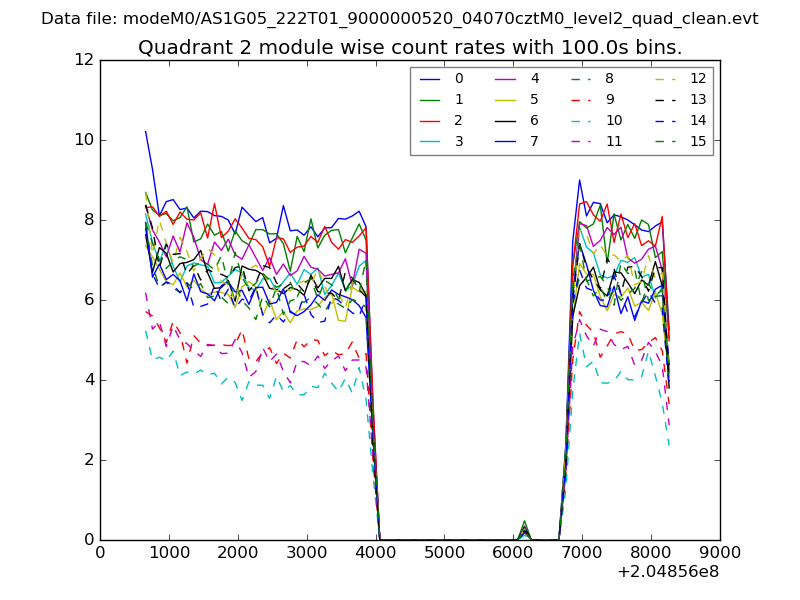 |
 |
| Module-wise count rates for Quadrant D Data is divided into 100 sec bins |
 |
 |
| Parameter | Plot |
|---|---|
| CZT HV Monitor | 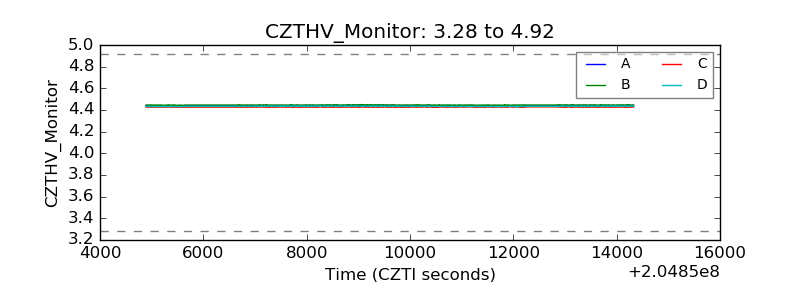 |
| D_VDD |  |
| Temperature 1 | 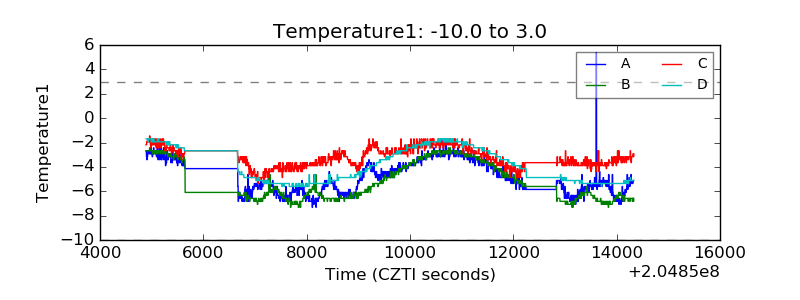 |
| Veto HV Monitor | 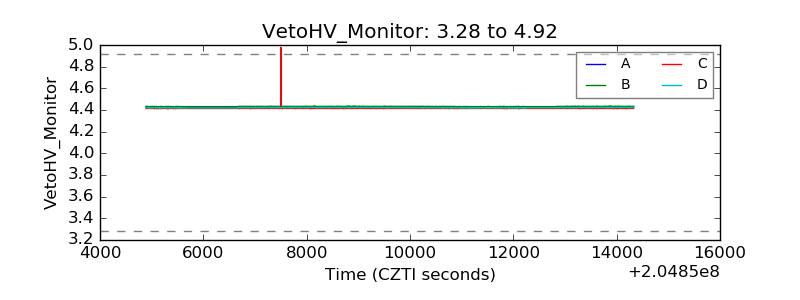 |
| Veto LLD | 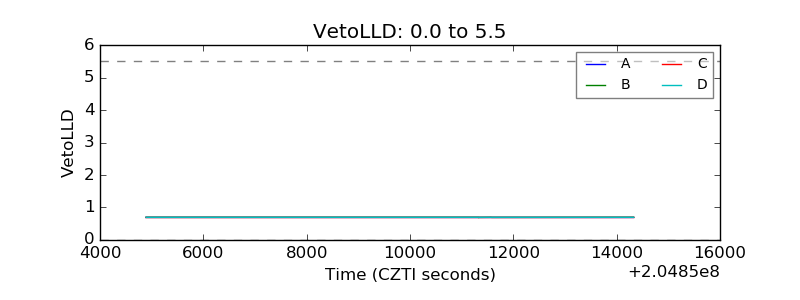 |
| Alpha Counter | 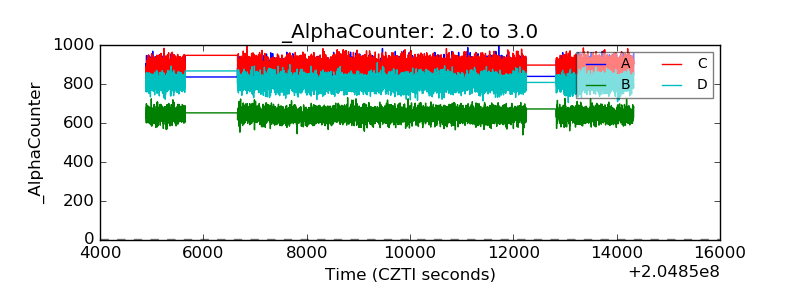 |
| _CPM_Rate | 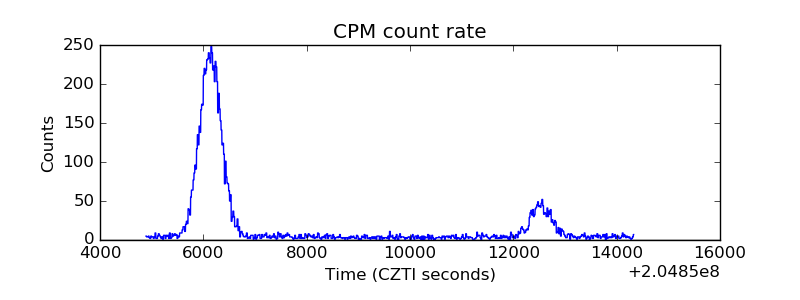 |
| CZT Counter | 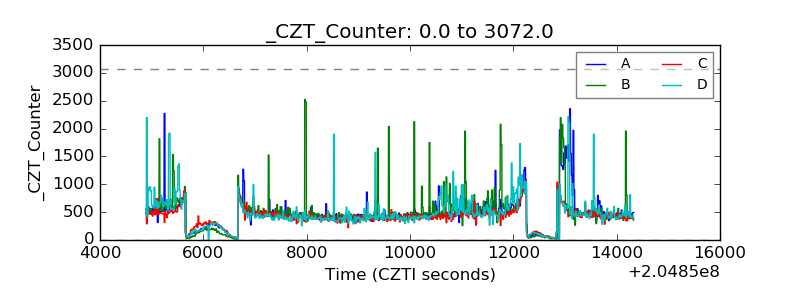 |
| +2.5 Volts monitor |  |
| +5 Volts monitor | 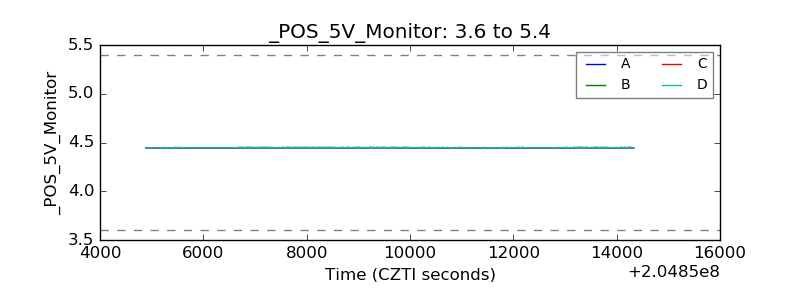 |
| _ROLL_ROT | 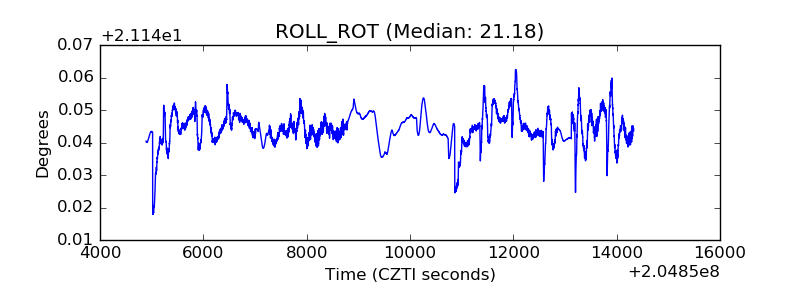 |
| _Roll_DEC | 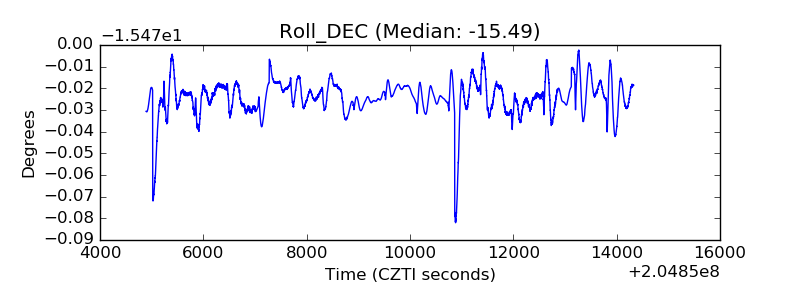 |
| _Roll_RA | 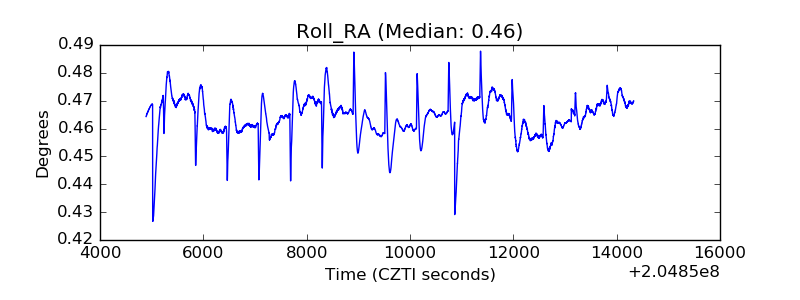 |
| Veto Counter | 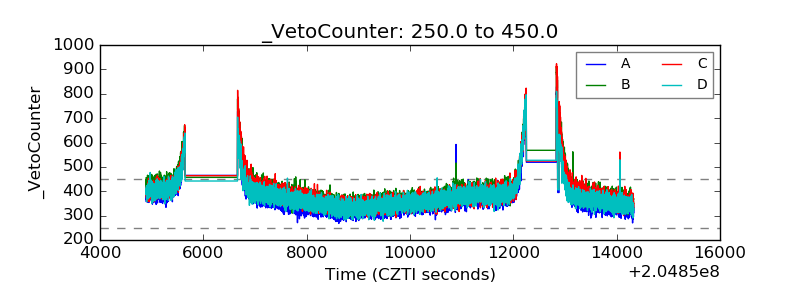 |