| Param | Original file | Final file |
|---|---|---|
| Filename | modeM0/AS1G05_222T01_9000000520_04071cztM0_level2.evt | modeM0/AS1G05_222T01_9000000520_04071cztM0_level2_quad_clean.evt |
| Size (bytes) | 576,446,400 | 82,229,760 |
| Size | 549.7 MB | 78.4 MB |
| Events in quadrant A | 4,208,293 | 499,964 |
| Events in quadrant B | 4,389,305 | 490,379 |
| Events in quadrant C | 3,892,943 | 495,549 |
| Events in quadrant D | 4,446,924 | 471,866 |
| Mode M9 | |||
|---|---|---|---|
| Quadrant | BADHDUFLAG | Total packets | Discarded packets |
| A | 0 | 7 | 1 |
| B | 0 | 7 | 2 |
| C | 0 | 7 | 1 |
| D | 0 | 7 | 0 |
| Mode SS | |||
|---|---|---|---|
| Quadrant | BADHDUFLAG | Total packets | Discarded packets |
| A | 0 | 178 | 24 |
| B | 0 | 178 | 22 |
| C | 0 | 178 | 12 |
| D | 0 | 176 | 11 |
| Mode M0 | |||
|---|---|---|---|
| Quadrant | BADHDUFLAG | Total packets | Discarded packets |
| A | 0 | 20486 | 2906 |
| B | 0 | 21464 | 3268 |
| C | 0 | 19199 | 2226 |
| D | 0 | 21853 | 3135 |
| Quadrant | Total seconds | Saturated seconds | Saturation percentage |
|---|---|---|---|
| A | 7624 | 369 | 4.839979% |
| B | 7568 | 489 | 6.461416% |
| C | 7703 | 204 | 2.648319% |
| D | 7577 | 366 | 4.830408% |
Noise dominated data is calculated using 1-second bins in cleaned event files. If a bin has >2000 counts, and if more than 50% of those come from <1% of pixels, then it is considered to be noise-dominated and hence unusable.
| Quadrant | # 1 sec bins | Bins with >0 counts | Bins with >2000 counts | High rate bins dominated by noise | Noise dominated (total time) | Noise dominated (detector-on time) | Marked lightcurve |
|---|---|---|---|---|---|---|---|
| A | 9389 | 8437 | 67 | 67 | 0.71% | 0.79% | 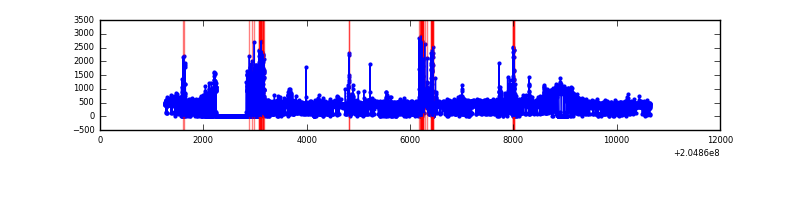 |
| B | 9389 | 8386 | 157 | 157 | 1.67% | 1.87% | 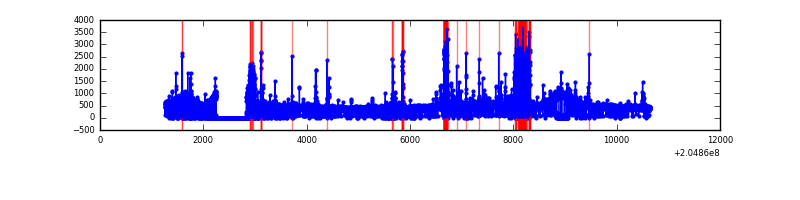 |
| C | 9389 | 8517 | 9 | 9 | 0.10% | 0.11% | 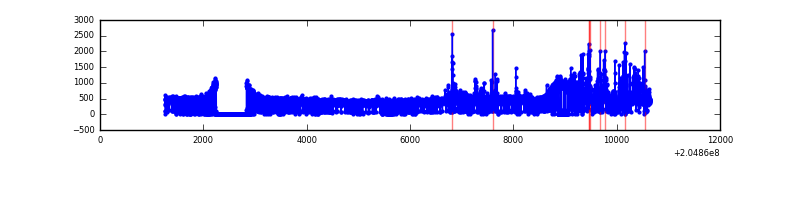 |
| D | 9389 | 8445 | 83 | 83 | 0.88% | 0.98% | 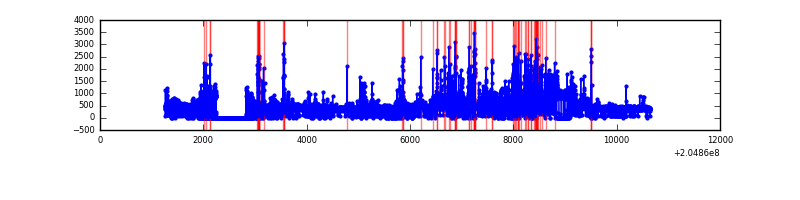 |
Top three noisy pixels from each quadrant. If the there are fewer than three noisy pixels in the level2.evt file, extra rows are filled as -1
| Pixel properties | Quadrant properties | ||||||
|---|---|---|---|---|---|---|---|
| Quadrant | DetID | PixID | Counts | Sigma | Mean | Median | Sigma |
| A | 0 | 50 | 469697 | 2456.06 | 918 | 896 | 190.9 |
| A | 13 | 251 | 93873 | 487.11 | 918 | 896 | 190.9 |
| A | 8 | 15 | 74111 | 383.58 | 918 | 896 | 190.9 |
| B | 14 | 167 | 508508 | 2814.55 | 917 | 892 | 180.4 |
| B | 10 | 16 | 134264 | 739.5 | 917 | 892 | 180.4 |
| B | 4 | 81 | 84687 | 464.61 | 917 | 892 | 180.4 |
| C | 9 | 144 | 314428 | 1435.08 | 915 | 918 | 218.5 |
| C | 13 | 61 | 7650 | 30.82 | 915 | 918 | 218.5 |
| C | 12 | 4 | 2919 | 9.16 | 915 | 918 | 218.5 |
| D | 10 | 172 | 708500 | 3206.43 | 891 | 864 | 220.7 |
| D | 2 | 232 | 202413 | 913.26 | 891 | 864 | 220.7 |
| D | 12 | 233 | 58493 | 261.13 | 891 | 864 | 220.7 |
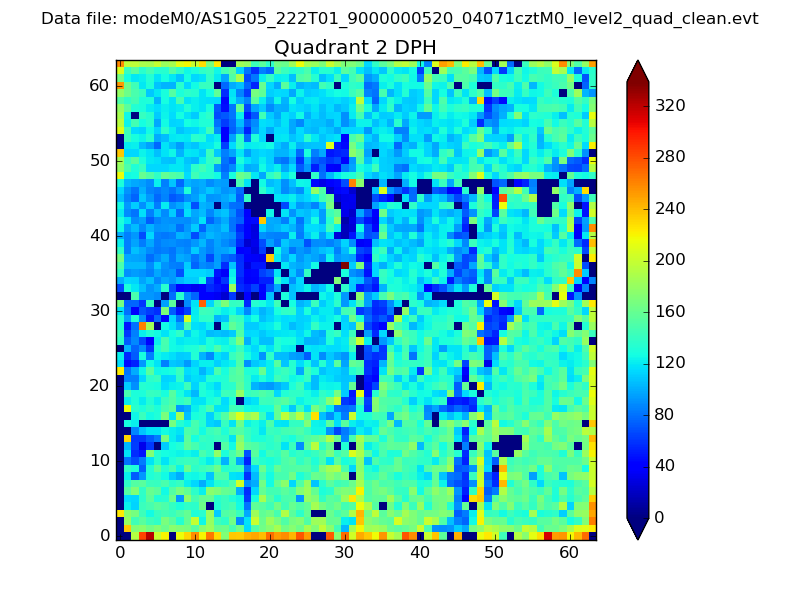
Histogram calculated using DETX and DETY for each event in the final _common_clean file
| Quadrant A | 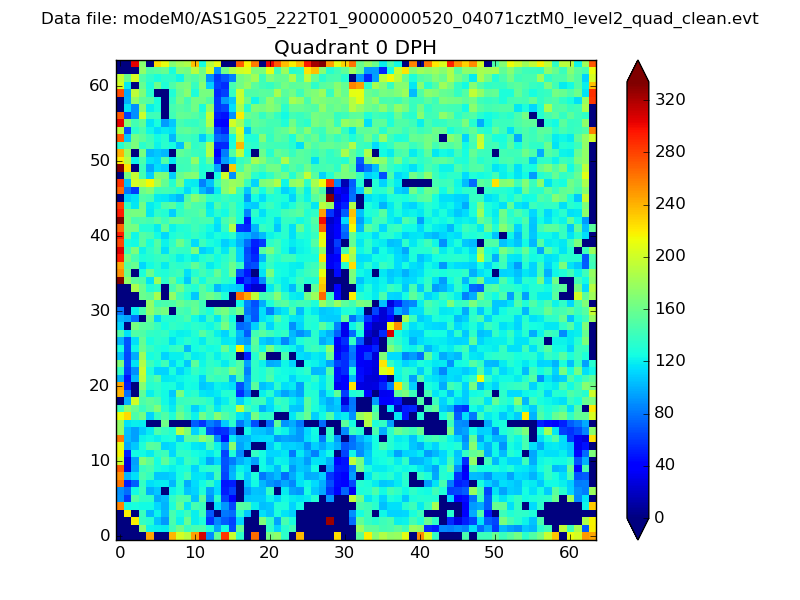 |
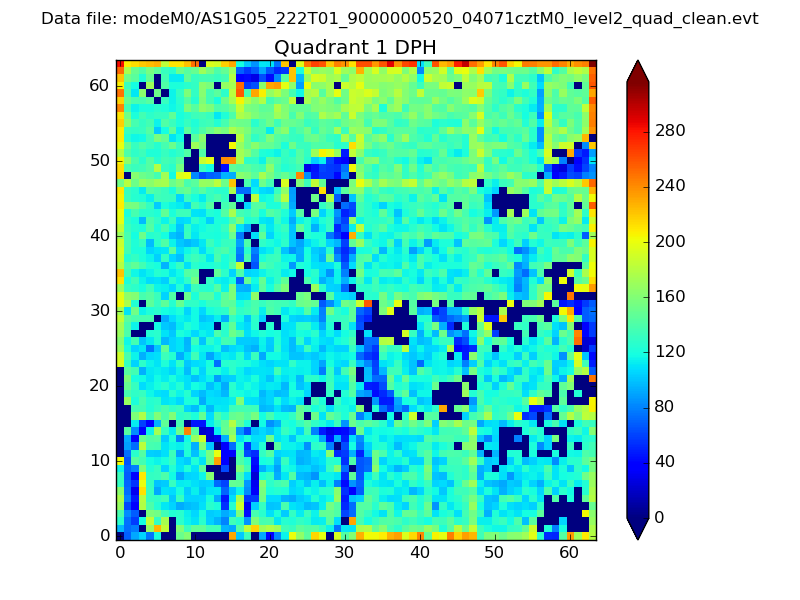 |
Quadrant B |
|---|---|---|---|
| Quadrant D | 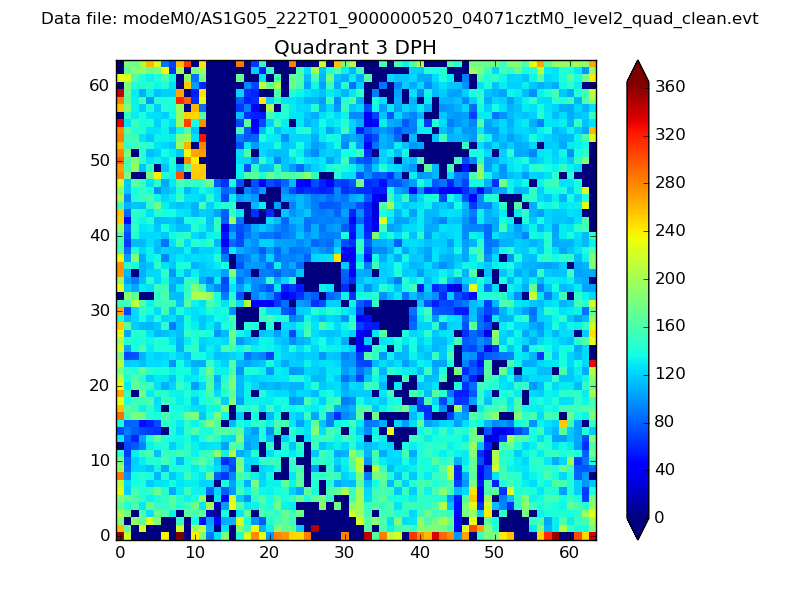 |
 |
Quadrant C |
| Plot type | Count rate plots | Images |
|---|---|---|
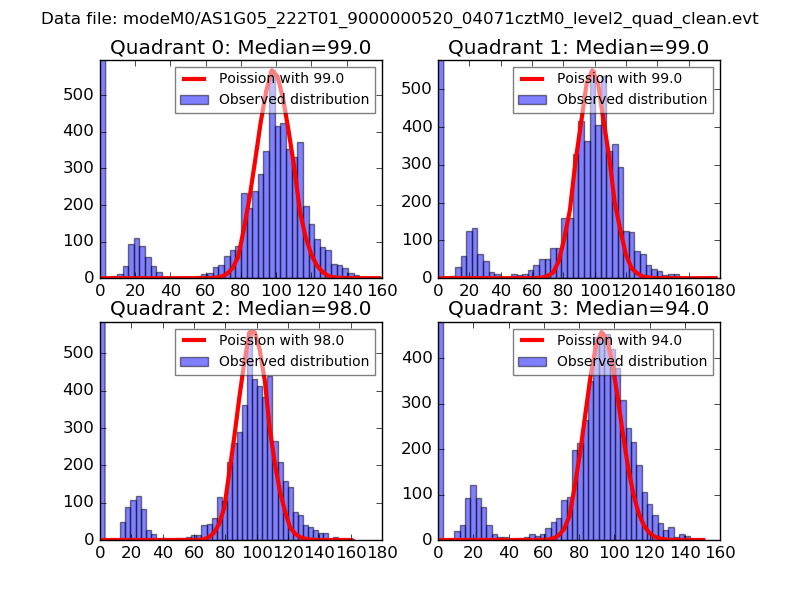
| Comparison with Poisson distribution Blue bars denote a histogram of data divided into 1 sec bins. Red curve is a Poisson curve with rate = median count rate of data. |
 |
 |
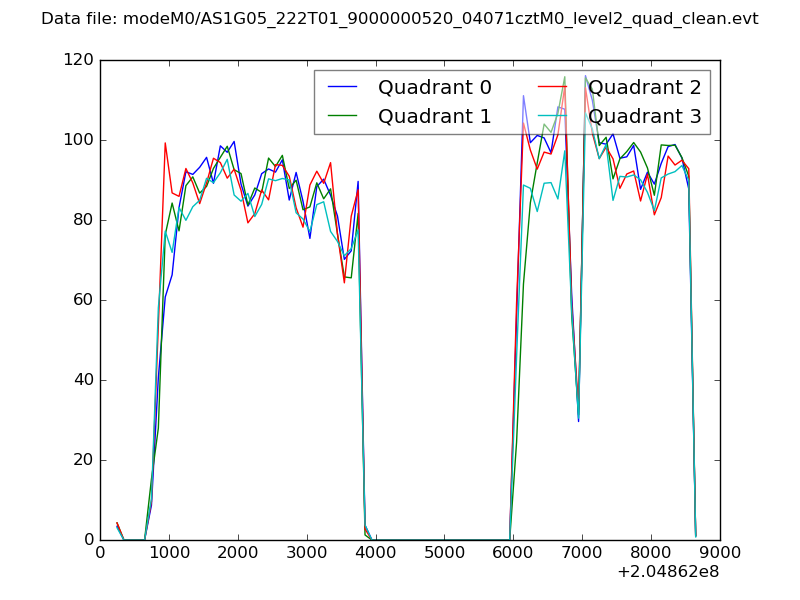
| Quadrant-wise count rates Data is divided into 100 sec bins |
 |
|
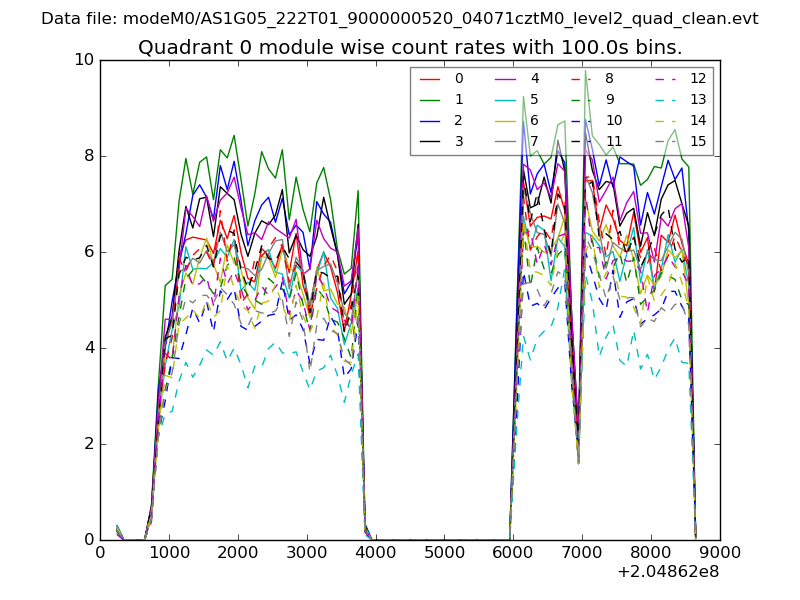
| Module-wise count rates for Quadrant A Data is divided into 100 sec bins |
 |
 |
| Module-wise count rates for Quadrant B Data is divided into 100 sec bins |
 |
 |
| Module-wise count rates for Quadrant C Data is divided into 100 sec bins |
 |
 |
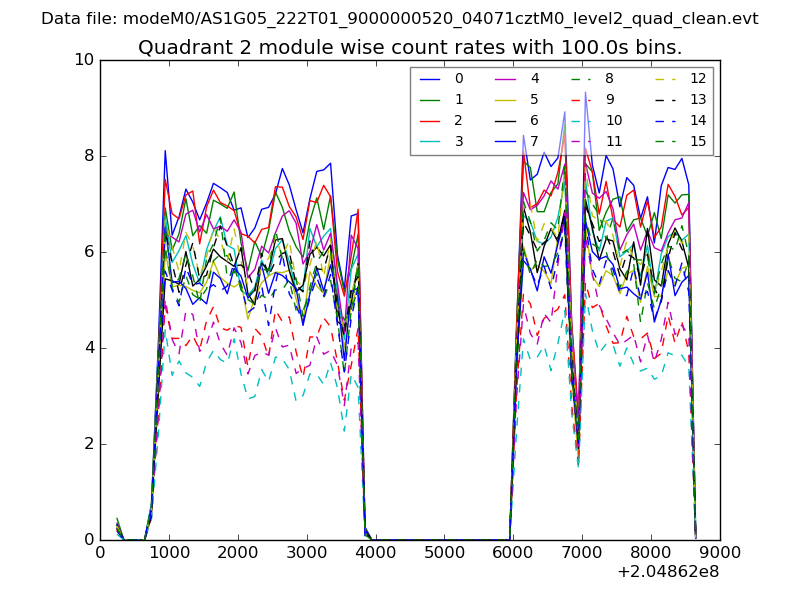
| Module-wise count rates for Quadrant D Data is divided into 100 sec bins |
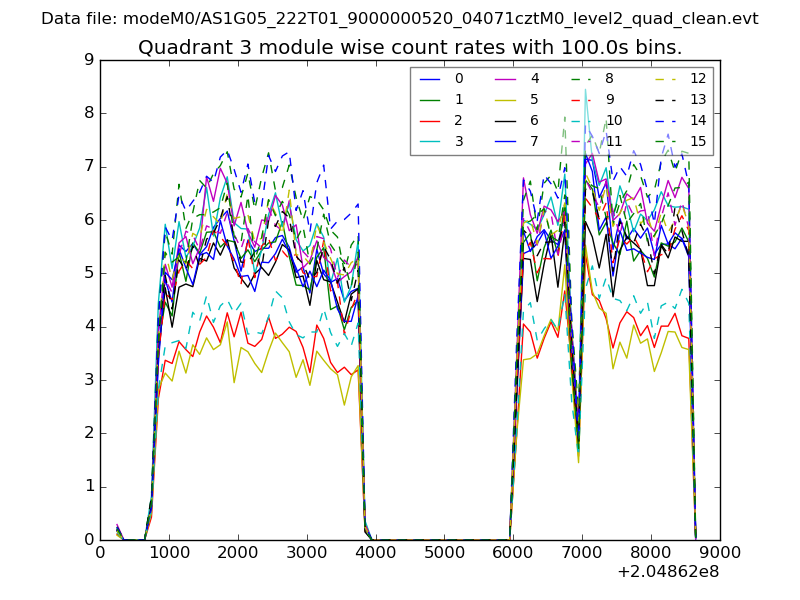 |
 |
| Parameter | Plot |
|---|---|
| CZT HV Monitor | 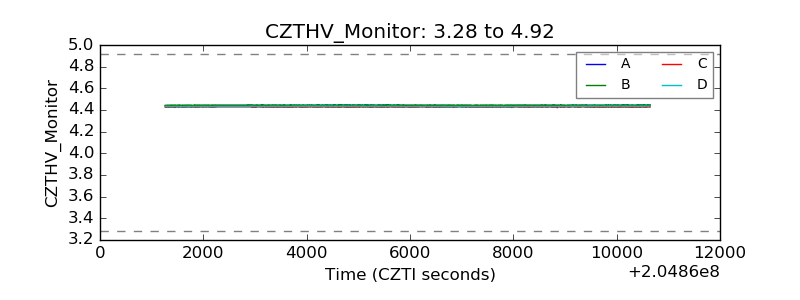 |
| D_VDD | 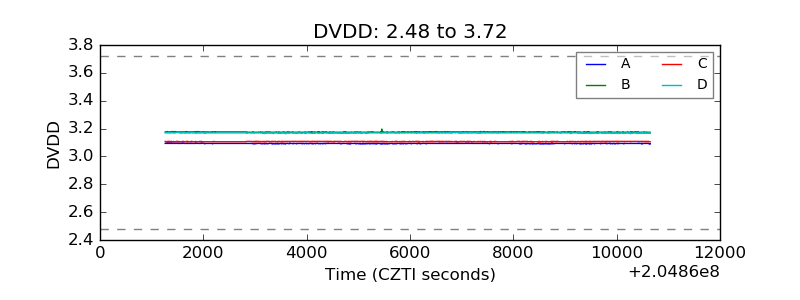 |
| Temperature 1 | 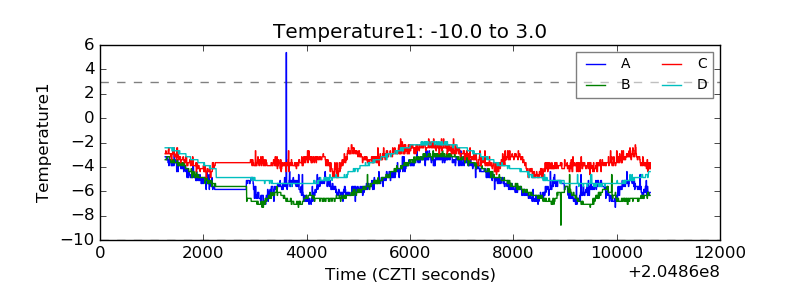 |
| Veto HV Monitor | 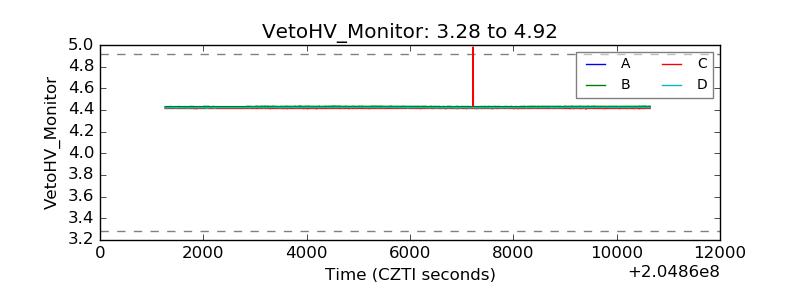 |
| Veto LLD | 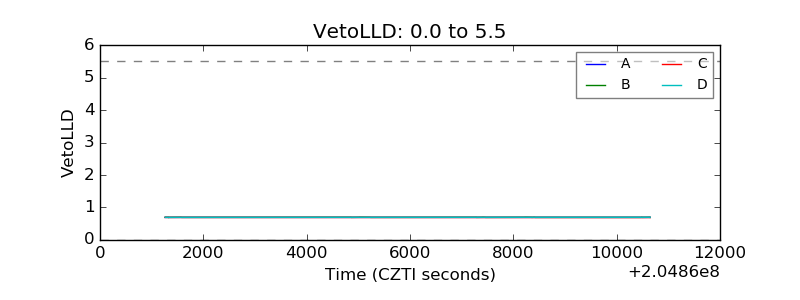 |
| Alpha Counter | 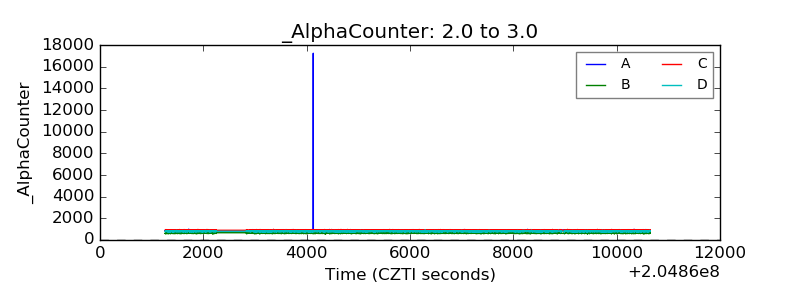 |
| _CPM_Rate | 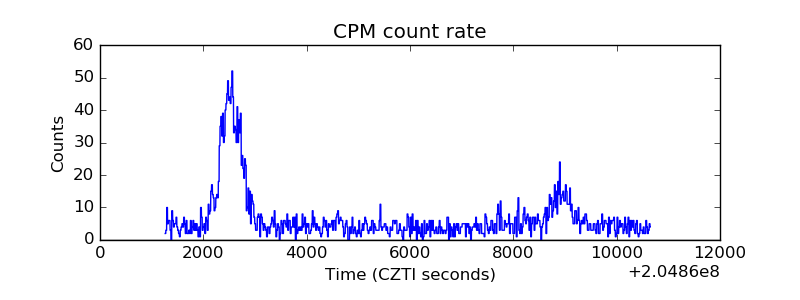 |
| CZT Counter | 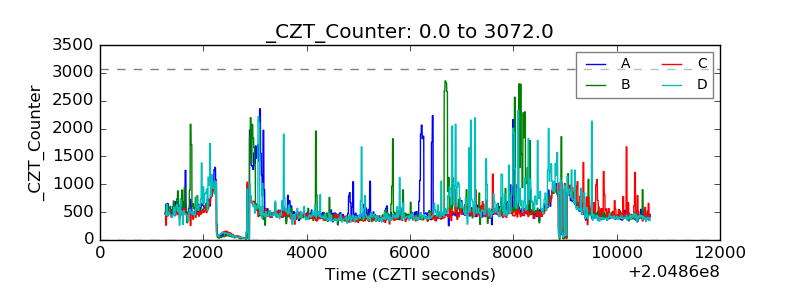 |
| +2.5 Volts monitor |  |
| +5 Volts monitor |  |
| _ROLL_ROT | 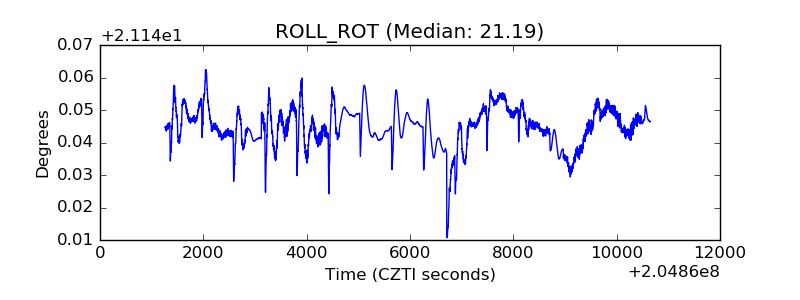 |
| _Roll_DEC | 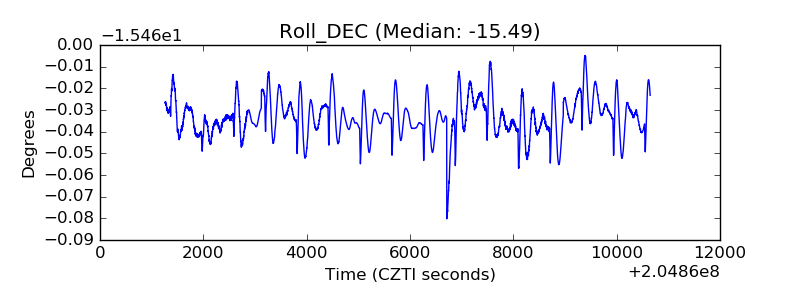 |
| _Roll_RA | 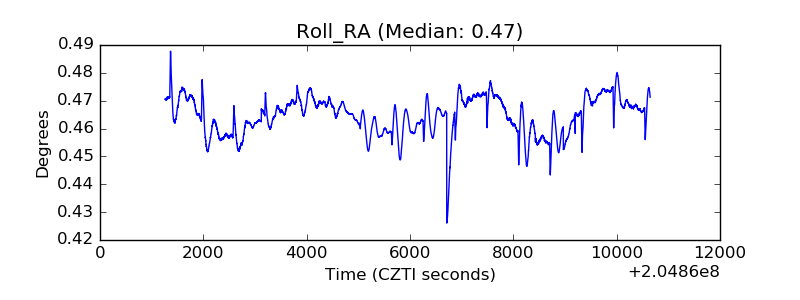 |
| Veto Counter | 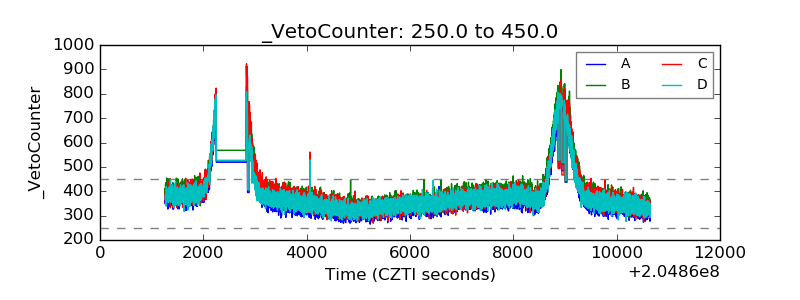 |