| Param | Original file | Final file |
|---|---|---|
| Filename | modeM0/AS1G05_222T01_9000000520_04075cztM0_level2.evt | modeM0/AS1G05_222T01_9000000520_04075cztM0_level2_quad_clean.evt |
| Size (bytes) | 1,110,453,120 | 153,904,320 |
| Size | 1.0 GB | 146.8 MB |
| Events in quadrant A | 7,255,885 | 921,642 |
| Events in quadrant B | 7,384,345 | 924,532 |
| Events in quadrant C | 8,345,803 | 906,541 |
| Events in quadrant D | 9,640,033 | 883,485 |
| Mode M9 | |||
|---|---|---|---|
| Quadrant | BADHDUFLAG | Total packets | Discarded packets |
| A | 0 | 4 | 0 |
| B | 0 | 4 | 0 |
| C | 0 | 4 | 0 |
| D | 0 | 4 | 0 |
| Mode SS | |||
|---|---|---|---|
| Quadrant | BADHDUFLAG | Total packets | Discarded packets |
| A | 0 | 302 | 8 |
| B | 0 | 302 | 4 |
| C | 0 | 302 | 4 |
| D | 0 | 302 | 2 |
| Mode M0 | |||
|---|---|---|---|
| Quadrant | BADHDUFLAG | Total packets | Discarded packets |
| A | 0 | 32302 | 333 |
| B | 0 | 32499 | 511 |
| C | 0 | 35769 | 487 |
| D | 0 | 40711 | 895 |
| Quadrant | Total seconds | Saturated seconds | Saturation percentage |
|---|---|---|---|
| A | 14876 | 452 | 3.038451% |
| B | 14824 | 486 | 3.278467% |
| C | 14843 | 492 | 3.314694% |
| D | 14807 | 1312 | 8.860674% |
Noise dominated data is calculated using 1-second bins in cleaned event files. If a bin has >2000 counts, and if more than 50% of those come from <1% of pixels, then it is considered to be noise-dominated and hence unusable.
| Quadrant | # 1 sec bins | Bins with >0 counts | Bins with >2000 counts | High rate bins dominated by noise | Noise dominated (total time) | Noise dominated (detector-on time) | Marked lightcurve |
|---|---|---|---|---|---|---|---|
| A | 15413 | 15016 | 52 | 52 | 0.34% | 0.35% | 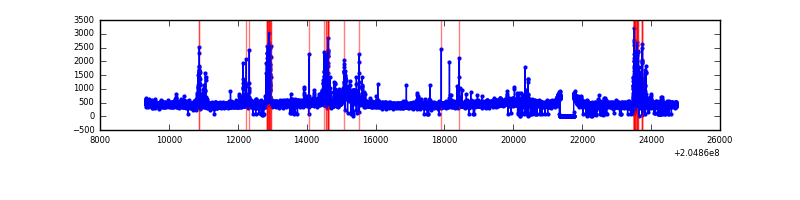 |
| B | 15413 | 15002 | 117 | 117 | 0.76% | 0.78% | 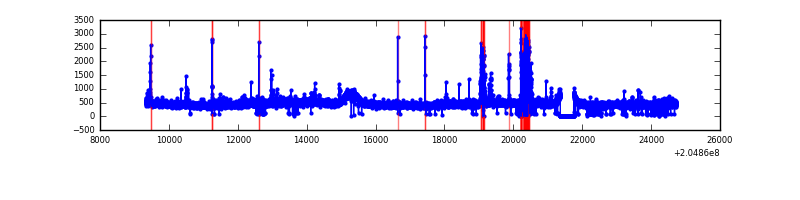 |
| C | 15413 | 15005 | 125 | 125 | 0.81% | 0.83% | 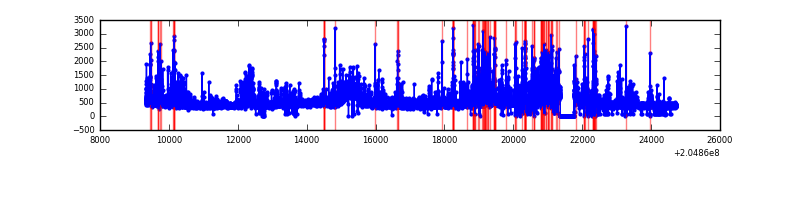 |
| D | 15413 | 14965 | 964 | 964 | 6.25% | 6.44% | 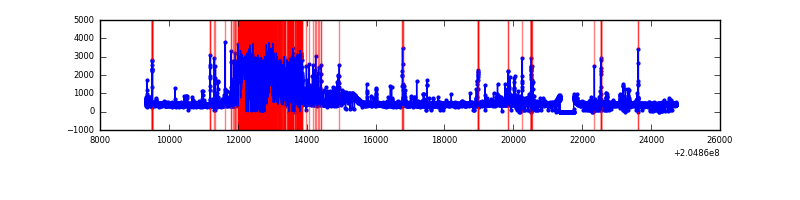 |
Top three noisy pixels from each quadrant. If the there are fewer than three noisy pixels in the level2.evt file, extra rows are filled as -1
| Pixel properties | Quadrant properties | ||||||
|---|---|---|---|---|---|---|---|
| Quadrant | DetID | PixID | Counts | Sigma | Mean | Median | Sigma |
| A | 0 | 50 | 545355 | 1545.13 | 1707 | 1666 | 351.9 |
| A | 8 | 15 | 99317 | 277.52 | 1707 | 1666 | 351.9 |
| A | 0 | 118 | 22703 | 59.79 | 1707 | 1666 | 351.9 |
| B | 10 | 16 | 362723 | 1088.38 | 1711 | 1668 | 331.7 |
| B | 15 | 204 | 160143 | 477.71 | 1711 | 1668 | 331.7 |
| B | 7 | 252 | 116193 | 345.23 | 1711 | 1668 | 331.7 |
| C | 9 | 144 | 1890071 | 4896.38 | 1650 | 1658 | 385.7 |
| C | 13 | 61 | 13527 | 30.77 | 1650 | 1658 | 385.7 |
| C | 10 | 21 | 5406 | 9.72 | 1650 | 1658 | 385.7 |
| D | 2 | 232 | 3113948 | 7936.06 | 1614 | 1568 | 392.2 |
| D | 10 | 172 | 125375 | 315.69 | 1614 | 1568 | 392.2 |
| D | 13 | 239 | 121627 | 306.13 | 1614 | 1568 | 392.2 |
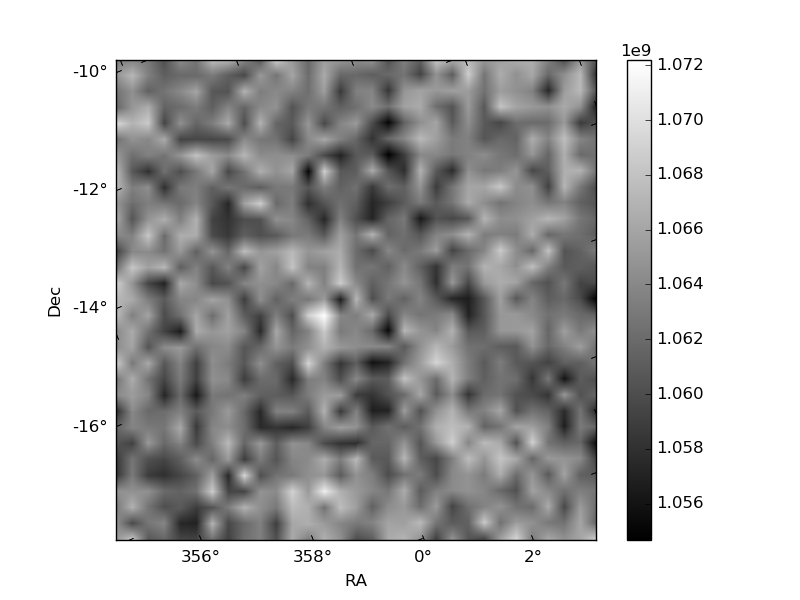
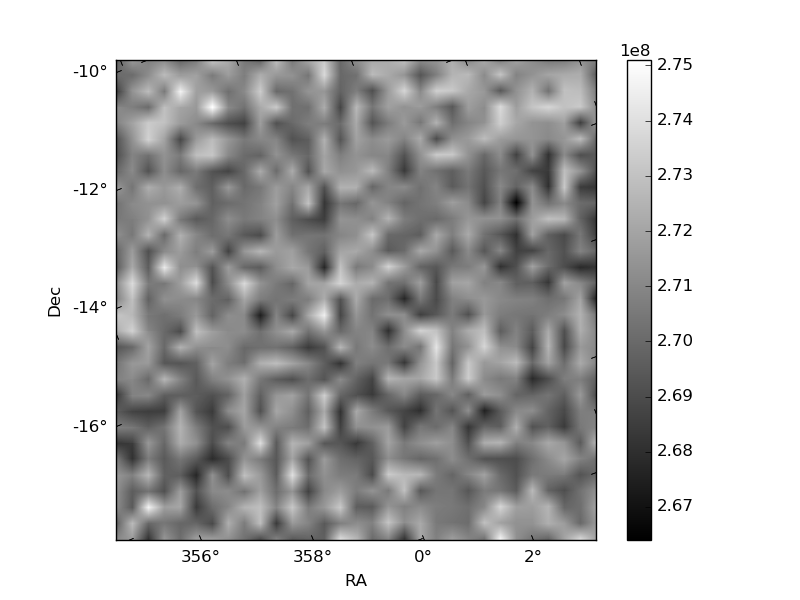
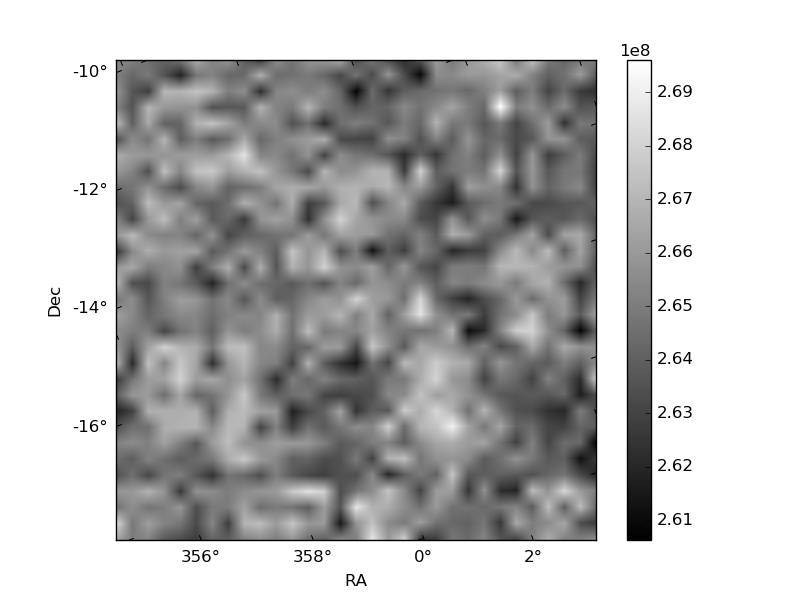
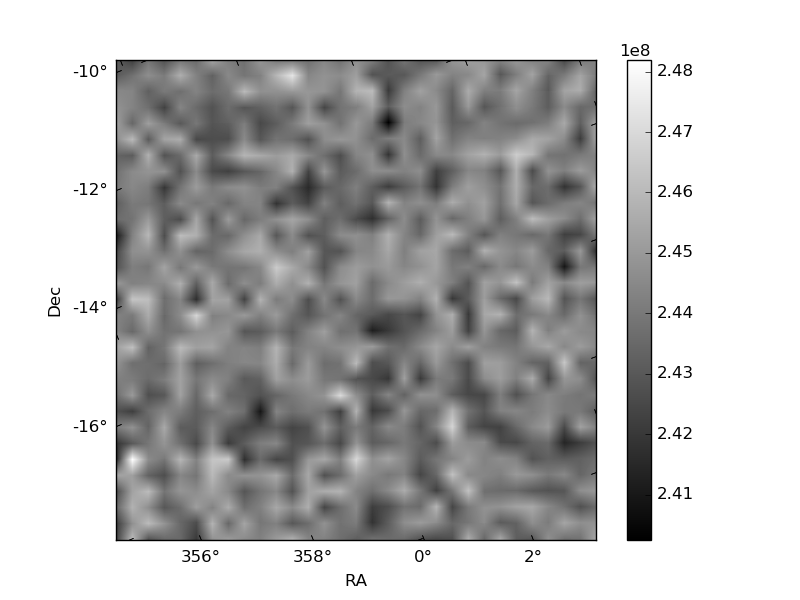
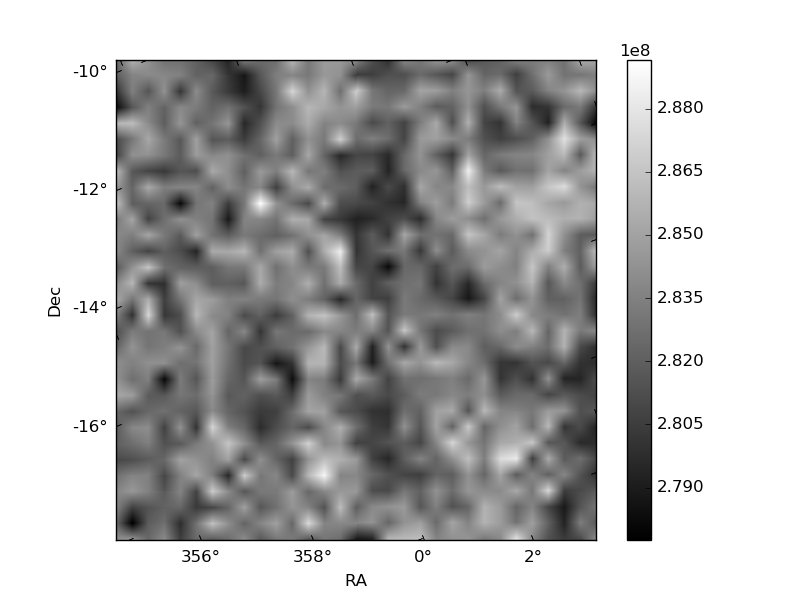
Histogram calculated using DETX and DETY for each event in the final _common_clean file
| Quadrant A | 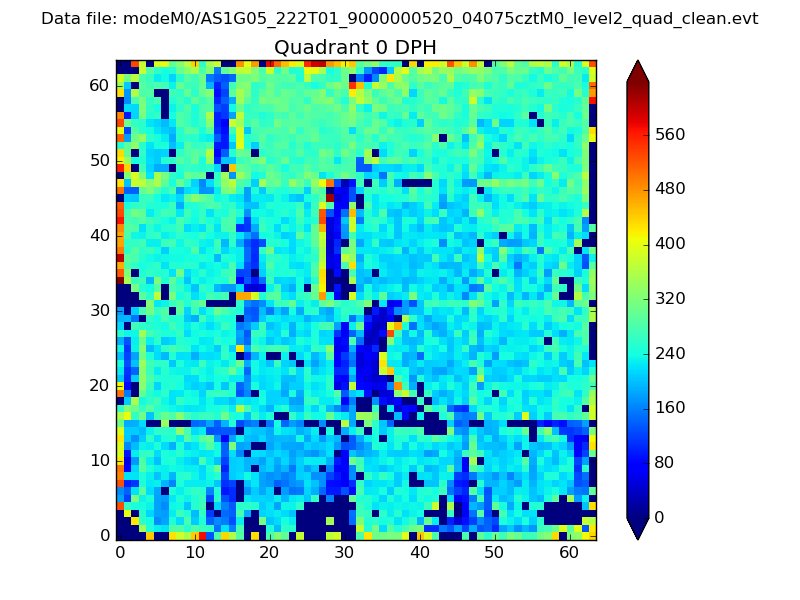 |
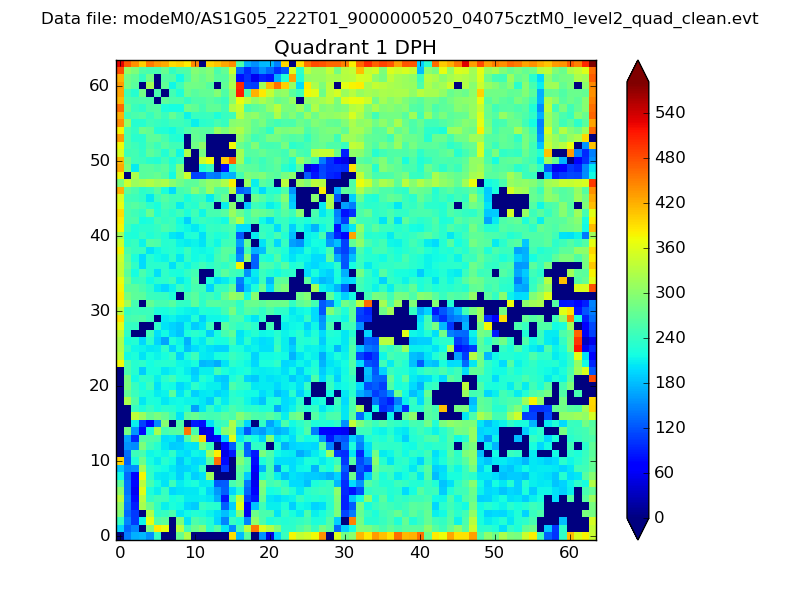 |
Quadrant B |
|---|---|---|---|
| Quadrant D | 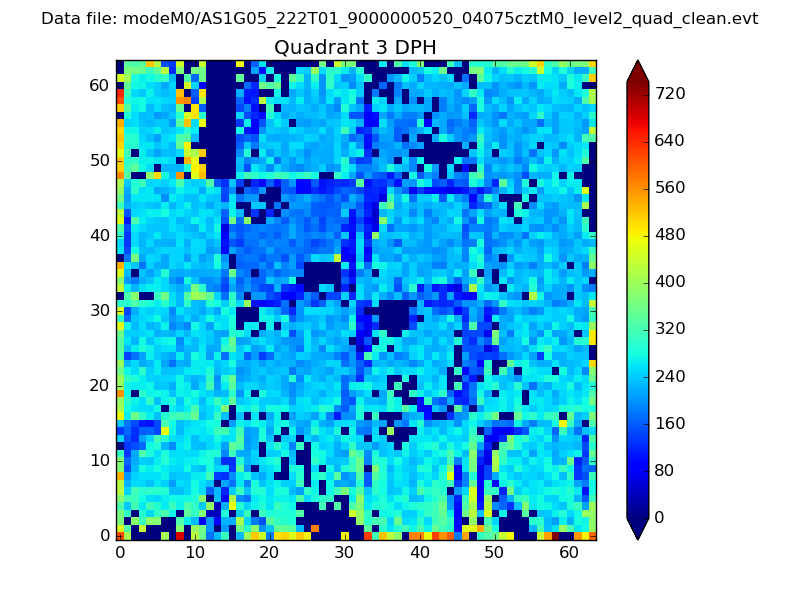 |
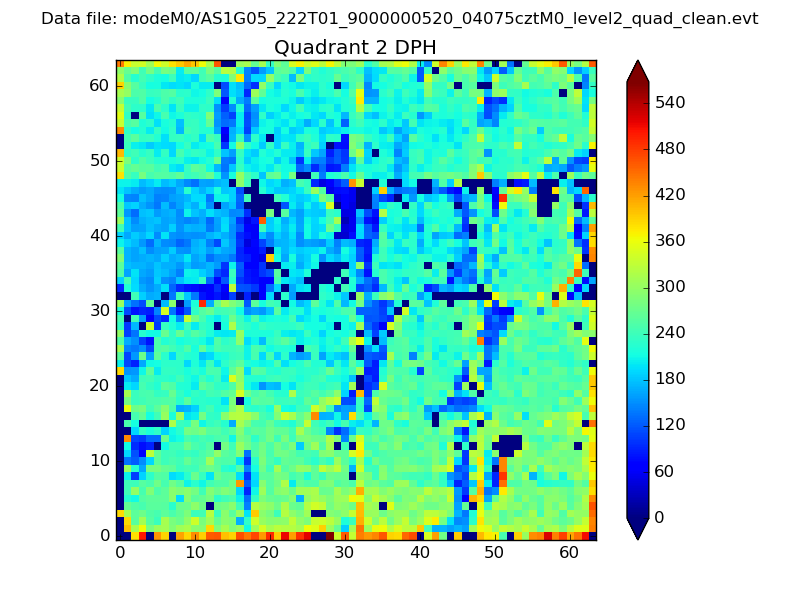 |
Quadrant C |
| Plot type | Count rate plots | Images |
|---|---|---|
| Comparison with Poisson distribution Blue bars denote a histogram of data divided into 1 sec bins. Red curve is a Poisson curve with rate = median count rate of data. |
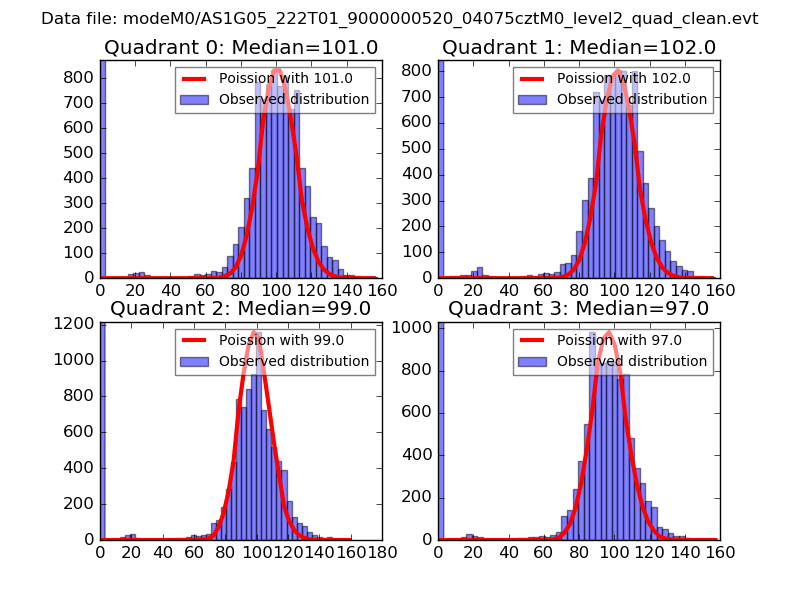 |
 |
| Quadrant-wise count rates Data is divided into 100 sec bins |
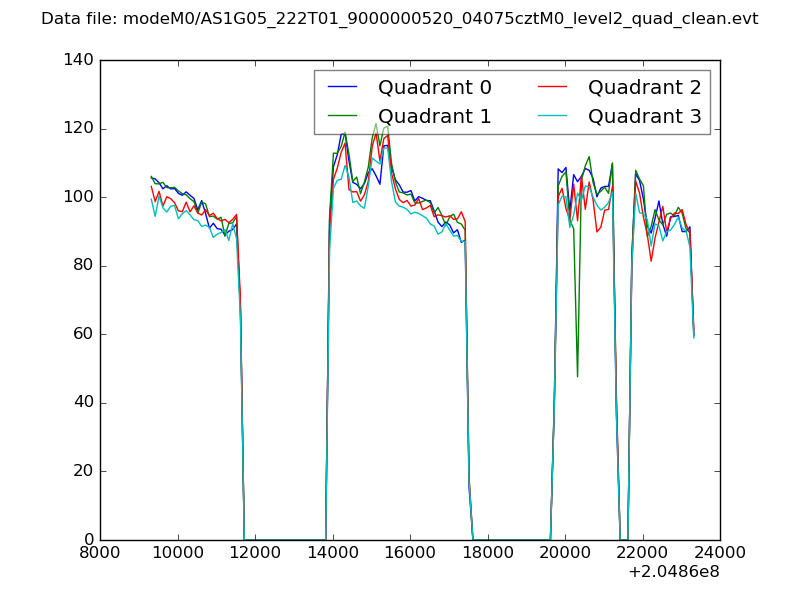 |
|
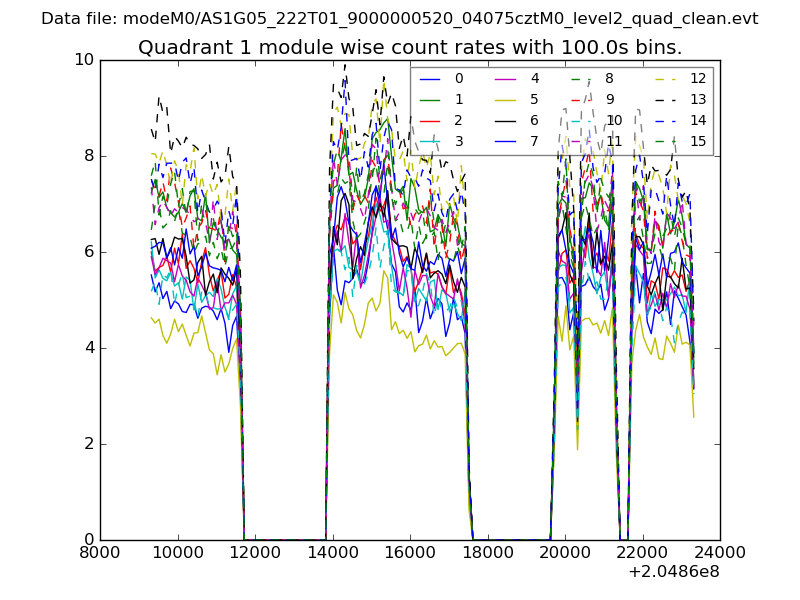
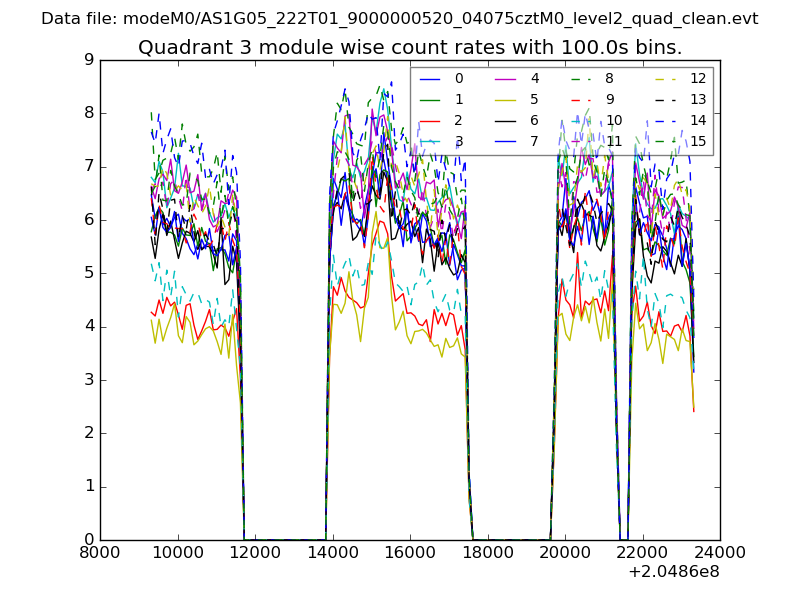
| Module-wise count rates for Quadrant A Data is divided into 100 sec bins |
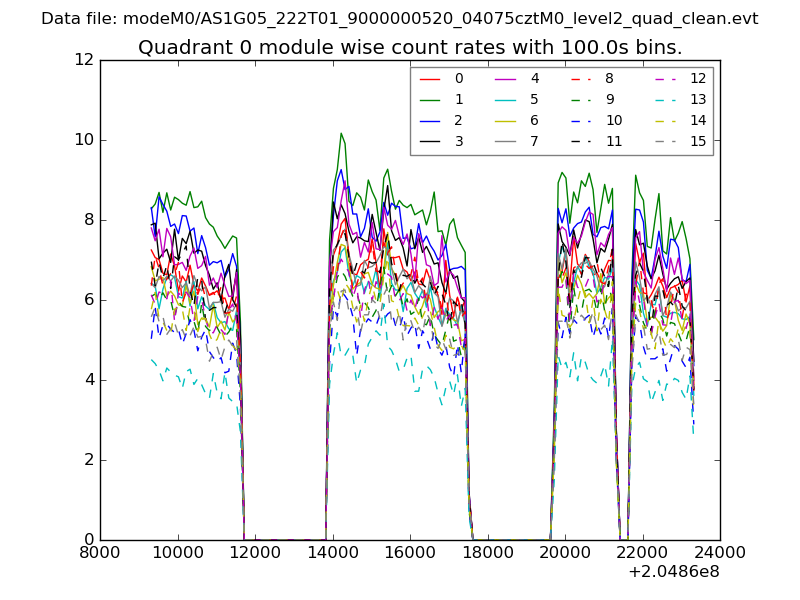 |
 |
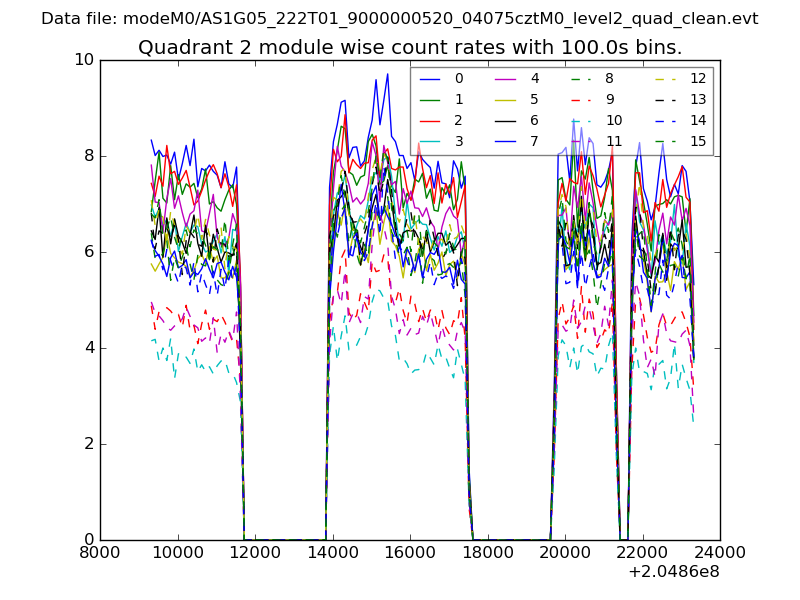
| Module-wise count rates for Quadrant B Data is divided into 100 sec bins |
 |
 |
| Module-wise count rates for Quadrant C Data is divided into 100 sec bins |
 |
 |
| Module-wise count rates for Quadrant D Data is divided into 100 sec bins |
 |
 |
| Parameter | Plot |
|---|---|
| CZT HV Monitor | 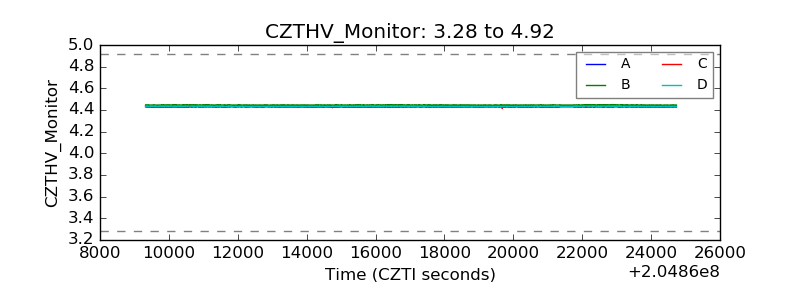 |
| D_VDD | 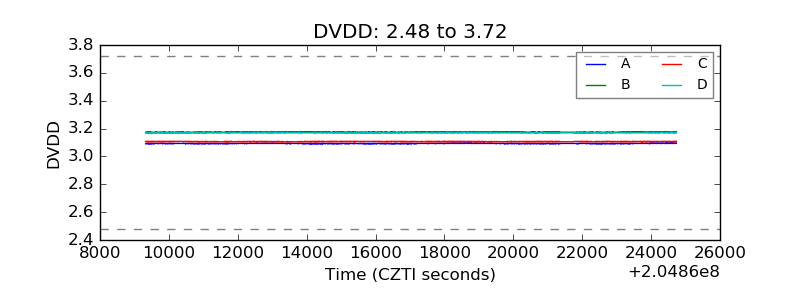 |
| Temperature 1 | 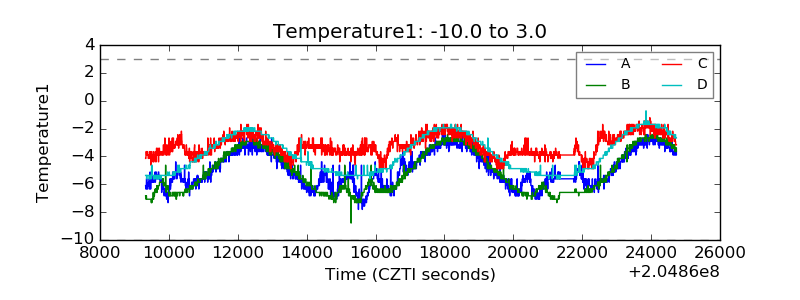 |
| Veto HV Monitor | 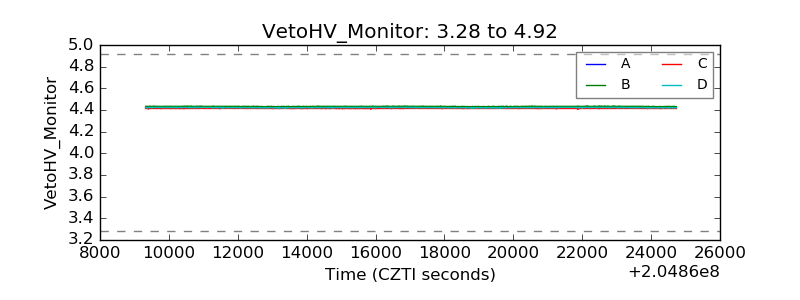 |
| Veto LLD | 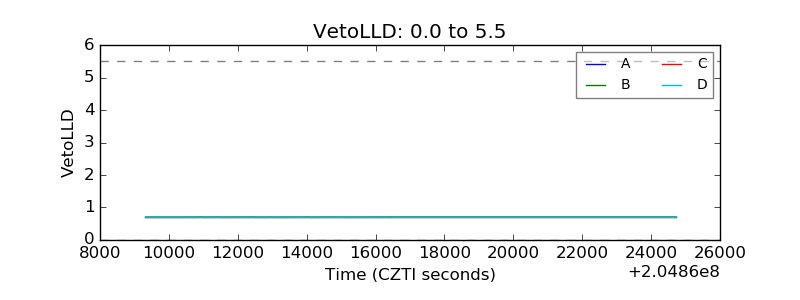 |
| Alpha Counter | 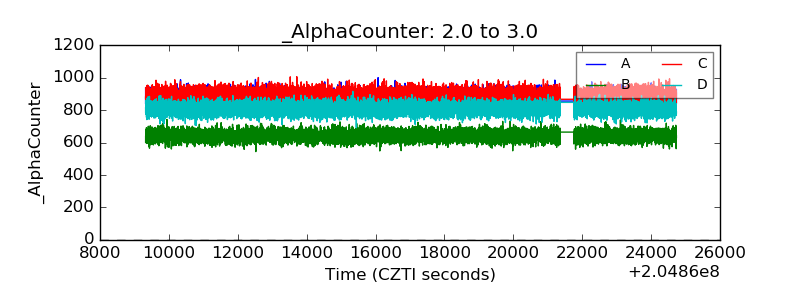 |
| _CPM_Rate | 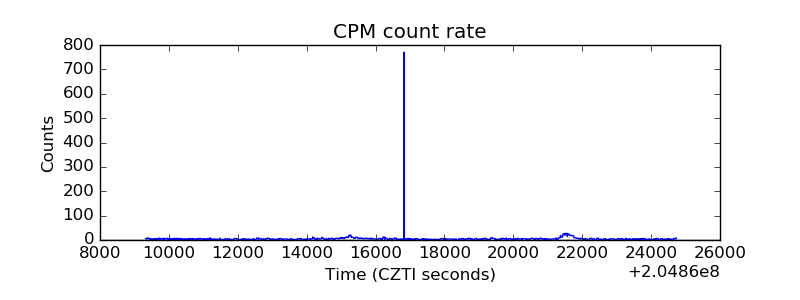 |
| CZT Counter | 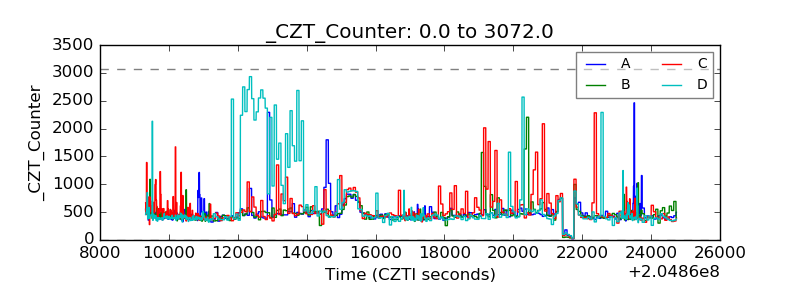 |
| +2.5 Volts monitor |  |
| +5 Volts monitor |  |
| _ROLL_ROT | 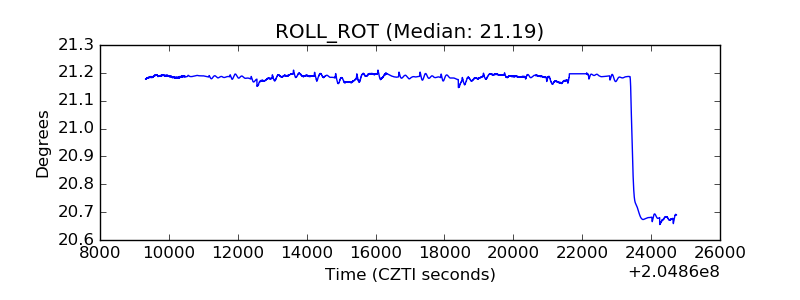 |
| _Roll_DEC | 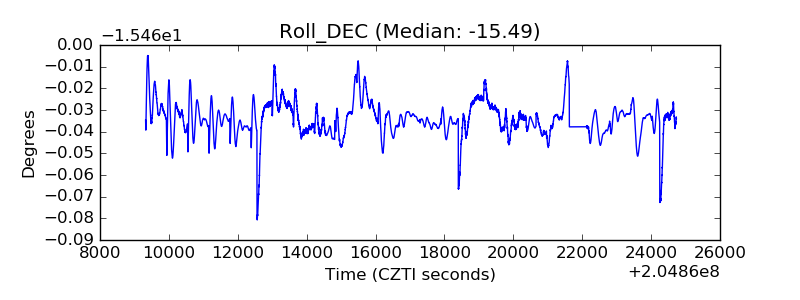 |
| _Roll_RA | 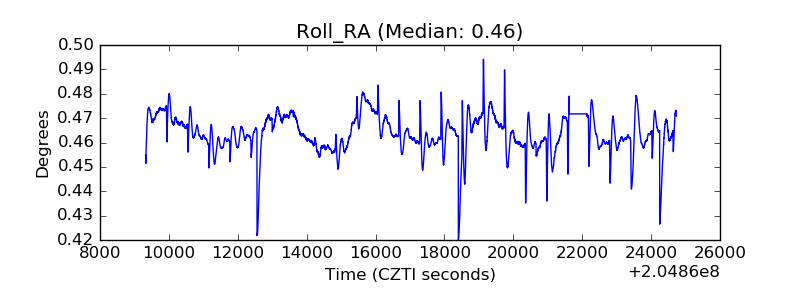 |
| Veto Counter | 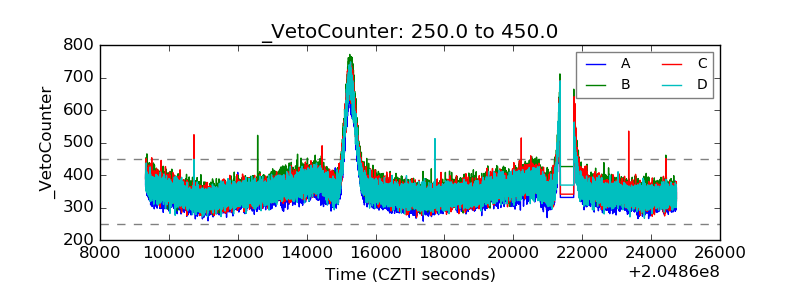 |