| Param | Original file | Final file |
|---|---|---|
| Filename | modeM0/AS1G05_222T01_9000000520_04076cztM0_level2.evt | modeM0/AS1G05_222T01_9000000520_04076cztM0_level2_quad_clean.evt |
| Size (bytes) | 1,102,245,120 | 155,543,040 |
| Size | 1.0 GB | 148.3 MB |
| Events in quadrant A | 8,336,645 | 905,929 |
| Events in quadrant B | 8,383,042 | 909,434 |
| Events in quadrant C | 7,676,271 | 892,528 |
| Events in quadrant D | 7,868,500 | 863,935 |
| Mode M9 | |||
|---|---|---|---|
| Quadrant | BADHDUFLAG | Total packets | Discarded packets |
| A | 0 | 21 | 0 |
| B | 0 | 21 | 0 |
| C | 0 | 21 | 0 |
| D | 0 | 21 | 0 |
| Mode SS | |||
|---|---|---|---|
| Quadrant | BADHDUFLAG | Total packets | Discarded packets |
| A | 0 | 336 | 0 |
| B | 0 | 336 | 0 |
| C | 0 | 336 | 0 |
| D | 0 | 336 | 0 |
| Mode M0 | |||
|---|---|---|---|
| Quadrant | BADHDUFLAG | Total packets | Discarded packets |
| A | 0 | 36064 | 28 |
| B | 0 | 35566 | 15 |
| C | 0 | 34437 | 11 |
| D | 0 | 35521 | 14 |
| Quadrant | Total seconds | Saturated seconds | Saturation percentage |
|---|---|---|---|
| A | 16500 | 469 | 2.842424% |
| B | 16505 | 316 | 1.914571% |
| C | 16505 | 206 | 1.248107% |
| D | 16506 | 263 | 1.593360% |
Noise dominated data is calculated using 1-second bins in cleaned event files. If a bin has >2000 counts, and if more than 50% of those come from <1% of pixels, then it is considered to be noise-dominated and hence unusable.
| Quadrant | # 1 sec bins | Bins with >0 counts | Bins with >2000 counts | High rate bins dominated by noise | Noise dominated (total time) | Noise dominated (detector-on time) | Marked lightcurve |
|---|---|---|---|---|---|---|---|
| A | 18619 | 16509 | 157 | 157 | 0.84% | 0.95% | 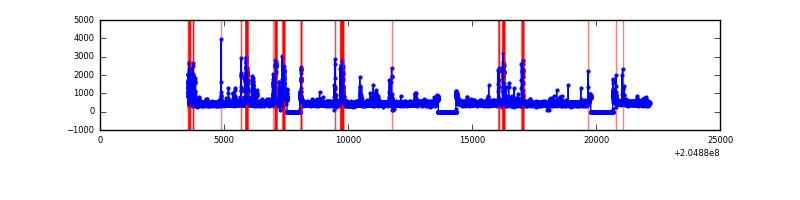 |
| B | 18619 | 16509 | 60 | 60 | 0.32% | 0.36% | 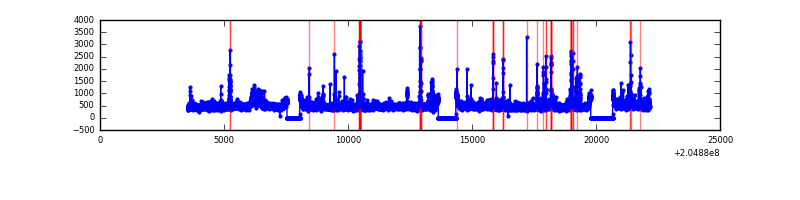 |
| C | 18619 | 16509 | 21 | 21 | 0.11% | 0.13% | 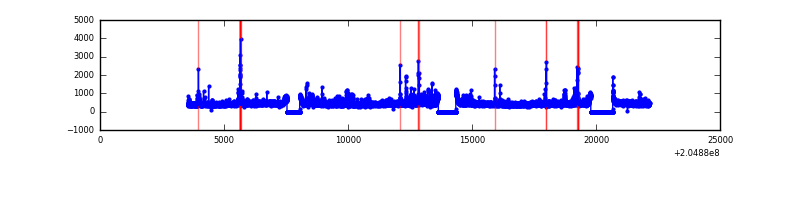 |
| D | 18619 | 16509 | 73 | 73 | 0.39% | 0.44% |  |
Top three noisy pixels from each quadrant. If the there are fewer than three noisy pixels in the level2.evt file, extra rows are filled as -1
| Pixel properties | Quadrant properties | ||||||
|---|---|---|---|---|---|---|---|
| Quadrant | DetID | PixID | Counts | Sigma | Mean | Median | Sigma |
| A | 0 | 50 | 735767 | 1873.11 | 1904 | 1856 | 391.8 |
| A | 0 | 118 | 155600 | 392.39 | 1904 | 1856 | 391.8 |
| A | 8 | 15 | 57732 | 142.61 | 1904 | 1856 | 391.8 |
| B | 10 | 16 | 380125 | 1015.5 | 1927 | 1881 | 372.5 |
| B | 15 | 204 | 239047 | 636.74 | 1927 | 1881 | 372.5 |
| B | 5 | 172 | 69437 | 181.37 | 1927 | 1881 | 372.5 |
| C | 9 | 144 | 384639 | 886.29 | 1856 | 1863 | 431.9 |
| C | 10 | 65 | 24642 | 52.74 | 1856 | 1863 | 431.9 |
| C | 13 | 61 | 15606 | 31.82 | 1856 | 1863 | 431.9 |
| D | 13 | 239 | 256056 | 561.29 | 1855 | 1798 | 453.0 |
| D | 12 | 233 | 134972 | 293.99 | 1855 | 1798 | 453.0 |
| D | 10 | 172 | 111337 | 241.81 | 1855 | 1798 | 453.0 |
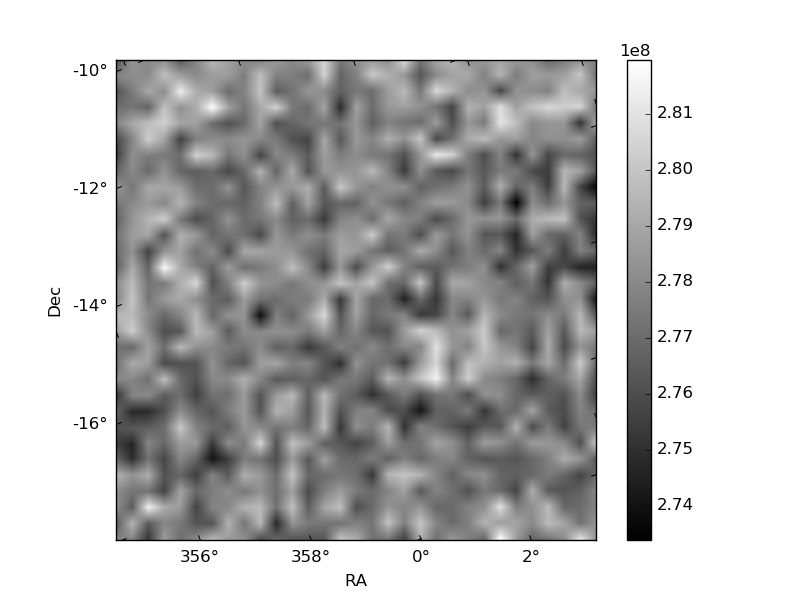
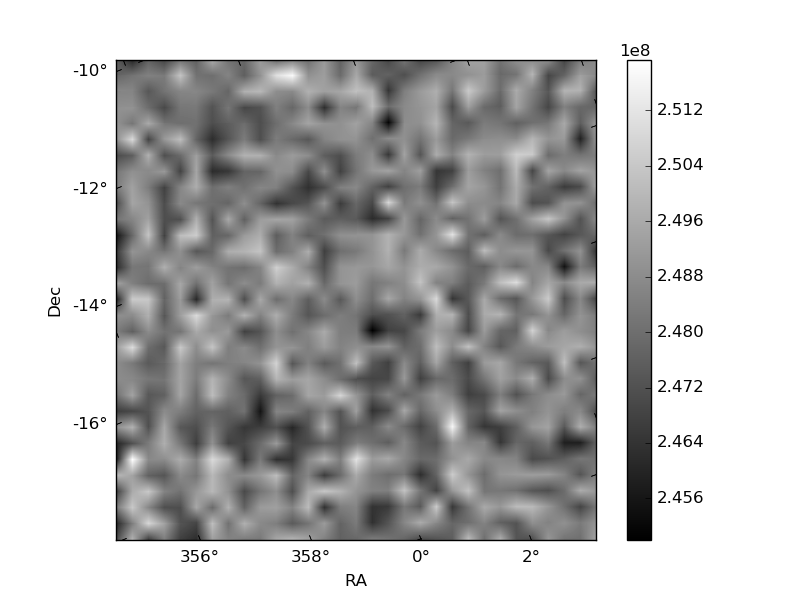
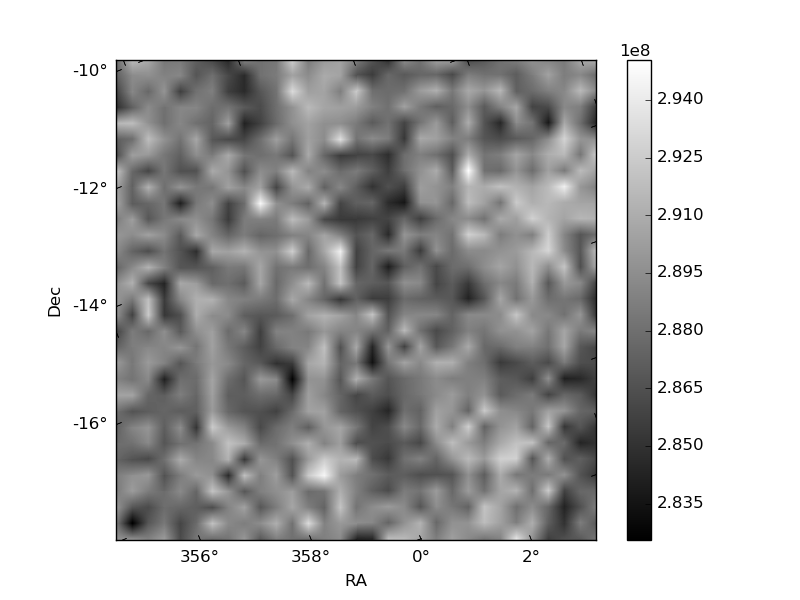
Histogram calculated using DETX and DETY for each event in the final _common_clean file
| Quadrant A | 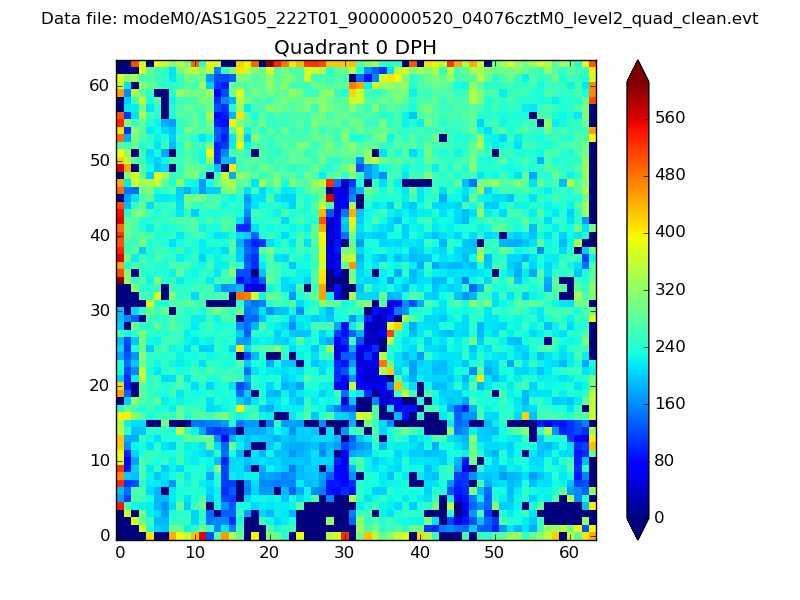 |
 |
Quadrant B |
|---|---|---|---|
| Quadrant D |  |
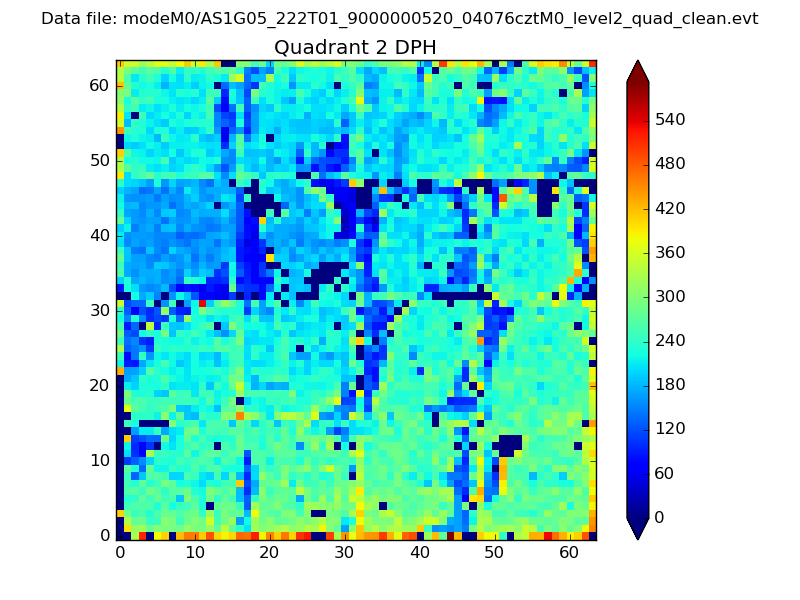 |
Quadrant C |
| Plot type | Count rate plots | Images |
|---|---|---|
| Comparison with Poisson distribution Blue bars denote a histogram of data divided into 1 sec bins. Red curve is a Poisson curve with rate = median count rate of data. |
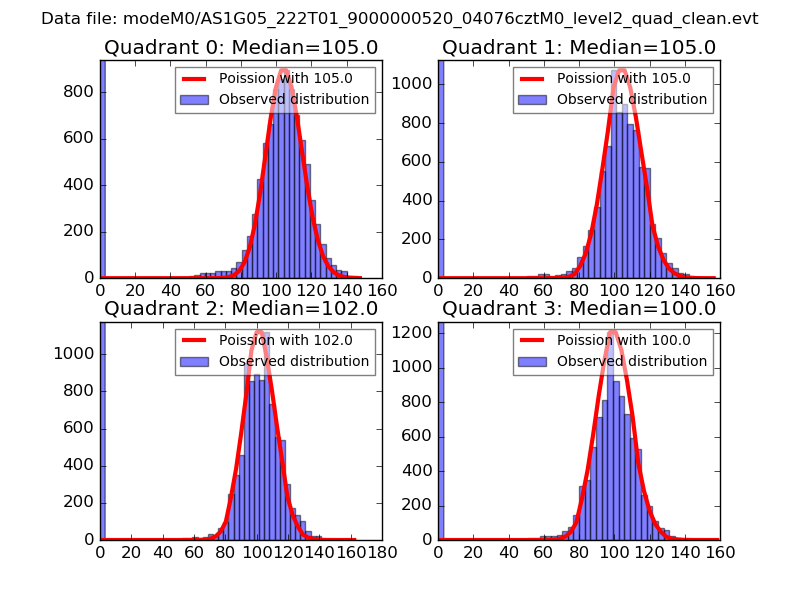 |
 |
| Quadrant-wise count rates Data is divided into 100 sec bins |
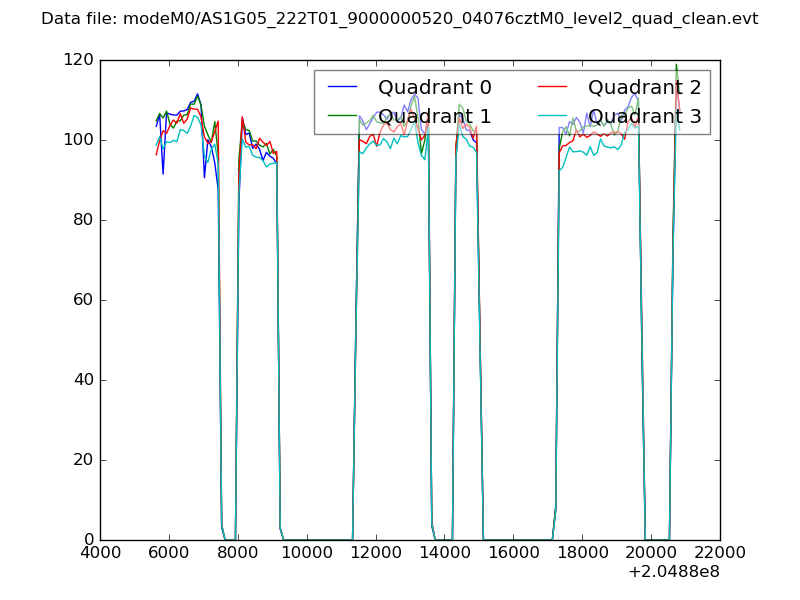 |
|
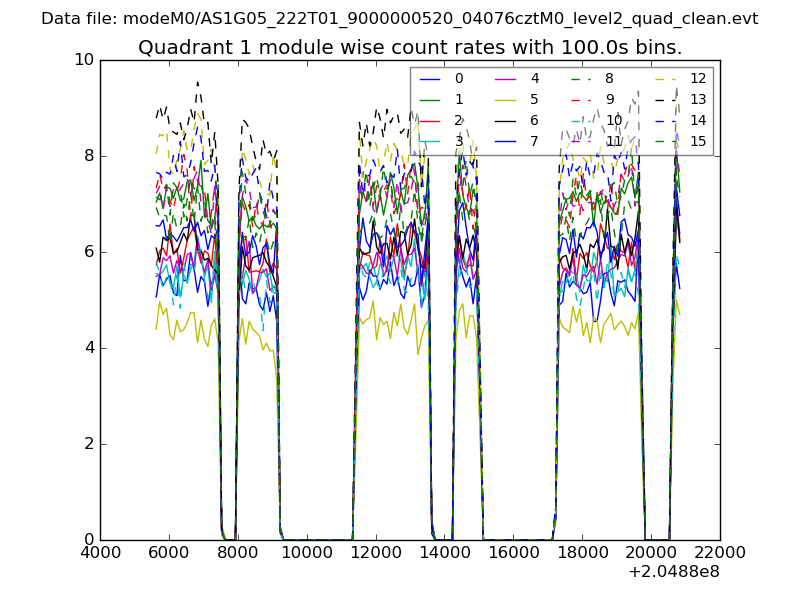
| Module-wise count rates for Quadrant A Data is divided into 100 sec bins |
 |
 |
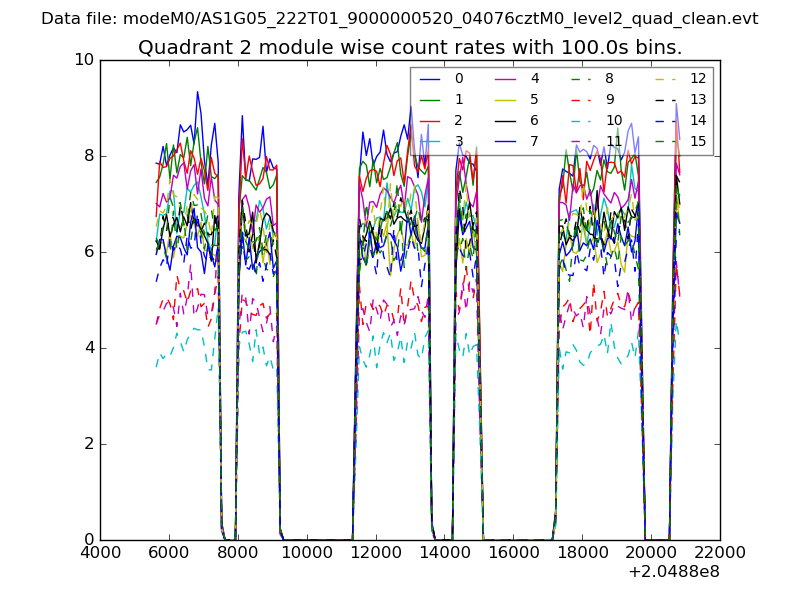
| Module-wise count rates for Quadrant B Data is divided into 100 sec bins |
 |
 |
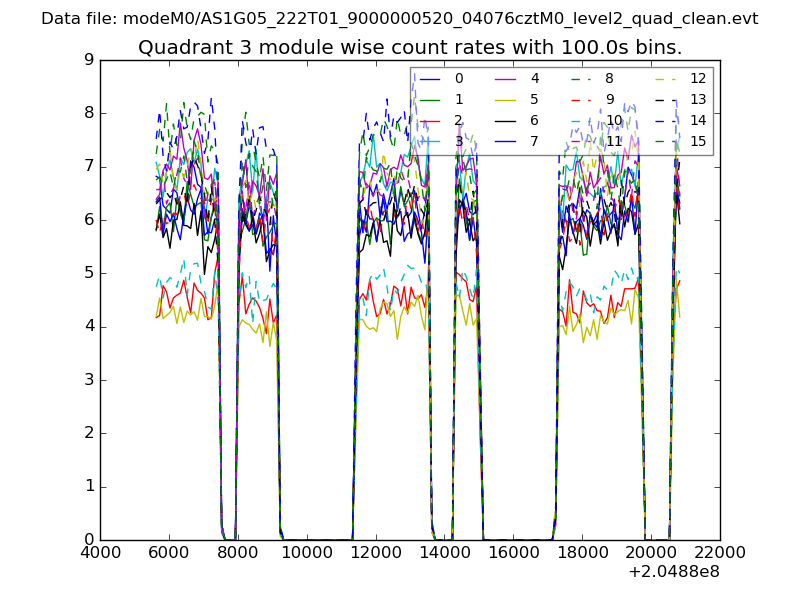
| Module-wise count rates for Quadrant C Data is divided into 100 sec bins |
 |
 |
| Module-wise count rates for Quadrant D Data is divided into 100 sec bins |
 |
 |
| Parameter | Plot |
|---|---|
| CZT HV Monitor | 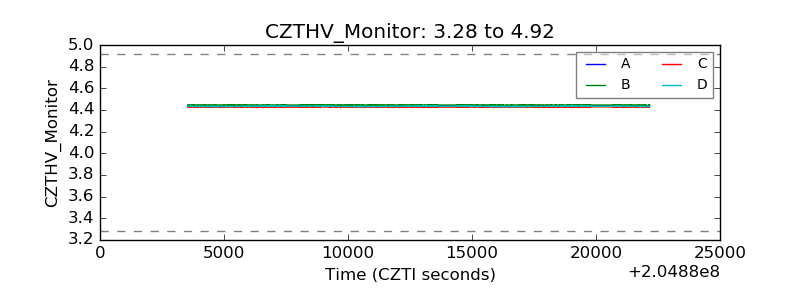 |
| D_VDD | 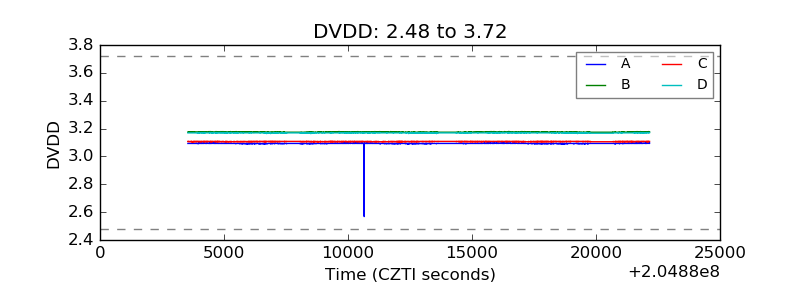 |
| Temperature 1 | 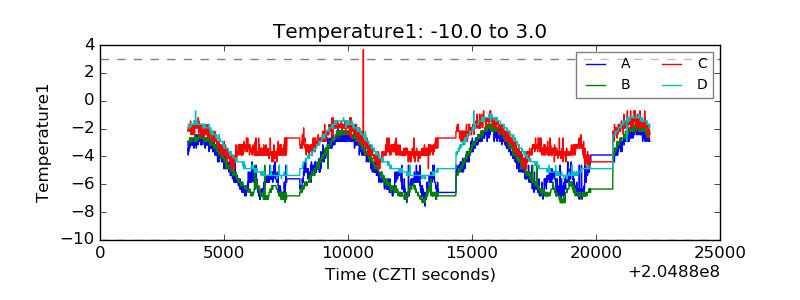 |
| Veto HV Monitor | 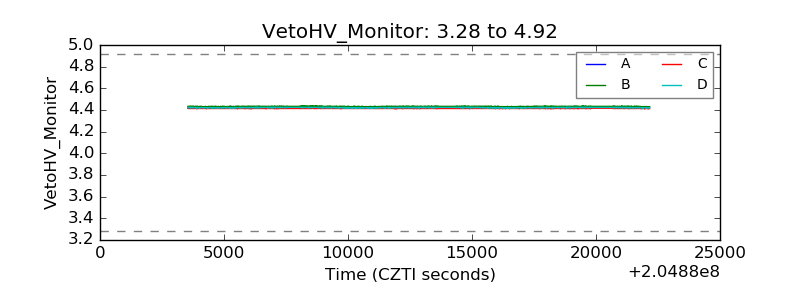 |
| Veto LLD | 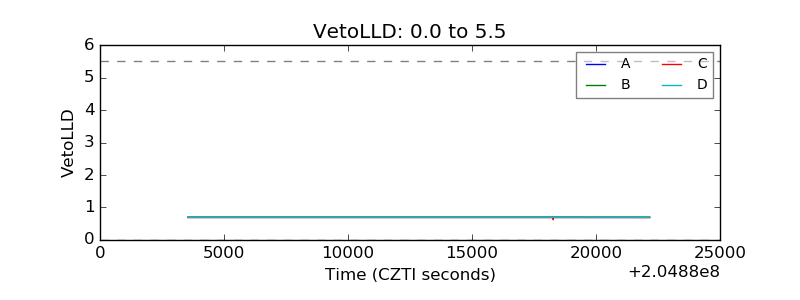 |
| Alpha Counter | 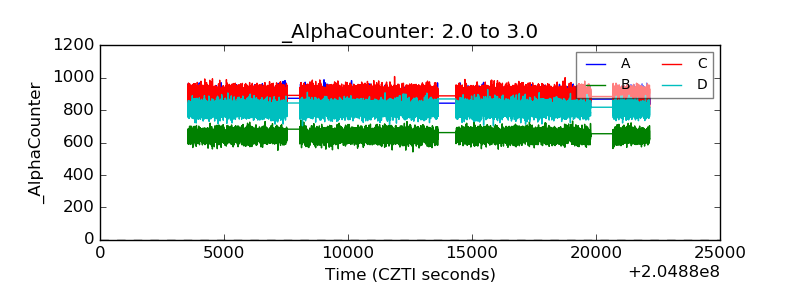 |
| _CPM_Rate | 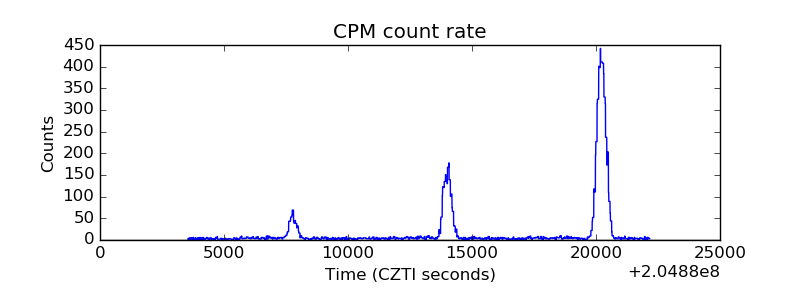 |
| CZT Counter | 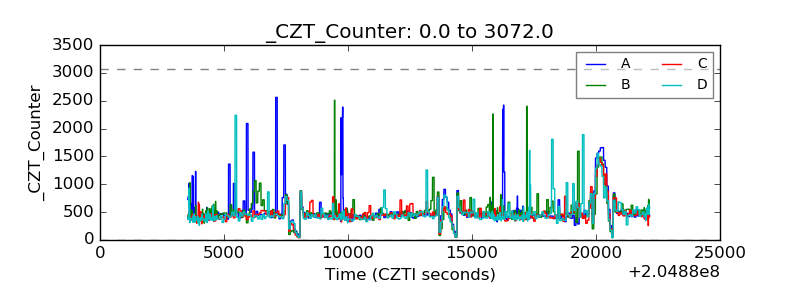 |
| +2.5 Volts monitor |  |
| +5 Volts monitor |  |
| _ROLL_ROT | 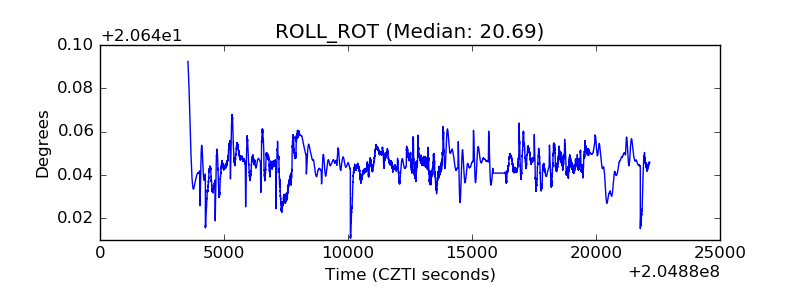 |
| _Roll_DEC | 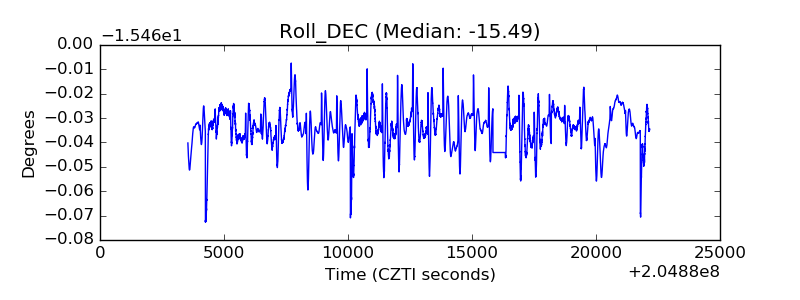 |
| _Roll_RA | 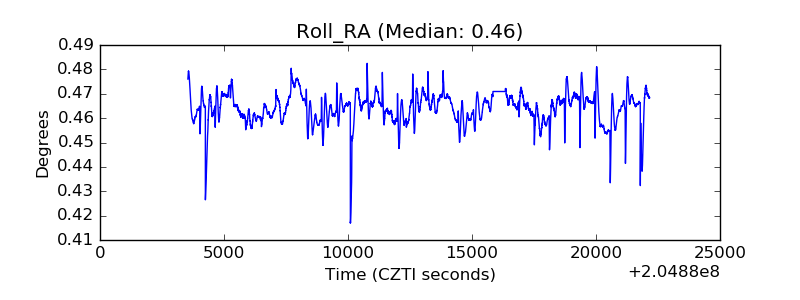 |
| Veto Counter | 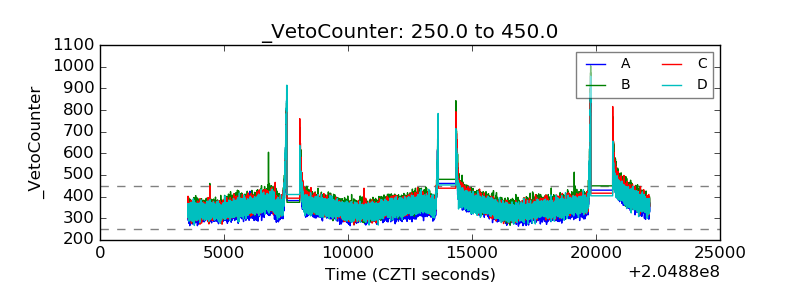 |