| Param | Original file | Final file |
|---|---|---|
| Filename | modeM0/AS1G05_222T01_9000000520_04077cztM0_level2.evt | modeM0/AS1G05_222T01_9000000520_04077cztM0_level2_quad_clean.evt |
| Size (bytes) | 449,642,880 | 52,968,960 |
| Size | 428.8 MB | 50.5 MB |
| Events in quadrant A | 3,104,137 | 297,971 |
| Events in quadrant B | 3,576,719 | 294,960 |
| Events in quadrant C | 3,019,754 | 287,709 |
| Events in quadrant D | 3,485,021 | 279,380 |
| Mode M9 | |||
|---|---|---|---|
| Quadrant | BADHDUFLAG | Total packets | Discarded packets |
| A | 0 | 10 | 0 |
| B | 0 | 10 | 0 |
| C | 0 | 10 | 0 |
| D | 0 | 10 | 0 |
| Mode SS | |||
|---|---|---|---|
| Quadrant | BADHDUFLAG | Total packets | Discarded packets |
| A | 0 | 130 | 0 |
| B | 0 | 130 | 0 |
| C | 0 | 130 | 0 |
| D | 0 | 130 | 0 |
| Mode M0 | |||
|---|---|---|---|
| Quadrant | BADHDUFLAG | Total packets | Discarded packets |
| A | 0 | 13416 | 2 |
| B | 0 | 14678 | 1 |
| C | 0 | 13278 | 1 |
| D | 0 | 14890 | 1 |
| Quadrant | Total seconds | Saturated seconds | Saturation percentage |
|---|---|---|---|
| A | 6350 | 77 | 1.212598% |
| B | 6350 | 152 | 2.393701% |
| C | 6350 | 54 | 0.850394% |
| D | 6350 | 47 | 0.740157% |
Noise dominated data is calculated using 1-second bins in cleaned event files. If a bin has >2000 counts, and if more than 50% of those come from <1% of pixels, then it is considered to be noise-dominated and hence unusable.
| Quadrant | # 1 sec bins | Bins with >0 counts | Bins with >2000 counts | High rate bins dominated by noise | Noise dominated (total time) | Noise dominated (detector-on time) | Marked lightcurve |
|---|---|---|---|---|---|---|---|
| A | 7405 | 6350 | 21 | 21 | 0.28% | 0.33% | 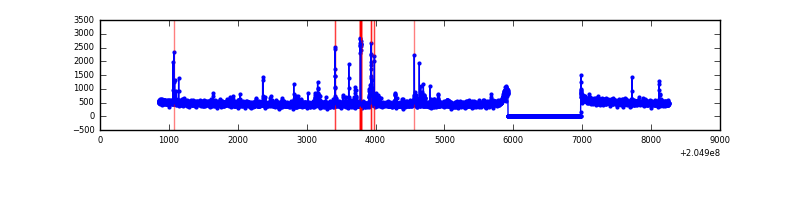 |
| B | 7405 | 6350 | 86 | 86 | 1.16% | 1.35% | 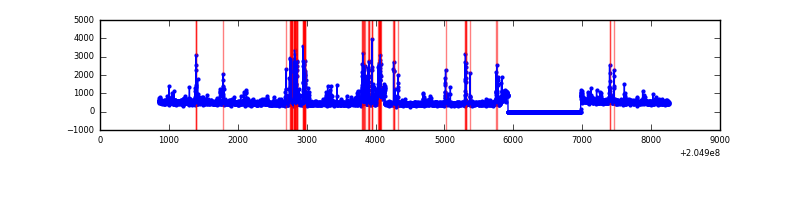 |
| C | 7405 | 6350 | 10 | 10 | 0.14% | 0.16% | 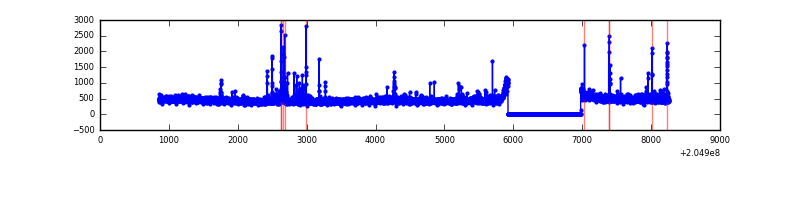 |
| D | 7405 | 6350 | 6 | 6 | 0.08% | 0.09% |  |
Top three noisy pixels from each quadrant. If the there are fewer than three noisy pixels in the level2.evt file, extra rows are filled as -1
| Pixel properties | Quadrant properties | ||||||
|---|---|---|---|---|---|---|---|
| Quadrant | DetID | PixID | Counts | Sigma | Mean | Median | Sigma |
| A | 0 | 50 | 128851 | 826.45 | 750 | 734 | 155.0 |
| A | 15 | 234 | 31809 | 200.46 | 750 | 734 | 155.0 |
| A | 0 | 118 | 25572 | 160.22 | 750 | 734 | 155.0 |
| B | 14 | 167 | 292816 | 1991.39 | 754 | 737 | 146.7 |
| B | 10 | 16 | 220114 | 1495.71 | 754 | 737 | 146.7 |
| B | 15 | 204 | 61682 | 415.52 | 754 | 737 | 146.7 |
| C | 9 | 144 | 183622 | 1078.15 | 724 | 727 | 169.6 |
| C | 12 | 4 | 6267 | 32.66 | 724 | 727 | 169.6 |
| C | 13 | 61 | 6082 | 31.57 | 724 | 727 | 169.6 |
| D | 2 | 232 | 529021 | 2982.36 | 726 | 705 | 177.1 |
| D | 7 | 53 | 125251 | 703.07 | 726 | 705 | 177.1 |
| D | 12 | 233 | 39298 | 217.86 | 726 | 705 | 177.1 |
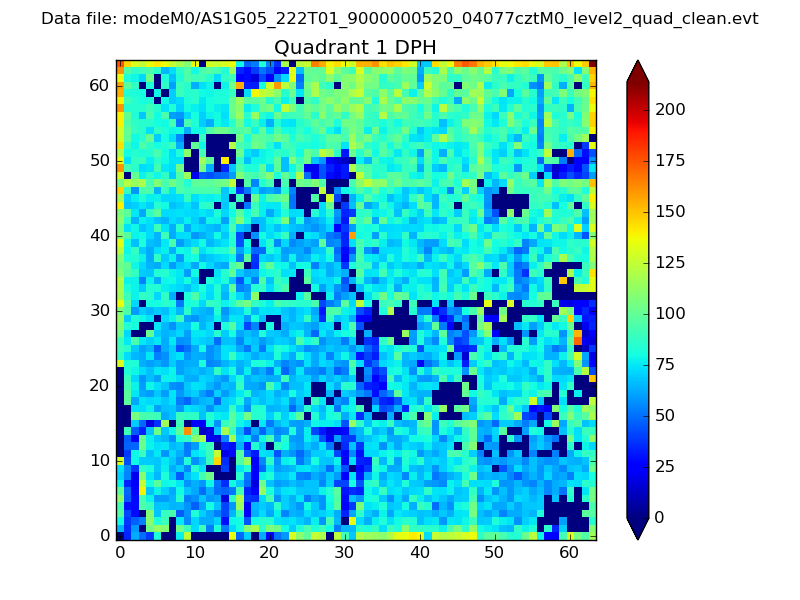
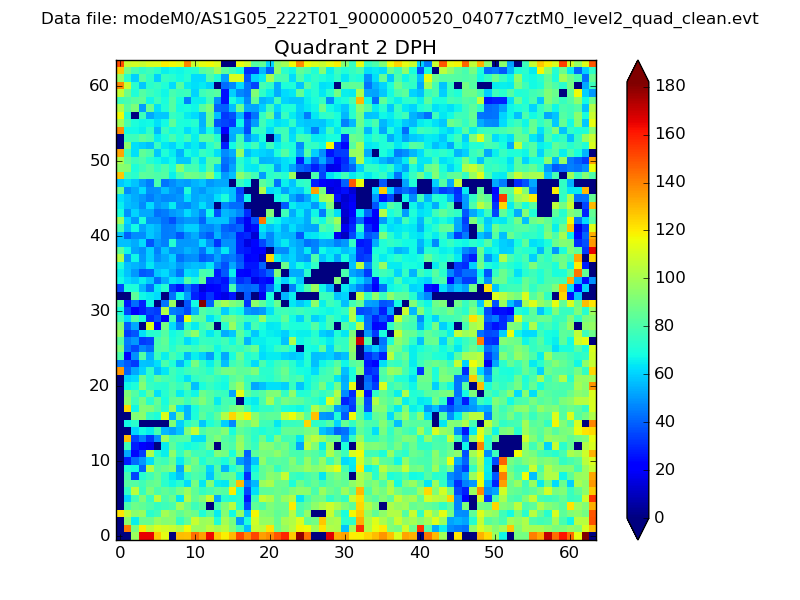
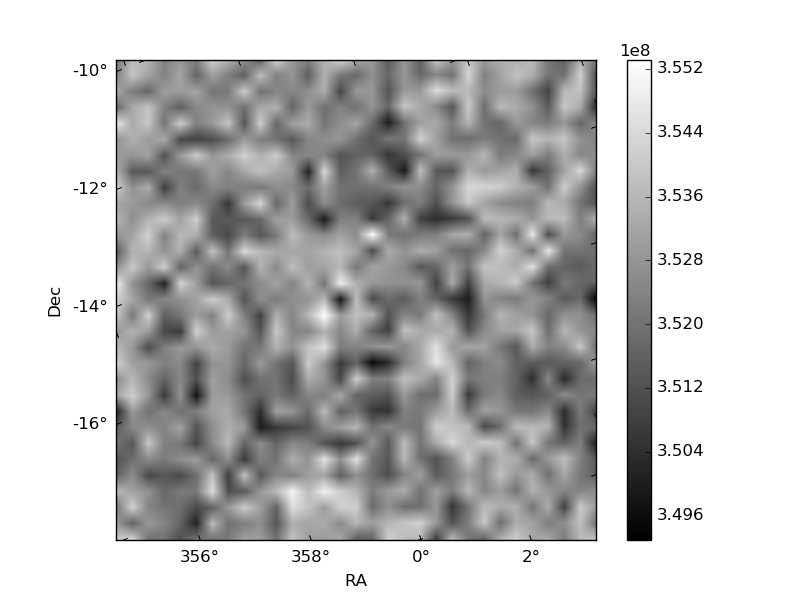
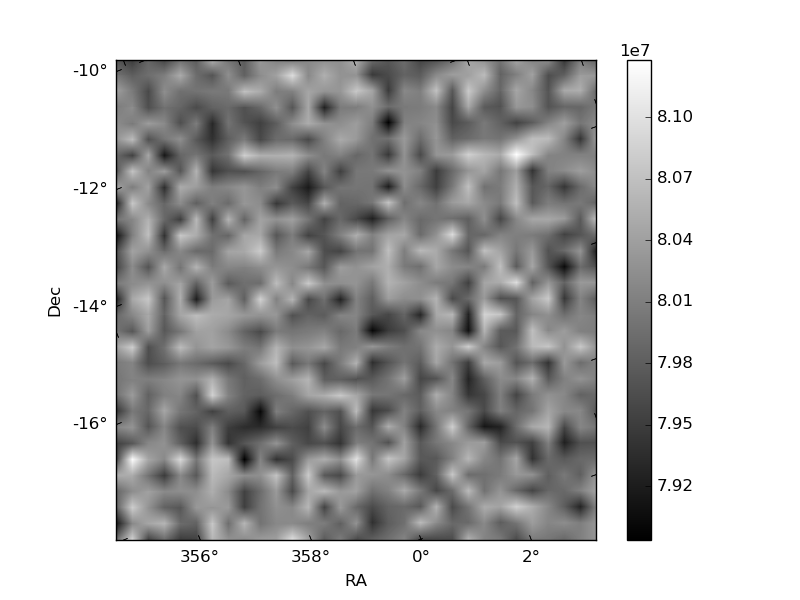
Histogram calculated using DETX and DETY for each event in the final _common_clean file
| Quadrant A | 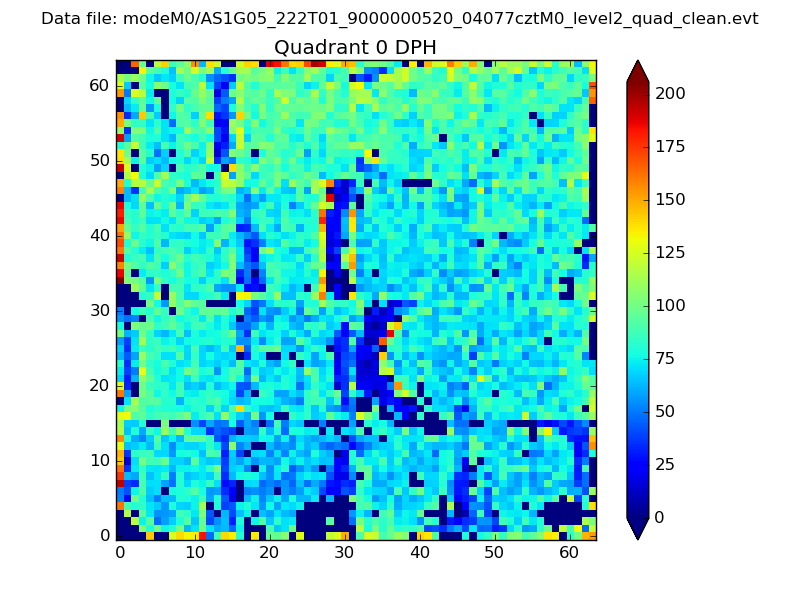 |
 |
Quadrant B |
|---|---|---|---|
| Quadrant D | 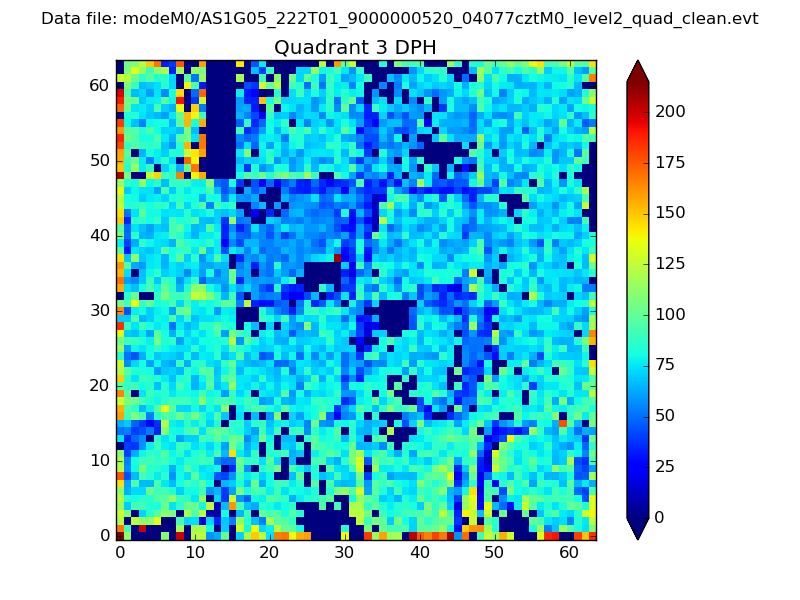 |
 |
Quadrant C |
| Plot type | Count rate plots | Images |
|---|---|---|
| Comparison with Poisson distribution Blue bars denote a histogram of data divided into 1 sec bins. Red curve is a Poisson curve with rate = median count rate of data. |
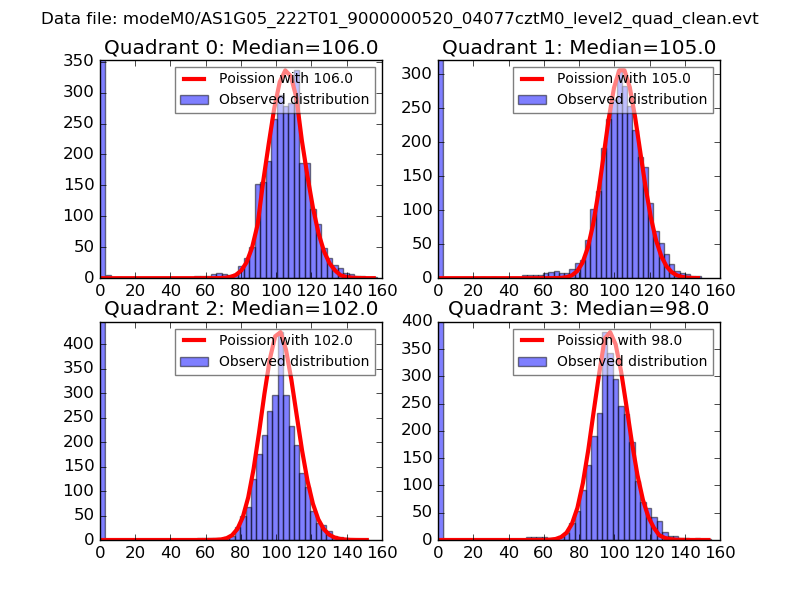 |
 |
| Quadrant-wise count rates Data is divided into 100 sec bins |
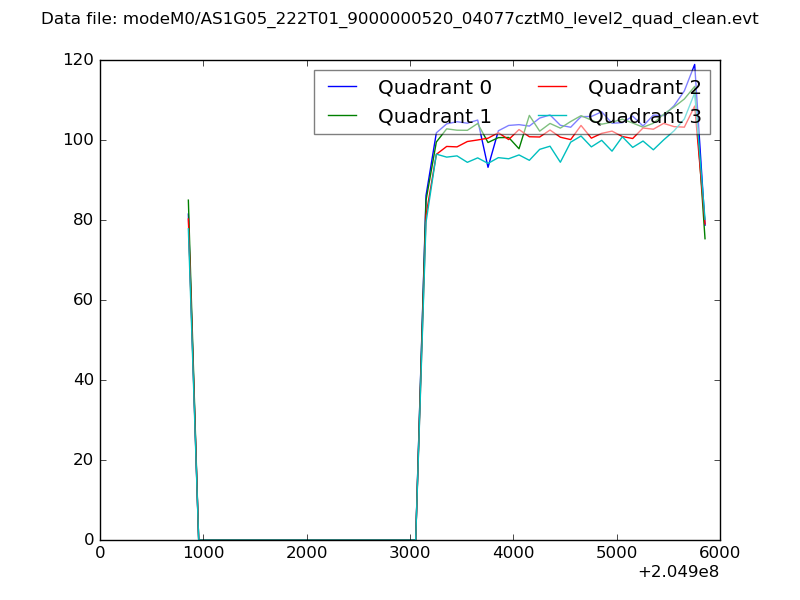 |
|
| Module-wise count rates for Quadrant A Data is divided into 100 sec bins |
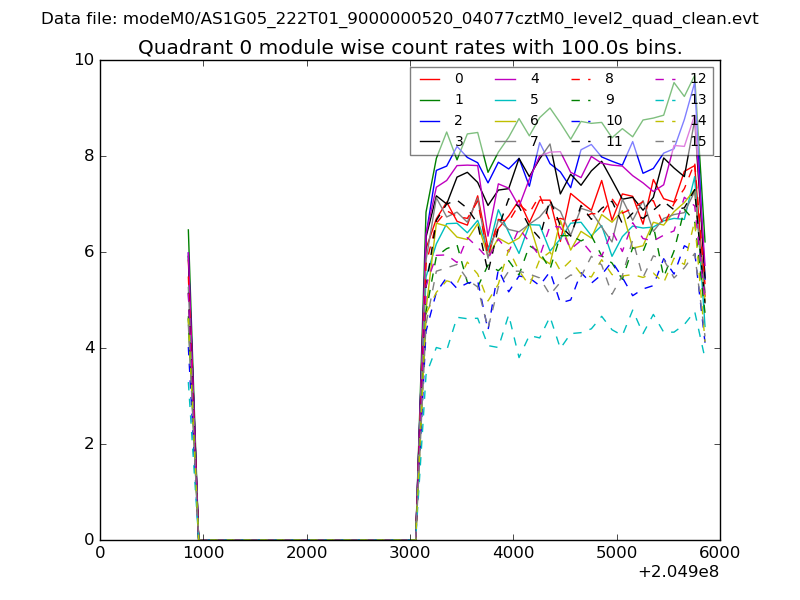 |
 |
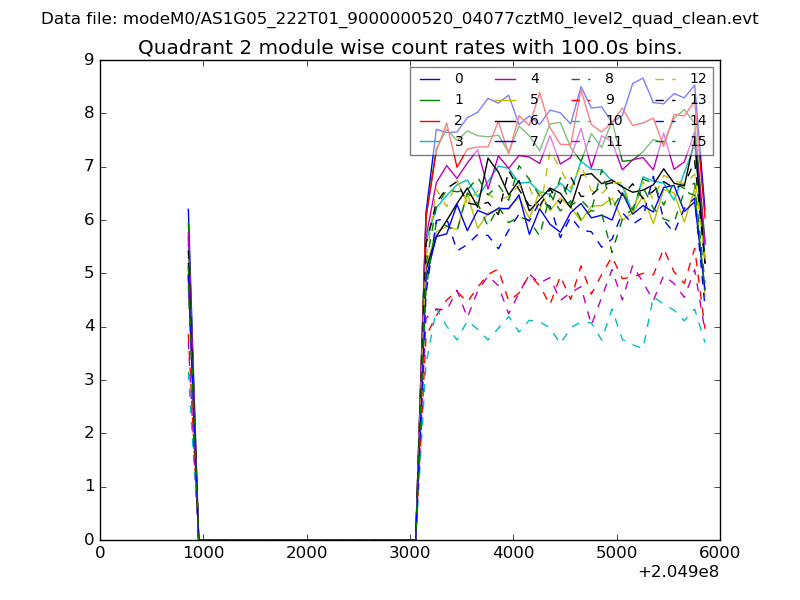
| Module-wise count rates for Quadrant B Data is divided into 100 sec bins |
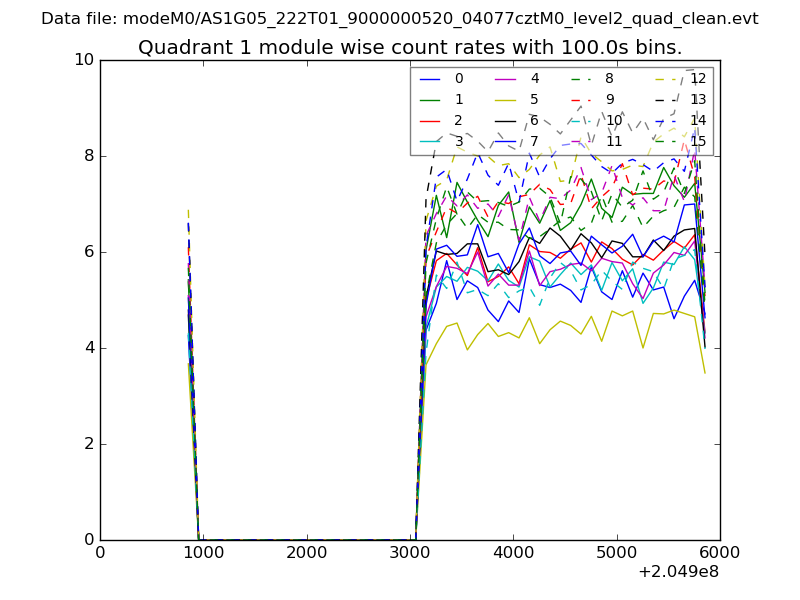 |
 |
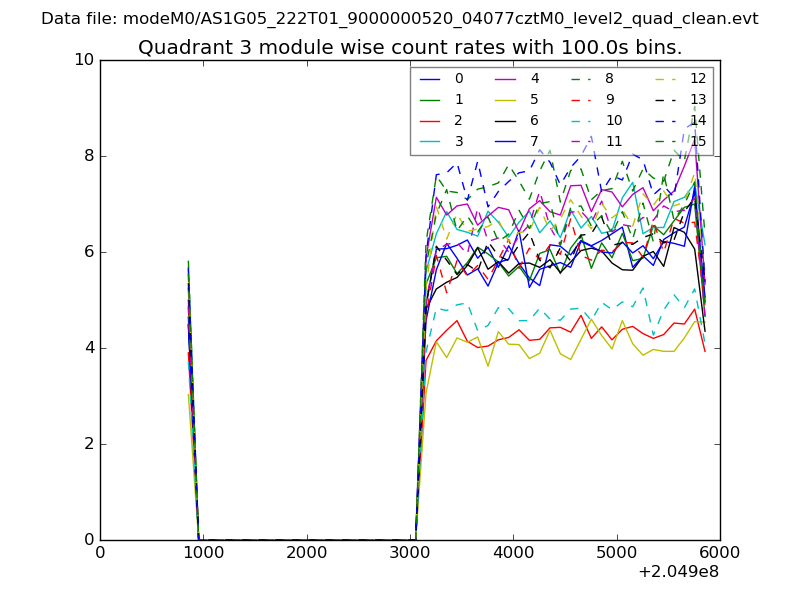
| Module-wise count rates for Quadrant C Data is divided into 100 sec bins |
 |
 |
| Module-wise count rates for Quadrant D Data is divided into 100 sec bins |
 |
 |
| Parameter | Plot |
|---|---|
| CZT HV Monitor | 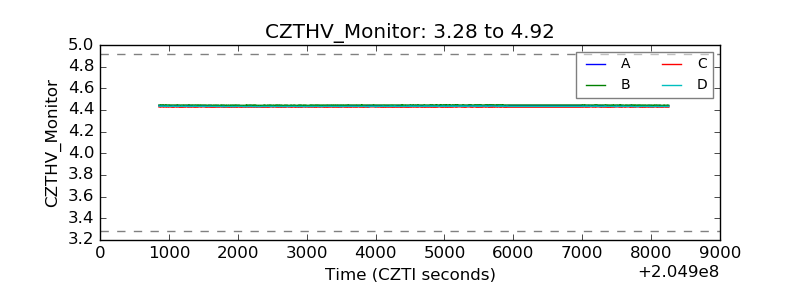 |
| D_VDD | 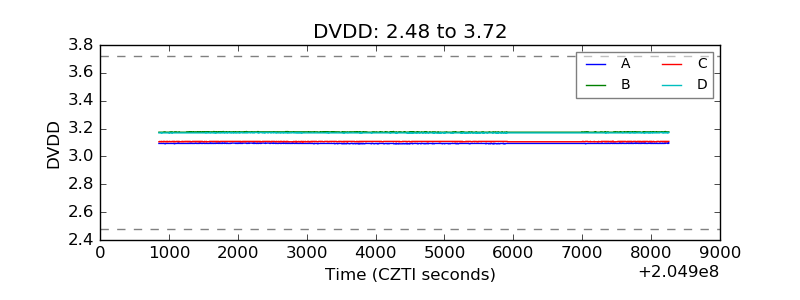 |
| Temperature 1 | 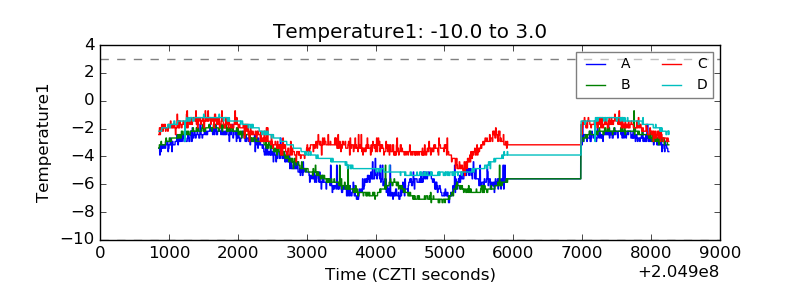 |
| Veto HV Monitor | 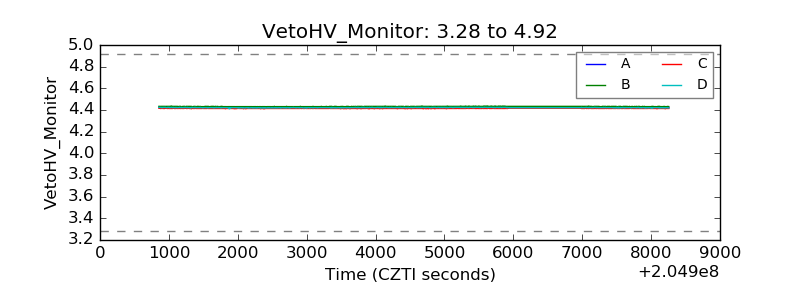 |
| Veto LLD | 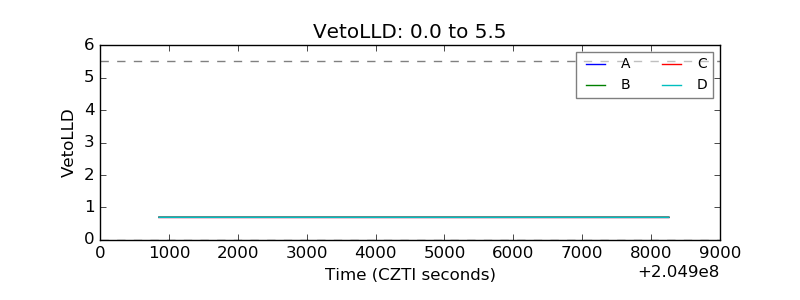 |
| Alpha Counter | 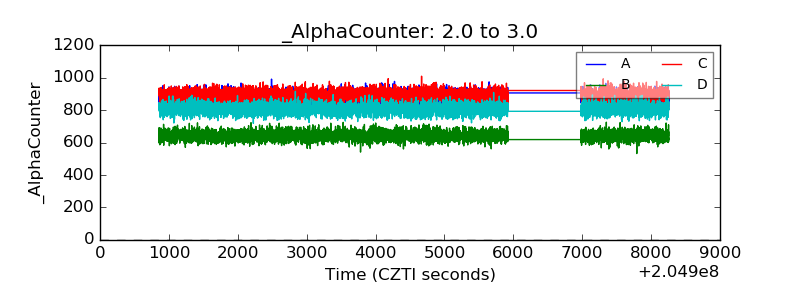 |
| _CPM_Rate | 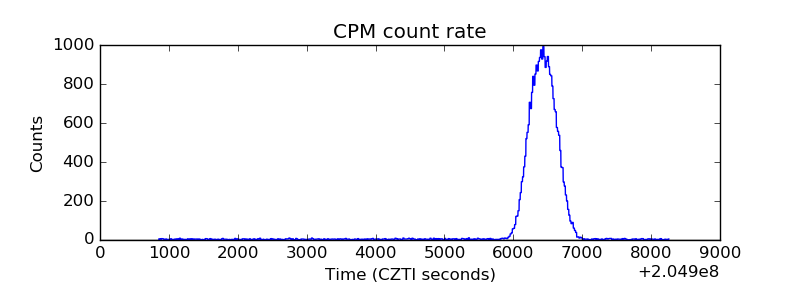 |
| CZT Counter | 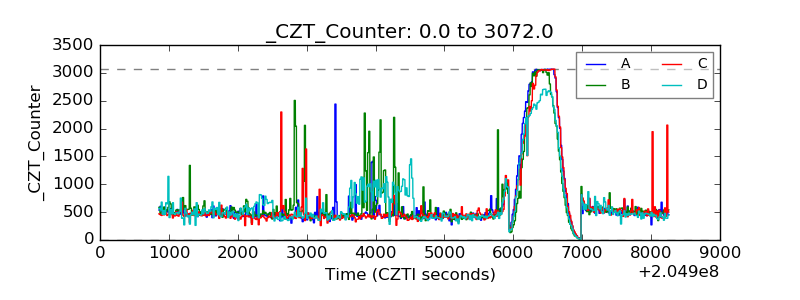 |
| +2.5 Volts monitor |  |
| +5 Volts monitor | 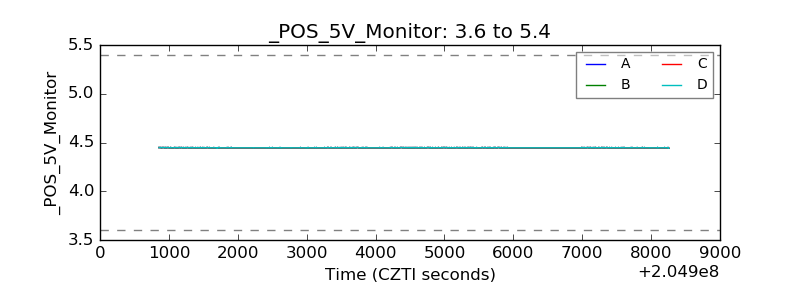 |
| _ROLL_ROT | 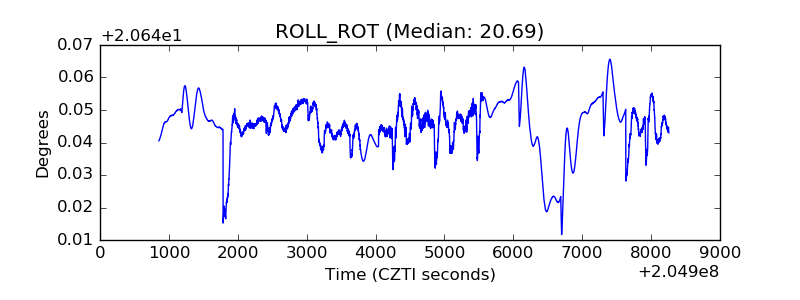 |
| _Roll_DEC | 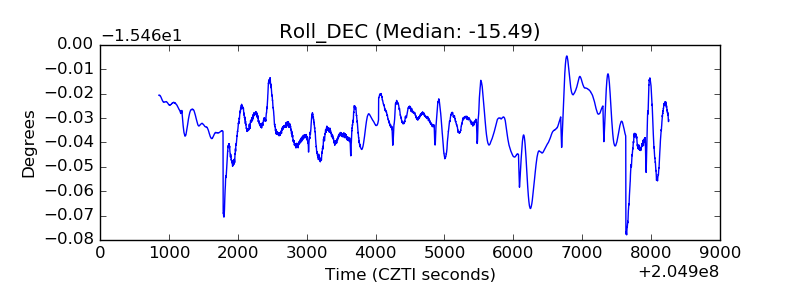 |
| _Roll_RA | 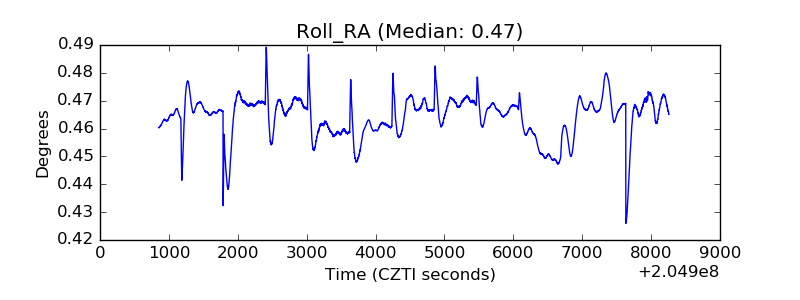 |
| Veto Counter | 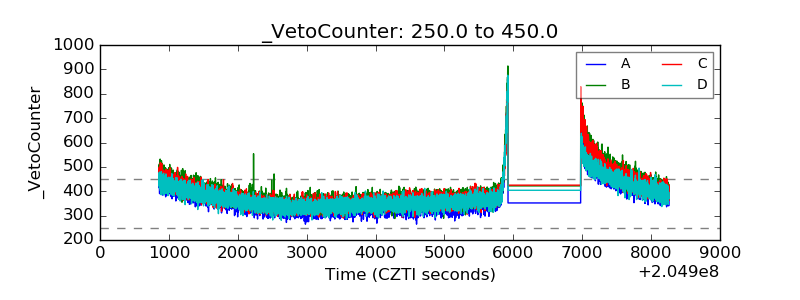 |