| Param | Original file | Final file |
|---|---|---|
| Filename | modeM0/AS1G05_222T01_9000000520_04079cztM0_level2.evt | modeM0/AS1G05_222T01_9000000520_04079cztM0_level2_quad_clean.evt |
| Size (bytes) | 431,968,320 | 56,286,720 |
| Size | 412.0 MB | 53.7 MB |
| Events in quadrant A | 3,163,354 | 322,561 |
| Events in quadrant B | 3,288,575 | 322,894 |
| Events in quadrant C | 3,063,619 | 313,605 |
| Events in quadrant D | 3,138,967 | 305,781 |
| Mode M9 | |||
|---|---|---|---|
| Quadrant | BADHDUFLAG | Total packets | Discarded packets |
| A | 0 | 19 | 0 |
| B | 0 | 19 | 0 |
| C | 0 | 19 | 0 |
| D | 0 | 20 | 0 |
| Mode SS | |||
|---|---|---|---|
| Quadrant | BADHDUFLAG | Total packets | Discarded packets |
| A | 0 | 128 | 0 |
| B | 0 | 128 | 0 |
| C | 0 | 128 | 0 |
| D | 0 | 128 | 0 |
| Mode M0 | |||
|---|---|---|---|
| Quadrant | BADHDUFLAG | Total packets | Discarded packets |
| A | 0 | 13578 | 3 |
| B | 0 | 13899 | 2 |
| C | 0 | 13327 | 2 |
| D | 0 | 13740 | 2 |
| Quadrant | Total seconds | Saturated seconds | Saturation percentage |
|---|---|---|---|
| A | 6290 | 74 | 1.176471% |
| B | 6290 | 74 | 1.176471% |
| C | 6290 | 48 | 0.763116% |
| D | 6290 | 56 | 0.890302% |
Noise dominated data is calculated using 1-second bins in cleaned event files. If a bin has >2000 counts, and if more than 50% of those come from <1% of pixels, then it is considered to be noise-dominated and hence unusable.
| Quadrant | # 1 sec bins | Bins with >0 counts | Bins with >2000 counts | High rate bins dominated by noise | Noise dominated (total time) | Noise dominated (detector-on time) | Marked lightcurve |
|---|---|---|---|---|---|---|---|
| A | 7475 | 6290 | 26 | 26 | 0.35% | 0.41% | 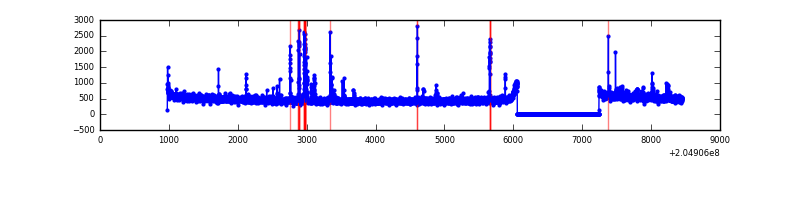 |
| B | 7475 | 6290 | 25 | 25 | 0.33% | 0.40% | 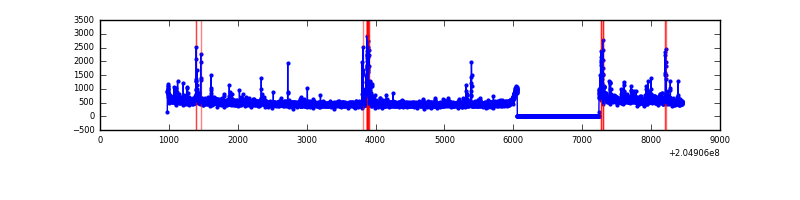 |
| C | 7475 | 6290 | 23 | 23 | 0.31% | 0.37% | 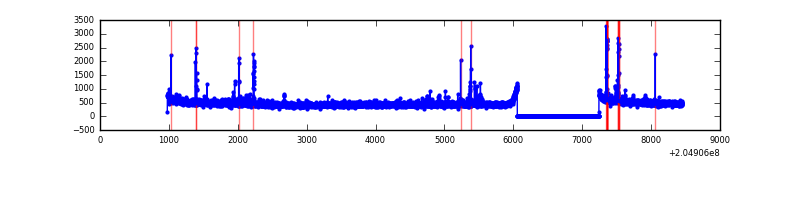 |
| D | 7475 | 6291 | 39 | 39 | 0.52% | 0.62% | 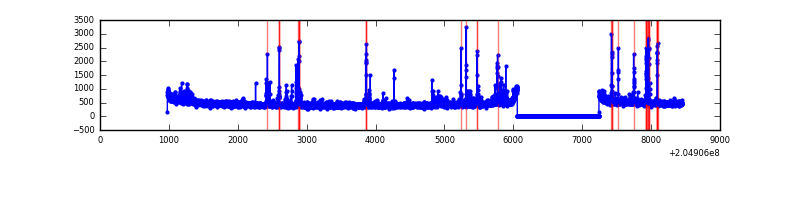 |
Top three noisy pixels from each quadrant. If the there are fewer than three noisy pixels in the level2.evt file, extra rows are filled as -1
| Pixel properties | Quadrant properties | ||||||
|---|---|---|---|---|---|---|---|
| Quadrant | DetID | PixID | Counts | Sigma | Mean | Median | Sigma |
| A | 0 | 50 | 100139 | 636.79 | 766 | 748 | 156.1 |
| A | 0 | 118 | 96328 | 612.38 | 766 | 748 | 156.1 |
| A | 0 | 226 | 16560 | 101.3 | 766 | 748 | 156.1 |
| B | 10 | 16 | 73524 | 491.74 | 776 | 759 | 148.0 |
| B | 14 | 167 | 72871 | 487.33 | 776 | 759 | 148.0 |
| B | 15 | 54 | 52697 | 350.99 | 776 | 759 | 148.0 |
| C | 9 | 144 | 174799 | 1013.2 | 739 | 742 | 171.8 |
| C | 13 | 61 | 6210 | 31.83 | 739 | 742 | 171.8 |
| C | 12 | 4 | 3366 | 15.27 | 739 | 742 | 171.8 |
| D | 13 | 53 | 117606 | 652.86 | 740 | 719 | 179.0 |
| D | 2 | 232 | 72931 | 403.33 | 740 | 719 | 179.0 |
| D | 10 | 172 | 59765 | 329.79 | 740 | 719 | 179.0 |
Histogram calculated using DETX and DETY for each event in the final _common_clean file
| Quadrant A |  |
 |
Quadrant B |
|---|---|---|---|
| Quadrant D |  |
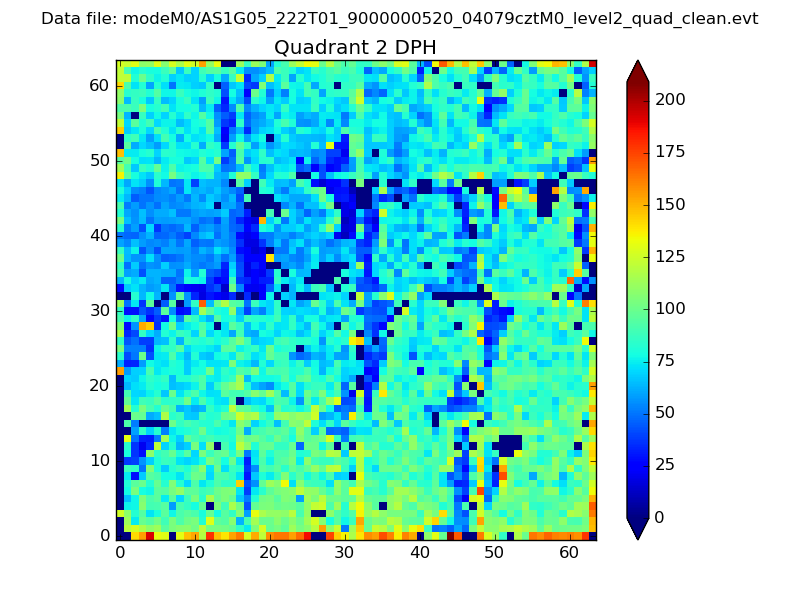 |
Quadrant C |
| Plot type | Count rate plots | Images |
|---|---|---|
| Comparison with Poisson distribution Blue bars denote a histogram of data divided into 1 sec bins. Red curve is a Poisson curve with rate = median count rate of data. |
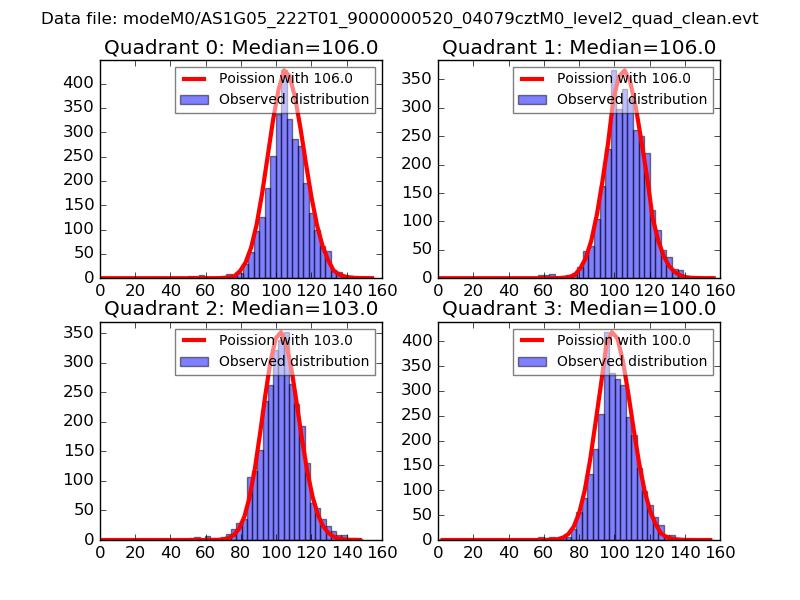 |
 |
| Quadrant-wise count rates Data is divided into 100 sec bins |
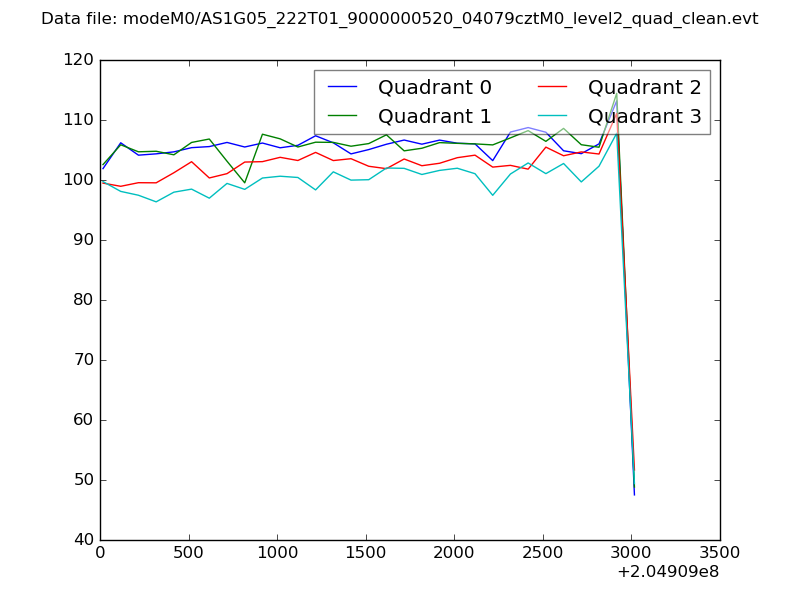 |
|
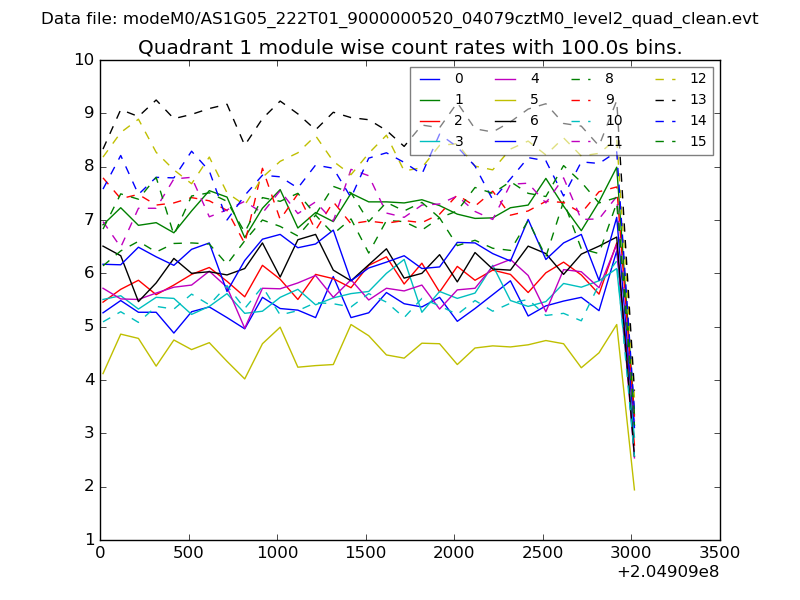
| Module-wise count rates for Quadrant A Data is divided into 100 sec bins |
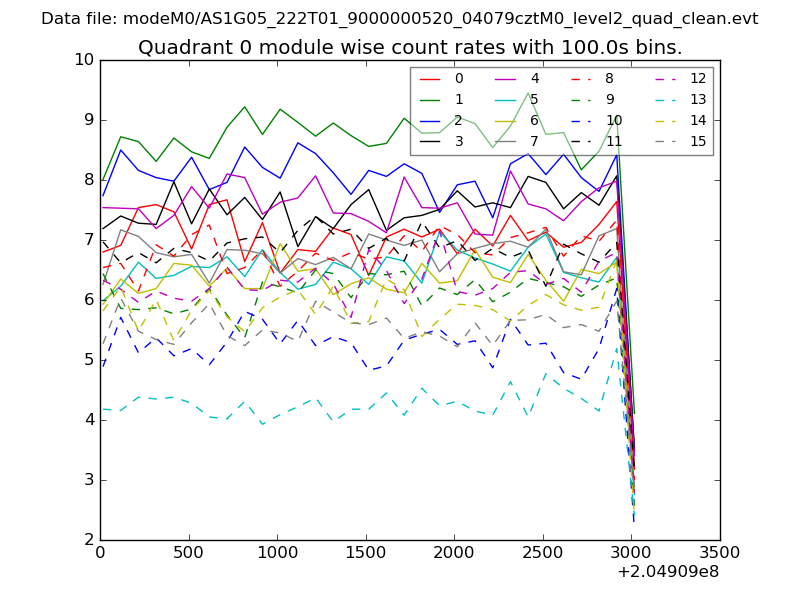 |
 |
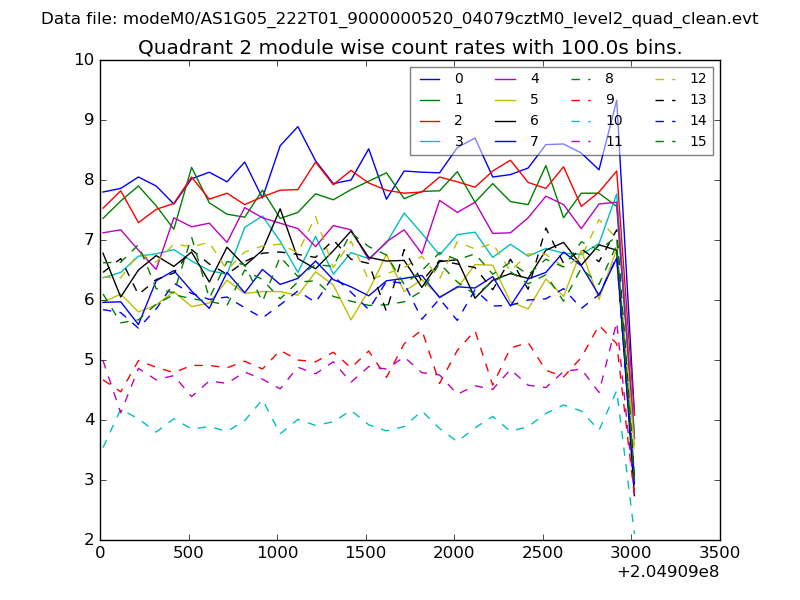
| Module-wise count rates for Quadrant B Data is divided into 100 sec bins |
 |
 |
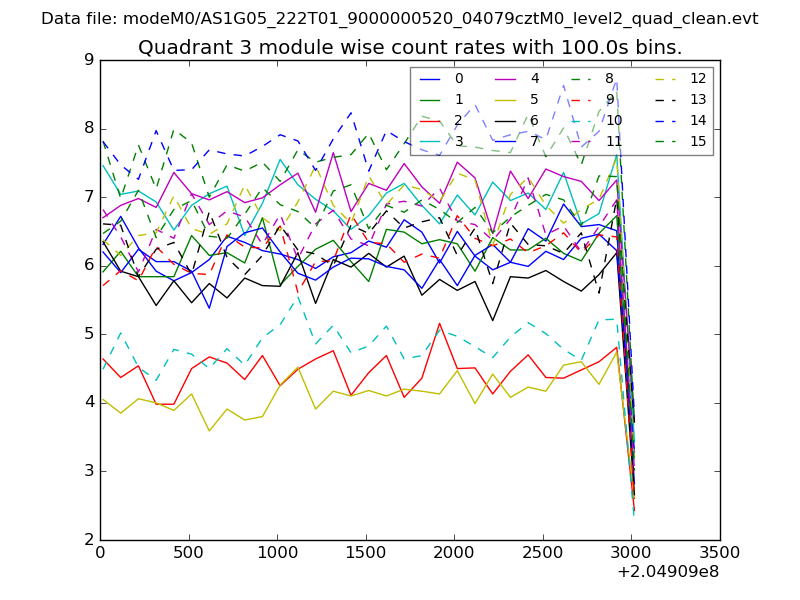
| Module-wise count rates for Quadrant C Data is divided into 100 sec bins |
 |
 |
| Module-wise count rates for Quadrant D Data is divided into 100 sec bins |
 |
 |
| Parameter | Plot |
|---|---|
| CZT HV Monitor | 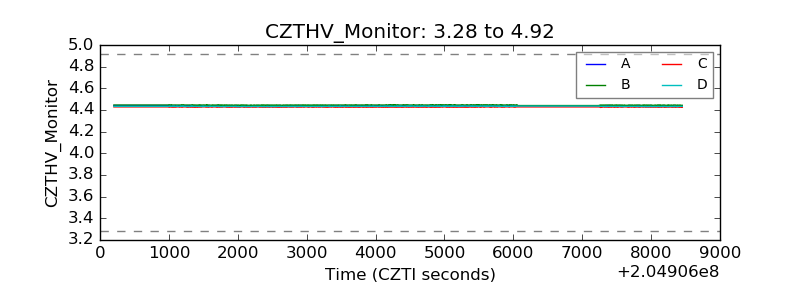 |
| D_VDD | 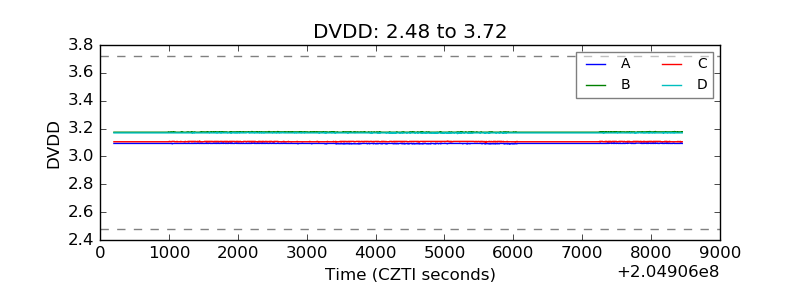 |
| Temperature 1 | 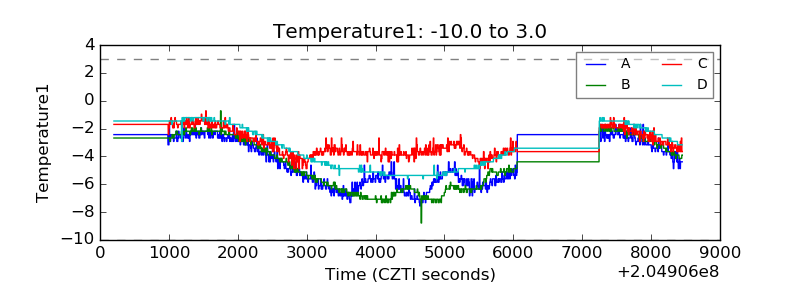 |
| Veto HV Monitor | 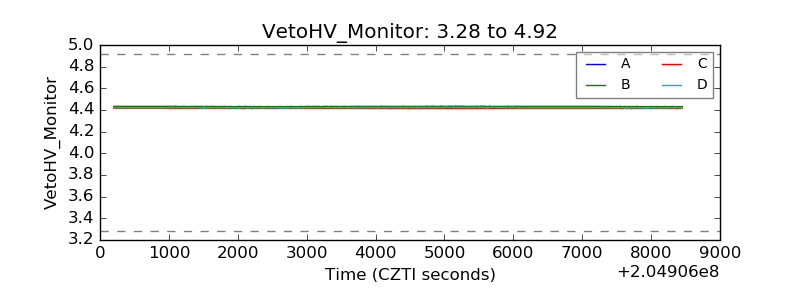 |
| Veto LLD | 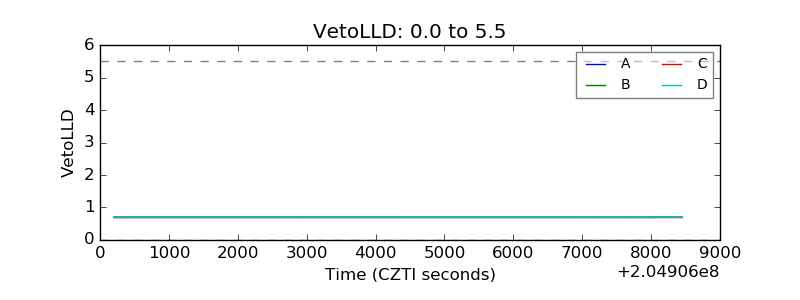 |
| Alpha Counter | 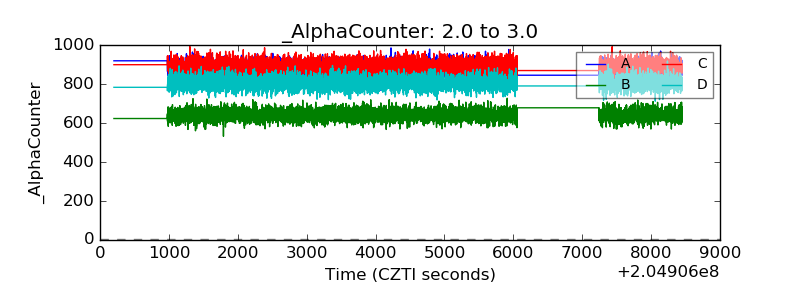 |
| _CPM_Rate | 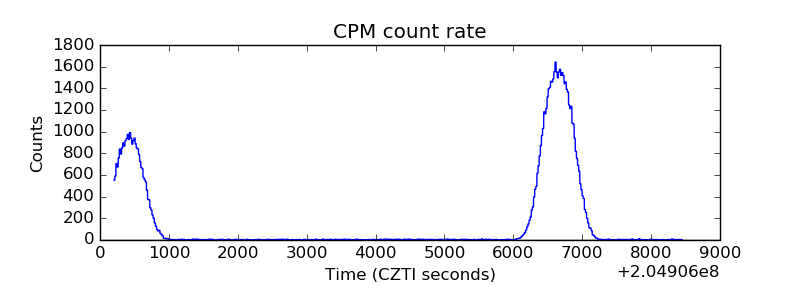 |
| CZT Counter | 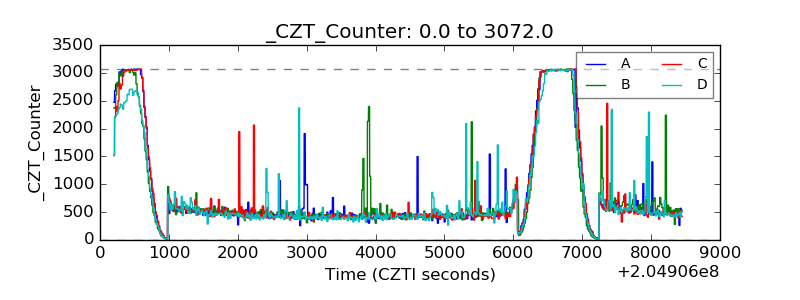 |
| +2.5 Volts monitor | 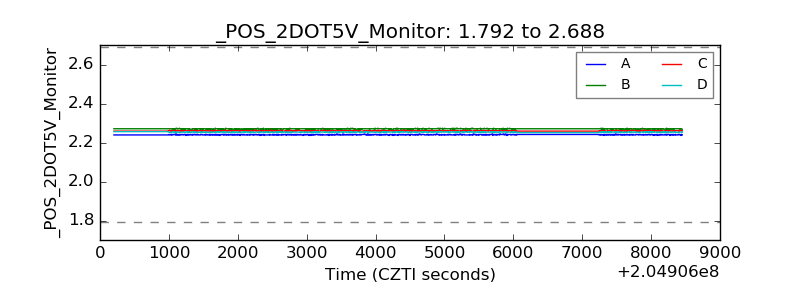 |
| +5 Volts monitor |  |
| _ROLL_ROT | 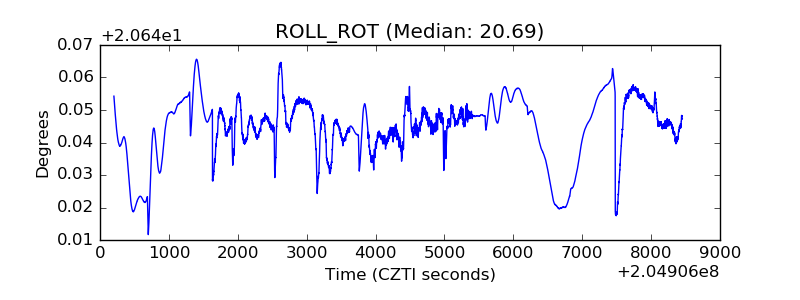 |
| _Roll_DEC | 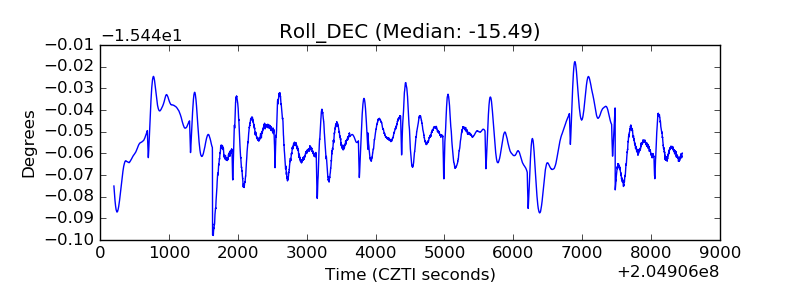 |
| _Roll_RA |  |
| Veto Counter | 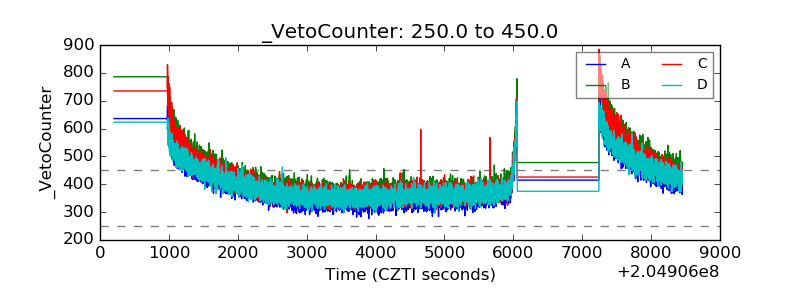 |