| Param | Original file | Final file |
|---|---|---|
| Filename | modeM0/AS1G05_222T01_9000000520_04082cztM0_level2.evt | modeM0/AS1G05_222T01_9000000520_04082cztM0_level2_quad_clean.evt |
| Size (bytes) | 451,609,920 | 78,652,800 |
| Size | 430.7 MB | 75.0 MB |
| Events in quadrant A | 3,395,838 | 492,311 |
| Events in quadrant B | 3,709,122 | 496,221 |
| Events in quadrant C | 2,922,543 | 489,810 |
| Events in quadrant D | 3,229,412 | 471,687 |
| Mode M9 | |||
|---|---|---|---|
| Quadrant | BADHDUFLAG | Total packets | Discarded packets |
| A | 0 | 20 | 0 |
| B | 0 | 20 | 0 |
| C | 0 | 20 | 0 |
| D | 0 | 21 | 0 |
| Mode SS | |||
|---|---|---|---|
| Quadrant | BADHDUFLAG | Total packets | Discarded packets |
| A | 0 | 126 | 0 |
| B | 0 | 126 | 0 |
| C | 0 | 126 | 0 |
| D | 0 | 126 | 0 |
| Mode M0 | |||
|---|---|---|---|
| Quadrant | BADHDUFLAG | Total packets | Discarded packets |
| A | 0 | 14068 | 3 |
| B | 0 | 15064 | 2 |
| C | 0 | 12703 | 2 |
| D | 0 | 13847 | 2 |
| Quadrant | Total seconds | Saturated seconds | Saturation percentage |
|---|---|---|---|
| A | 6183 | 60 | 0.970403% |
| B | 6183 | 223 | 3.606663% |
| C | 6183 | 10 | 0.161734% |
| D | 6183 | 79 | 1.277697% |
Noise dominated data is calculated using 1-second bins in cleaned event files. If a bin has >2000 counts, and if more than 50% of those come from <1% of pixels, then it is considered to be noise-dominated and hence unusable.
| Quadrant | # 1 sec bins | Bins with >0 counts | Bins with >2000 counts | High rate bins dominated by noise | Noise dominated (total time) | Noise dominated (detector-on time) | Marked lightcurve |
|---|---|---|---|---|---|---|---|
| A | 7513 | 6184 | 19 | 19 | 0.25% | 0.31% | 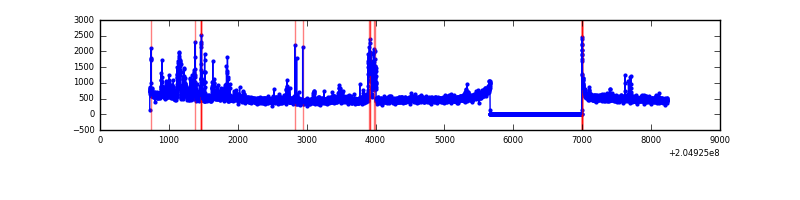 |
| B | 7513 | 6184 | 174 | 174 | 2.32% | 2.81% | 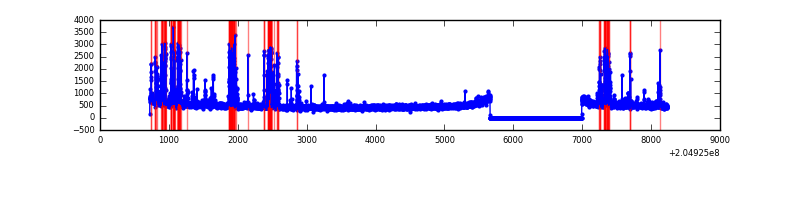 |
| C | 7513 | 6184 | 0 | 0 | 0.00% | 0.00% | 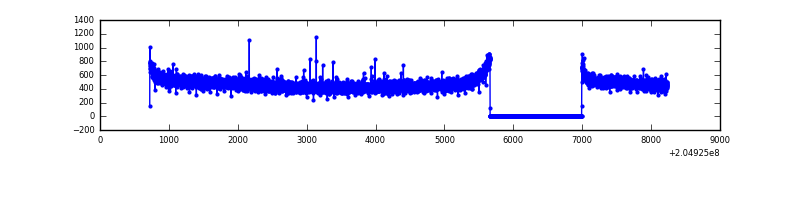 |
| D | 7513 | 6184 | 51 | 51 | 0.68% | 0.82% | 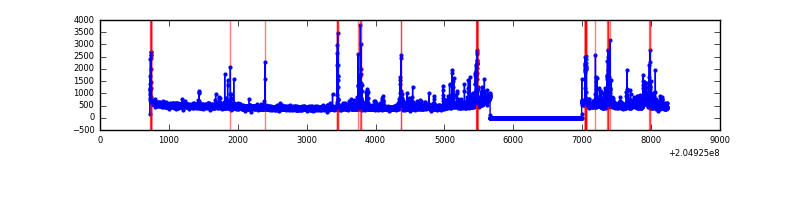 |
Top three noisy pixels from each quadrant. If the there are fewer than three noisy pixels in the level2.evt file, extra rows are filled as -1
| Pixel properties | Quadrant properties | ||||||
|---|---|---|---|---|---|---|---|
| Quadrant | DetID | PixID | Counts | Sigma | Mean | Median | Sigma |
| A | 0 | 199 | 327248 | 2133.03 | 755 | 740 | 153.1 |
| A | 0 | 118 | 50489 | 325.0 | 755 | 740 | 153.1 |
| A | 0 | 226 | 42380 | 272.03 | 755 | 740 | 153.1 |
| B | 14 | 167 | 647915 | 4449.63 | 763 | 746 | 145.4 |
| B | 10 | 16 | 30549 | 204.91 | 763 | 746 | 145.4 |
| B | 0 | 183 | 27420 | 183.4 | 763 | 746 | 145.4 |
| C | 9 | 144 | 8124 | 42.84 | 745 | 749 | 172.2 |
| C | 13 | 61 | 6063 | 30.87 | 745 | 749 | 172.2 |
| C | 12 | 4 | 3477 | 15.85 | 745 | 749 | 172.2 |
| D | 10 | 172 | 141976 | 792.3 | 734 | 714 | 178.3 |
| D | 13 | 239 | 105913 | 590.03 | 734 | 714 | 178.3 |
| D | 12 | 233 | 90815 | 505.35 | 734 | 714 | 178.3 |
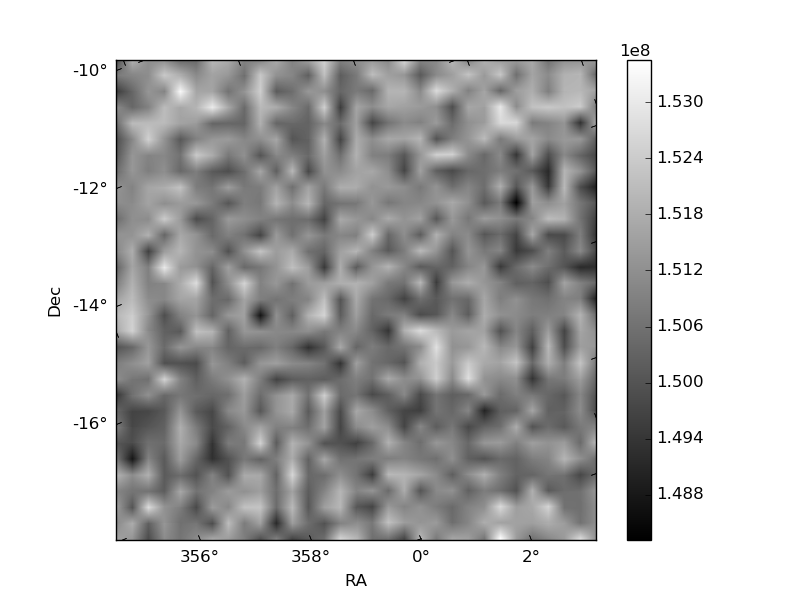
Histogram calculated using DETX and DETY for each event in the final _common_clean file
| Quadrant A | 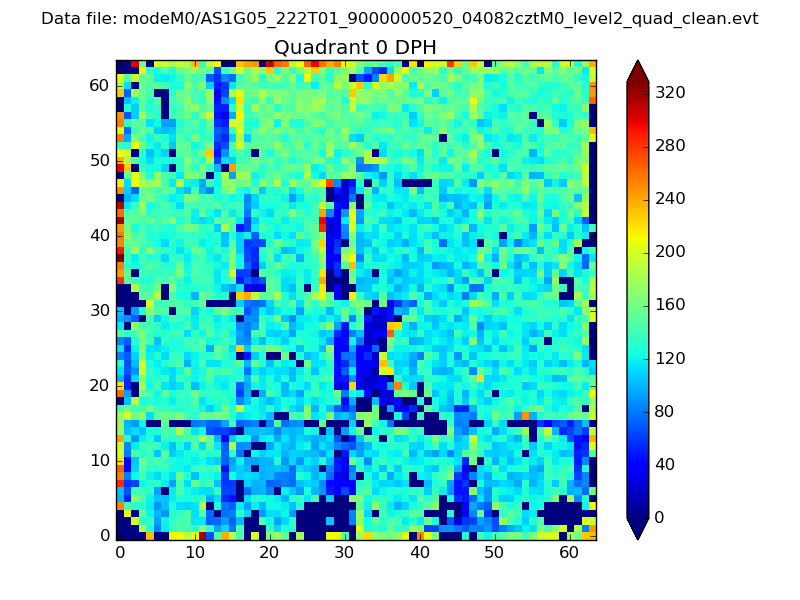 |
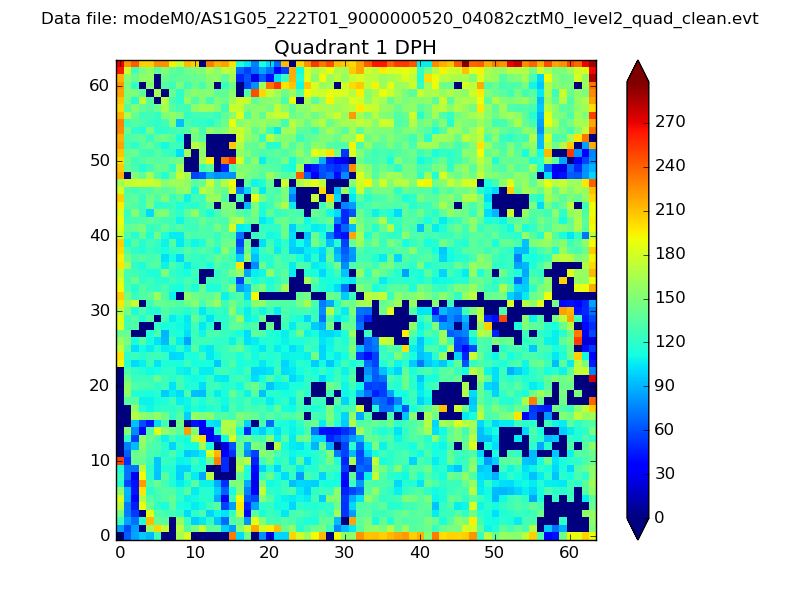 |
Quadrant B |
|---|---|---|---|
| Quadrant D | 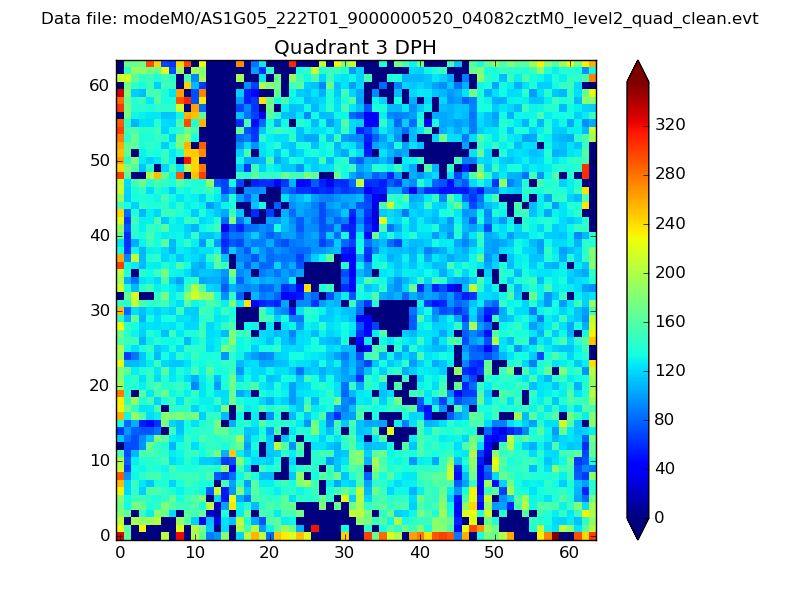 |
 |
Quadrant C |
| Plot type | Count rate plots | Images |
|---|---|---|
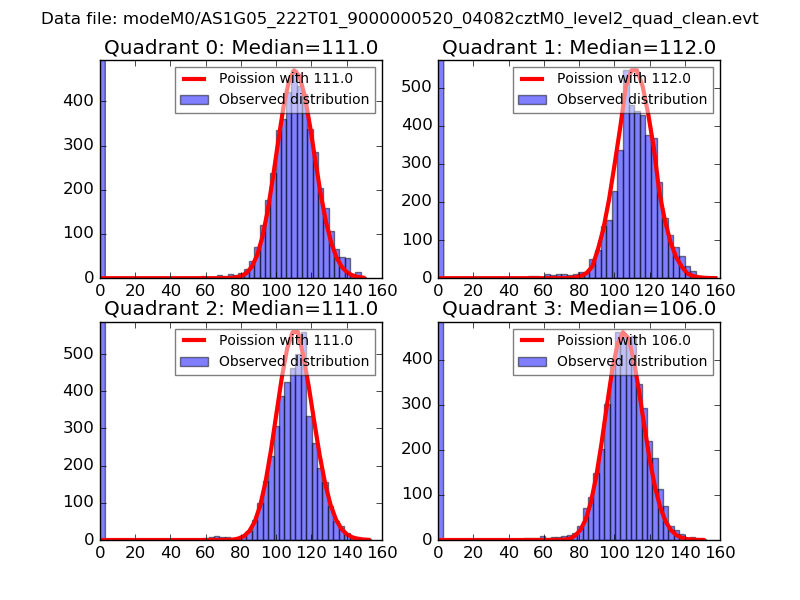
| Comparison with Poisson distribution Blue bars denote a histogram of data divided into 1 sec bins. Red curve is a Poisson curve with rate = median count rate of data. |
 |
 |
| Quadrant-wise count rates Data is divided into 100 sec bins |
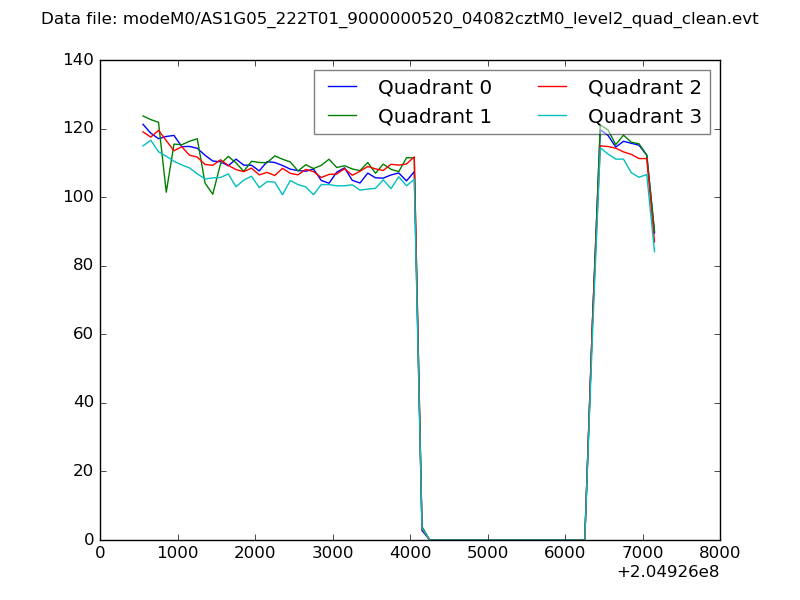 |
|
| Module-wise count rates for Quadrant A Data is divided into 100 sec bins |
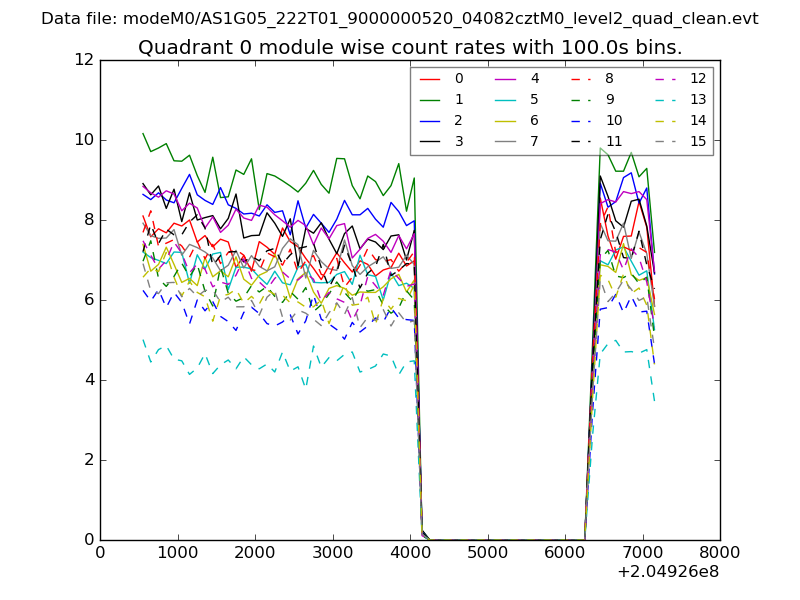 |
 |
| Module-wise count rates for Quadrant B Data is divided into 100 sec bins |
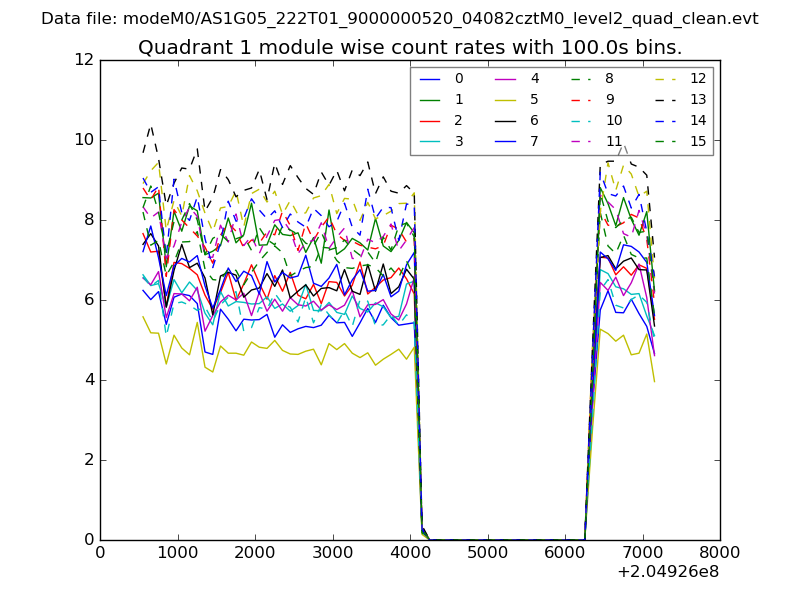 |
 |
| Module-wise count rates for Quadrant C Data is divided into 100 sec bins |
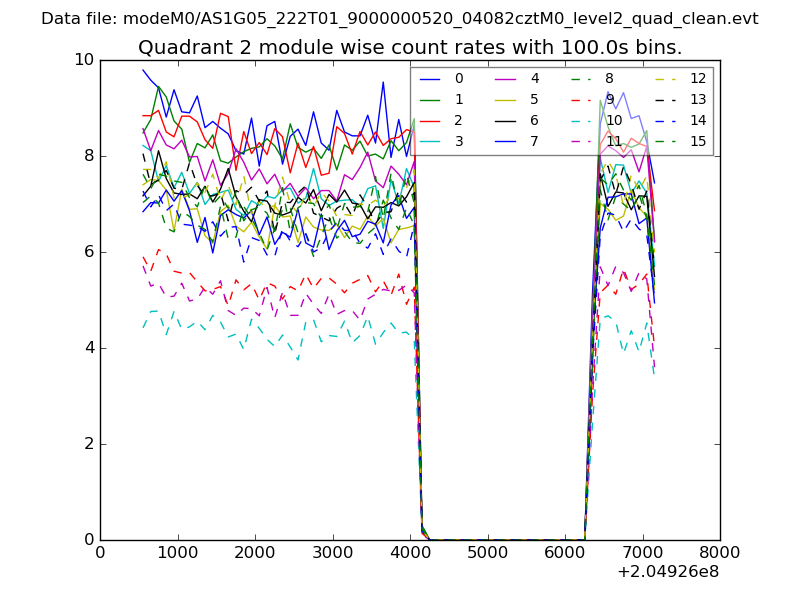 |
 |
| Module-wise count rates for Quadrant D Data is divided into 100 sec bins |
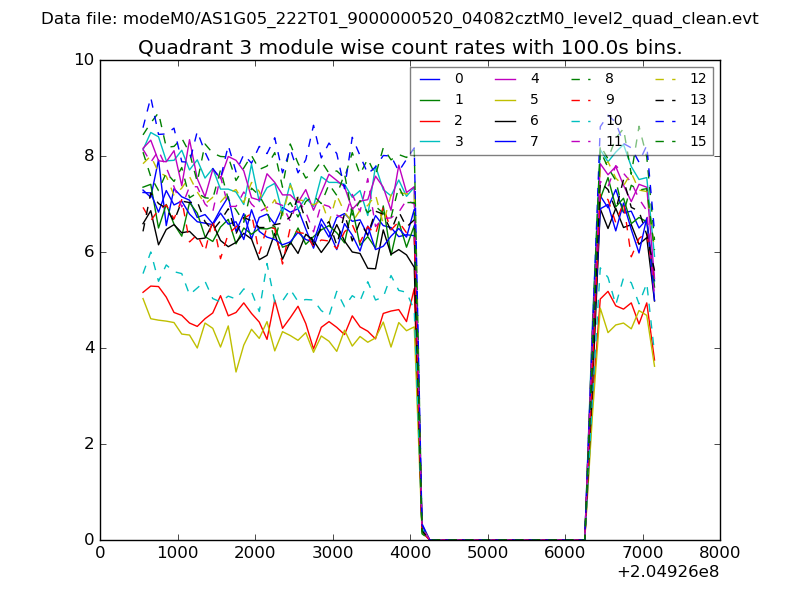 |
 |
| Parameter | Plot |
|---|---|
| CZT HV Monitor | 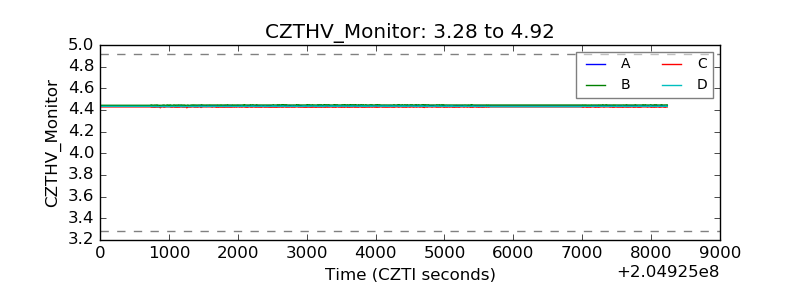 |
| D_VDD | 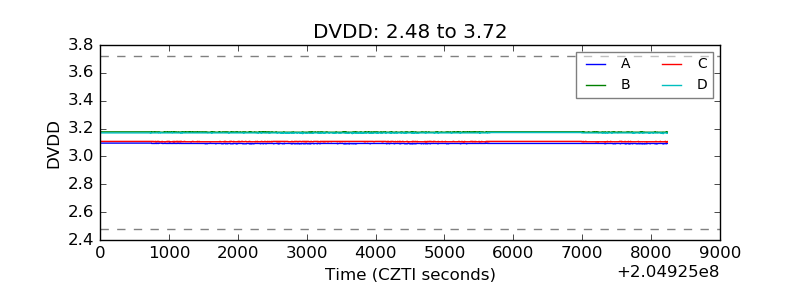 |
| Temperature 1 | 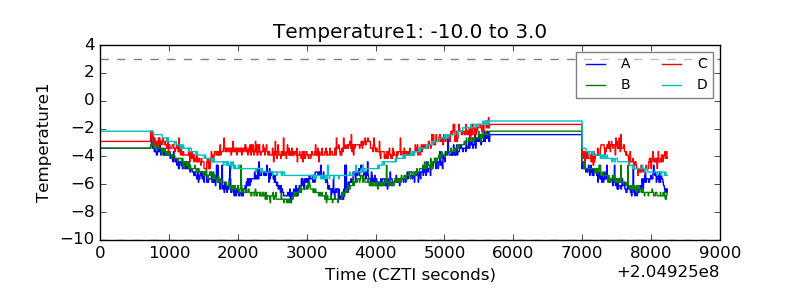 |
| Veto HV Monitor | 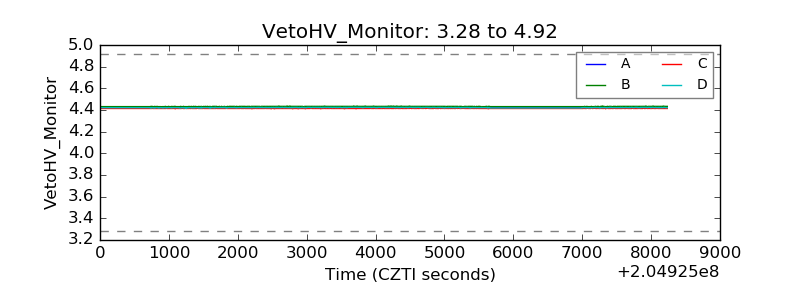 |
| Veto LLD | 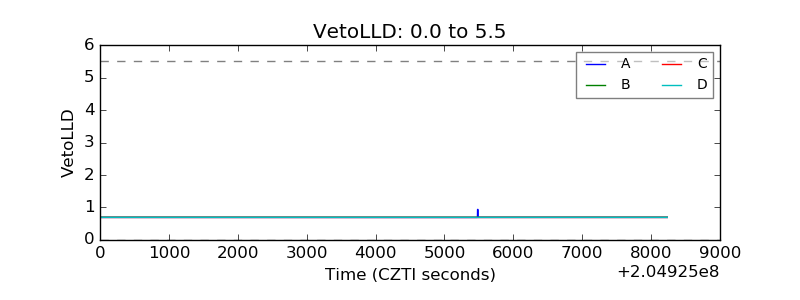 |
| Alpha Counter | 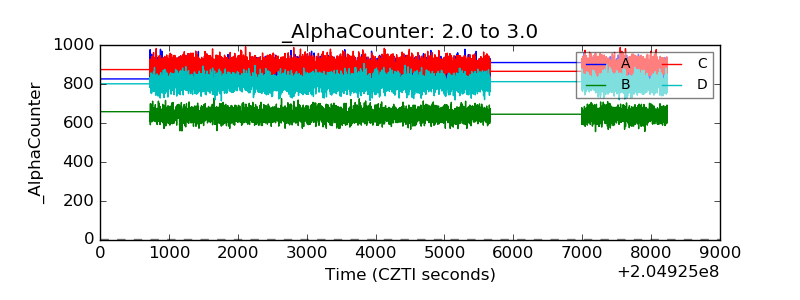 |
| _CPM_Rate | 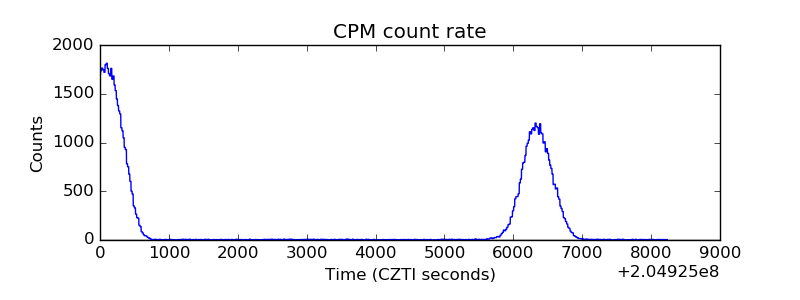 |
| CZT Counter | 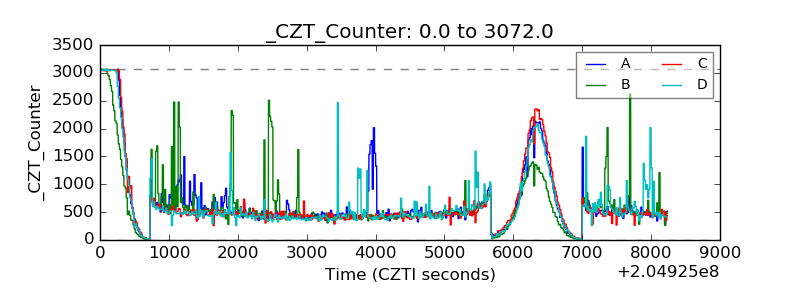 |
| +2.5 Volts monitor |  |
| +5 Volts monitor | 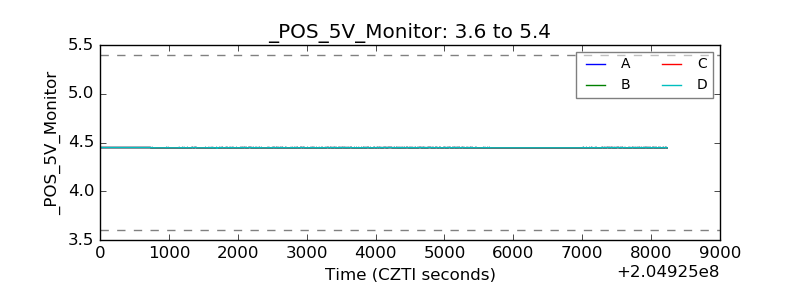 |
| _ROLL_ROT | 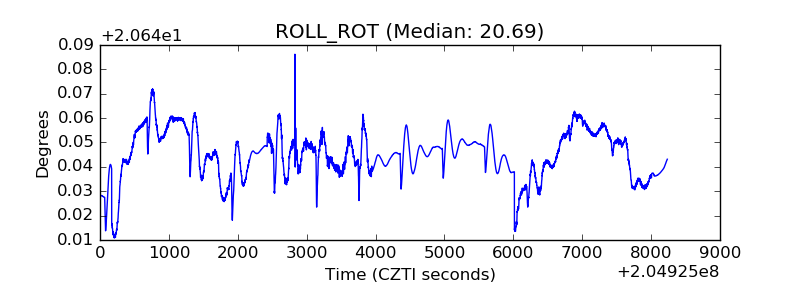 |
| _Roll_DEC | 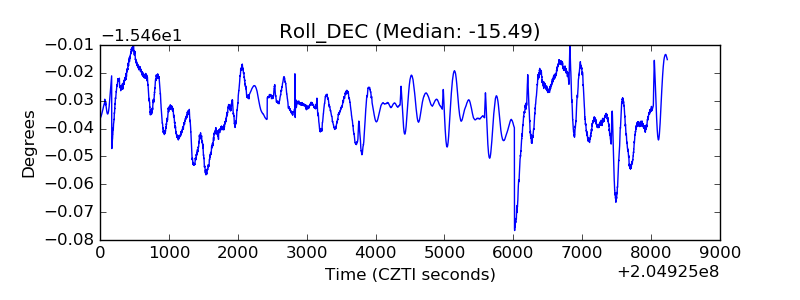 |
| _Roll_RA |  |
| Veto Counter | 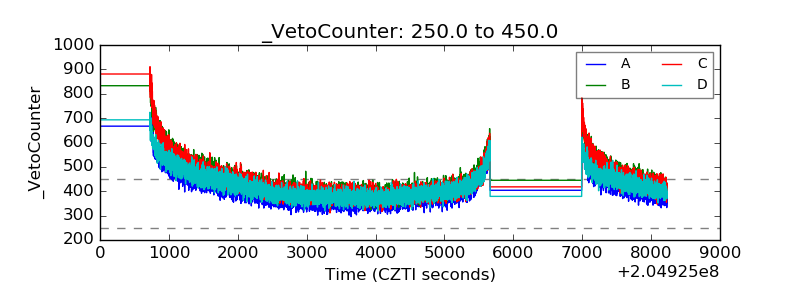 |