| Param | Original file | Final file |
|---|---|---|
| Filename | modeM0/AS1G05_222T01_9000000520_04084cztM0_level2.evt | modeM0/AS1G05_222T01_9000000520_04084cztM0_level2_quad_clean.evt |
| Size (bytes) | 450,391,680 | 82,137,600 |
| Size | 429.5 MB | 78.3 MB |
| Events in quadrant A | 3,547,032 | 510,646 |
| Events in quadrant B | 3,382,455 | 514,887 |
| Events in quadrant C | 3,053,070 | 508,449 |
| Events in quadrant D | 3,205,448 | 489,617 |
| Mode M9 | |||
|---|---|---|---|
| Quadrant | BADHDUFLAG | Total packets | Discarded packets |
| A | 0 | 19 | 0 |
| B | 0 | 19 | 0 |
| C | 0 | 19 | 0 |
| D | 0 | 20 | 0 |
| Mode SS | |||
|---|---|---|---|
| Quadrant | BADHDUFLAG | Total packets | Discarded packets |
| A | 0 | 134 | 0 |
| B | 0 | 134 | 0 |
| C | 0 | 134 | 0 |
| D | 0 | 134 | 0 |
| Mode M0 | |||
|---|---|---|---|
| Quadrant | BADHDUFLAG | Total packets | Discarded packets |
| A | 0 | 15211 | 3 |
| B | 0 | 14450 | 2 |
| C | 0 | 13726 | 2 |
| D | 0 | 14422 | 2 |
| Quadrant | Total seconds | Saturated seconds | Saturation percentage |
|---|---|---|---|
| A | 6654 | 59 | 0.886685% |
| B | 6654 | 92 | 1.382627% |
| C | 6654 | 44 | 0.661256% |
| D | 6654 | 88 | 1.322513% |
Noise dominated data is calculated using 1-second bins in cleaned event files. If a bin has >2000 counts, and if more than 50% of those come from <1% of pixels, then it is considered to be noise-dominated and hence unusable.
| Quadrant | # 1 sec bins | Bins with >0 counts | Bins with >2000 counts | High rate bins dominated by noise | Noise dominated (total time) | Noise dominated (detector-on time) | Marked lightcurve |
|---|---|---|---|---|---|---|---|
| A | 7539 | 6656 | 37 | 37 | 0.49% | 0.56% | 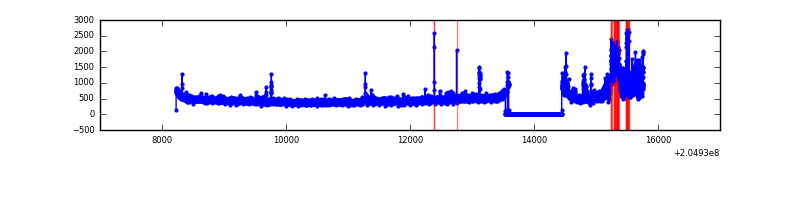 |
| B | 7539 | 6655 | 39 | 39 | 0.52% | 0.59% | 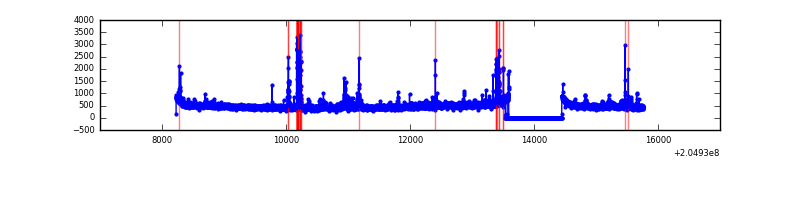 |
| C | 7539 | 6655 | 9 | 9 | 0.12% | 0.14% | 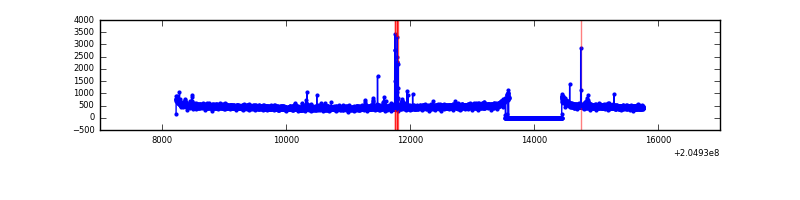 |
| D | 7539 | 6656 | 64 | 64 | 0.85% | 0.96% | 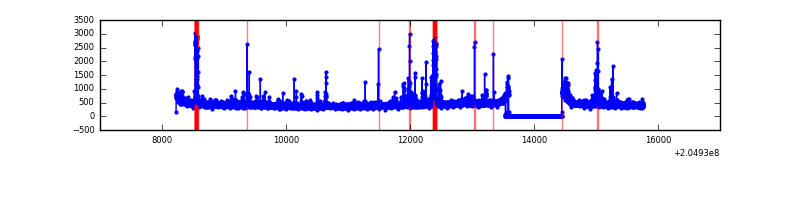 |
Top three noisy pixels from each quadrant. If the there are fewer than three noisy pixels in the level2.evt file, extra rows are filled as -1
| Pixel properties | Quadrant properties | ||||||
|---|---|---|---|---|---|---|---|
| Quadrant | DetID | PixID | Counts | Sigma | Mean | Median | Sigma |
| A | 0 | 199 | 460316 | 2889.81 | 771 | 755 | 159.0 |
| A | 0 | 50 | 75320 | 468.88 | 771 | 755 | 159.0 |
| A | 0 | 226 | 48092 | 297.66 | 771 | 755 | 159.0 |
| B | 14 | 167 | 143573 | 939.62 | 786 | 766 | 152.0 |
| B | 10 | 16 | 91162 | 594.77 | 786 | 766 | 152.0 |
| B | 4 | 81 | 29316 | 187.85 | 786 | 766 | 152.0 |
| C | 9 | 144 | 78485 | 432.1 | 760 | 763 | 179.9 |
| C | 13 | 61 | 6324 | 30.92 | 760 | 763 | 179.9 |
| C | 12 | 4 | 4239 | 19.32 | 760 | 763 | 179.9 |
| D | 10 | 172 | 147836 | 798.64 | 751 | 730 | 184.2 |
| D | 2 | 14 | 103835 | 559.76 | 751 | 730 | 184.2 |
| D | 2 | 232 | 56725 | 304.0 | 751 | 730 | 184.2 |
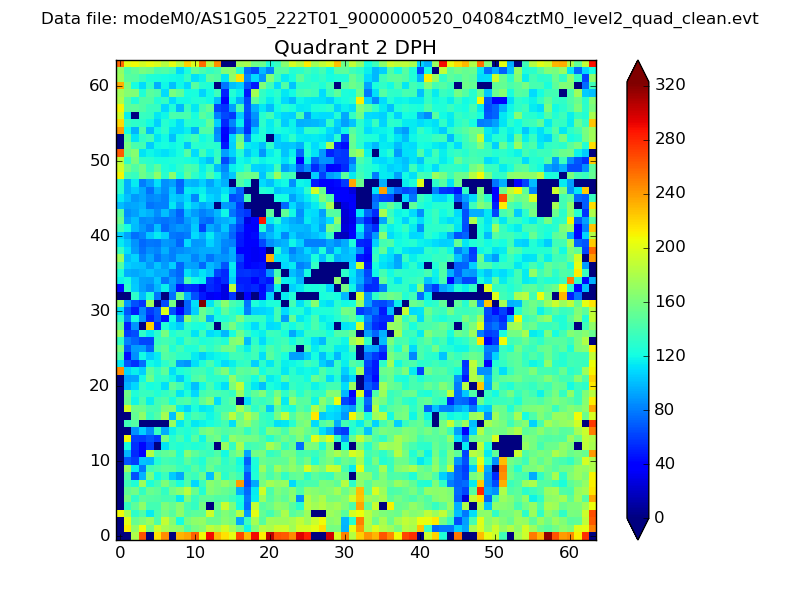
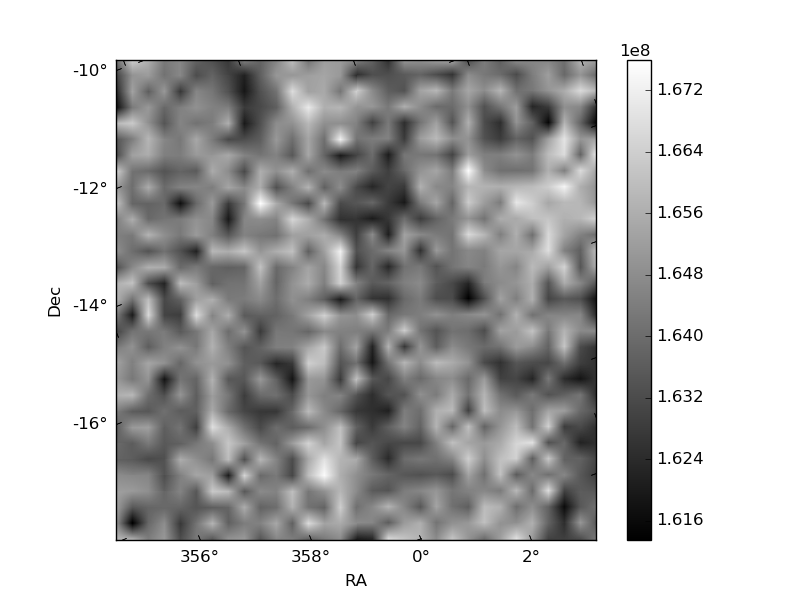
Histogram calculated using DETX and DETY for each event in the final _common_clean file
| Quadrant A |  |
 |
Quadrant B |
|---|---|---|---|
| Quadrant D | 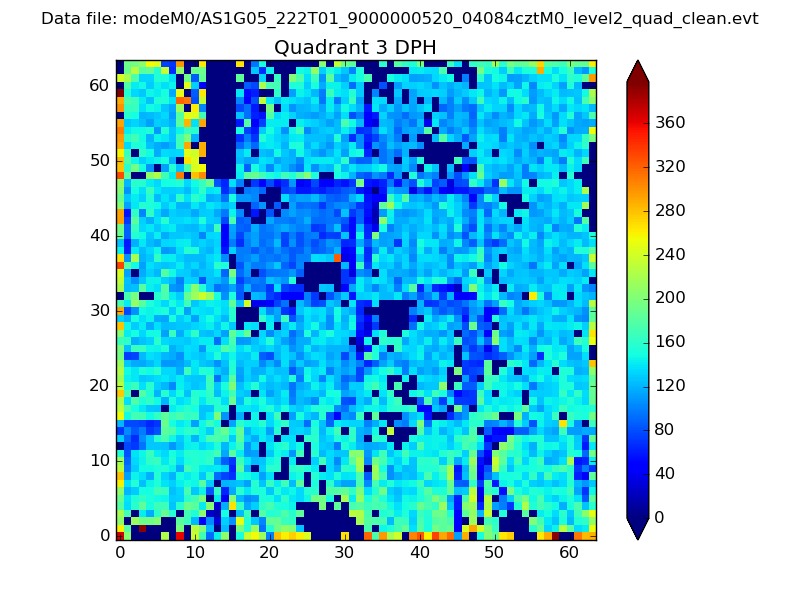 |
 |
Quadrant C |
| Plot type | Count rate plots | Images |
|---|---|---|
| Comparison with Poisson distribution Blue bars denote a histogram of data divided into 1 sec bins. Red curve is a Poisson curve with rate = median count rate of data. |
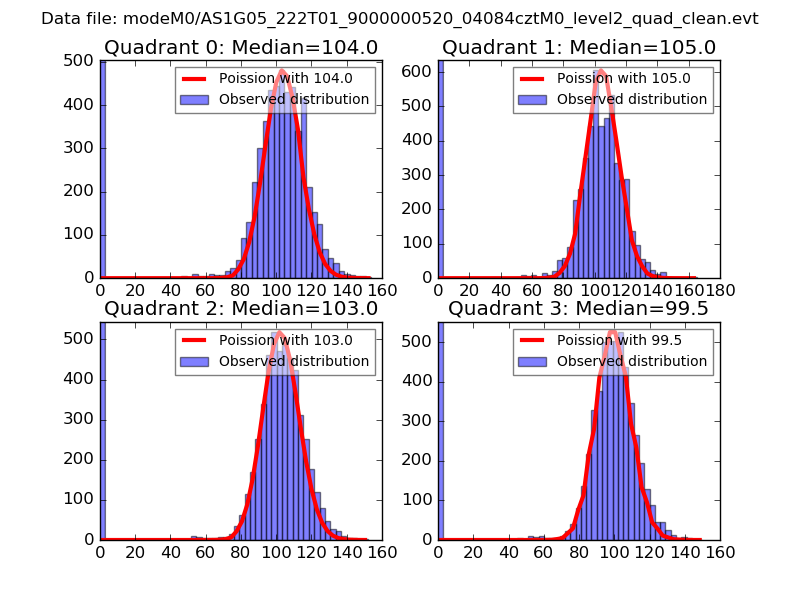 |
 |
| Quadrant-wise count rates Data is divided into 100 sec bins |
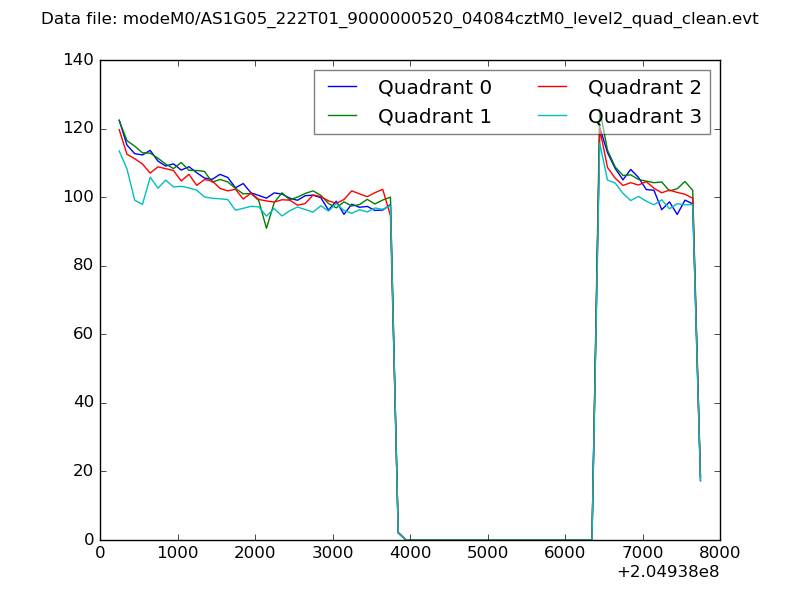 |
|
| Module-wise count rates for Quadrant A Data is divided into 100 sec bins |
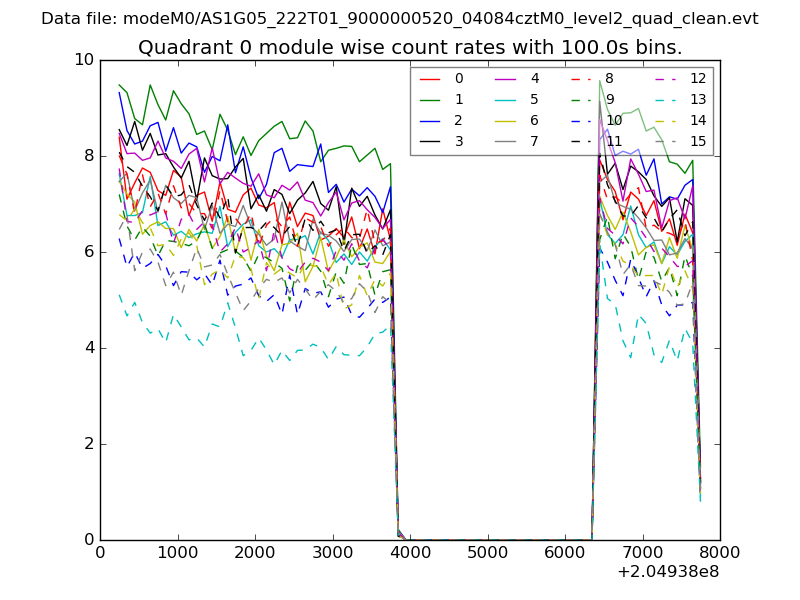 |
 |
| Module-wise count rates for Quadrant B Data is divided into 100 sec bins |
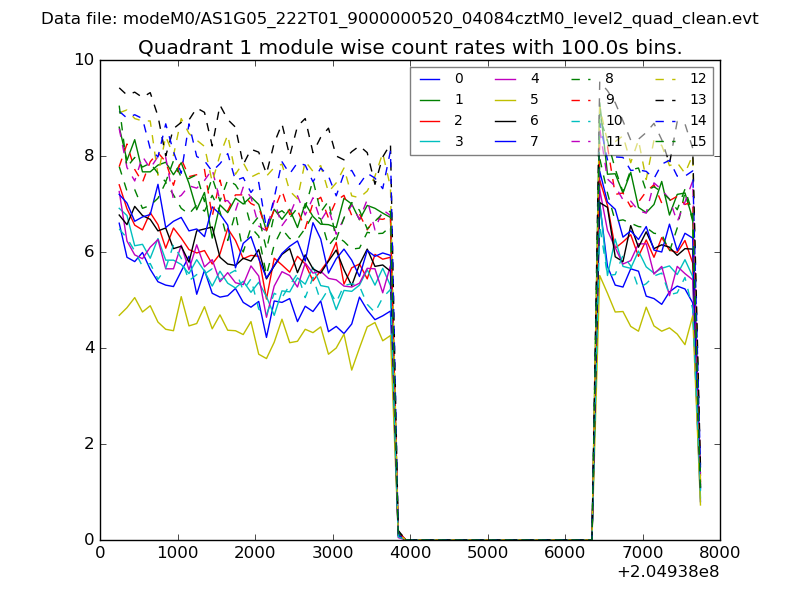 |
 |
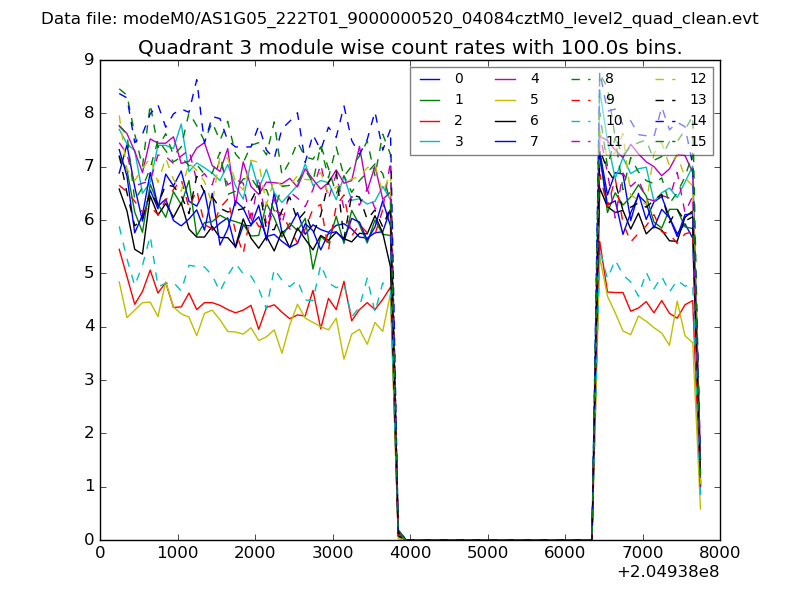
| Module-wise count rates for Quadrant C Data is divided into 100 sec bins |
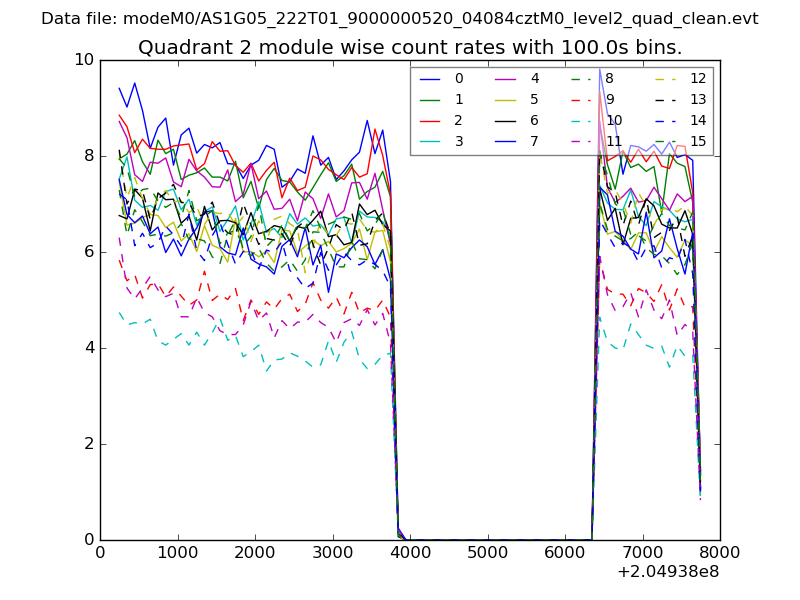 |
 |
| Module-wise count rates for Quadrant D Data is divided into 100 sec bins |
 |
 |
| Parameter | Plot |
|---|---|
| CZT HV Monitor | 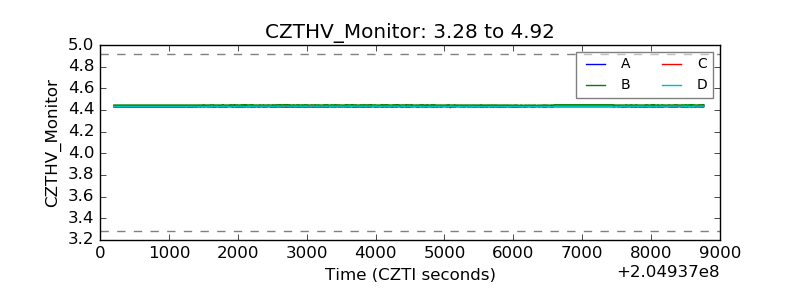 |
| D_VDD | 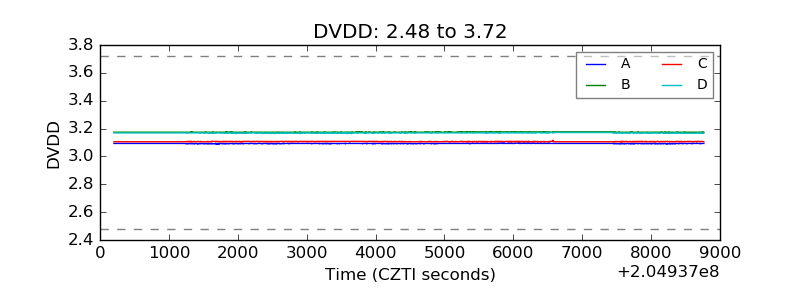 |
| Temperature 1 | 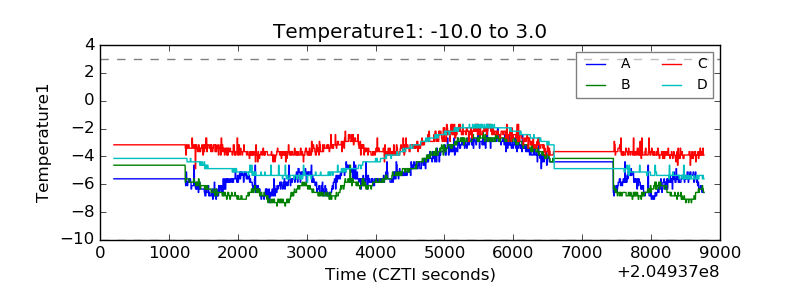 |
| Veto HV Monitor | 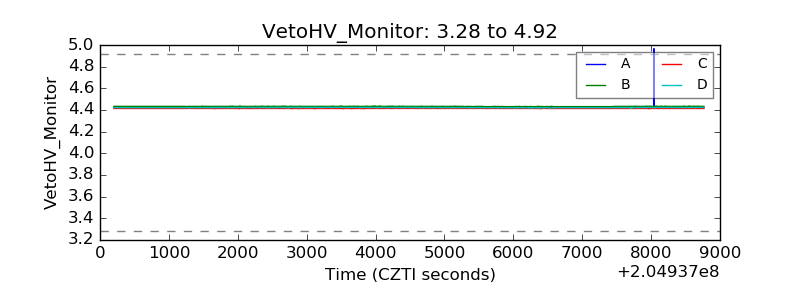 |
| Veto LLD | 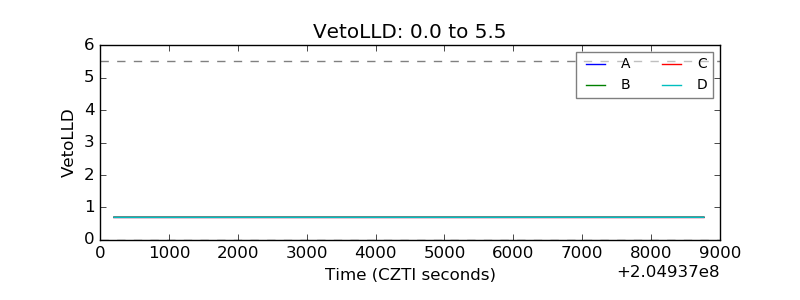 |
| Alpha Counter | 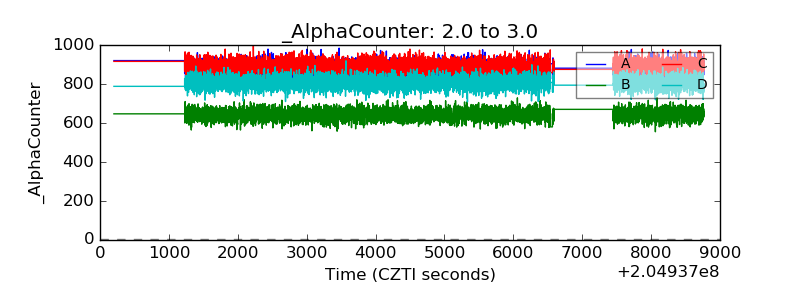 |
| _CPM_Rate | 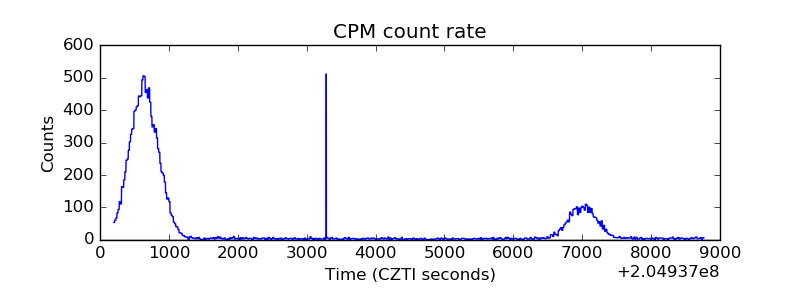 |
| CZT Counter | 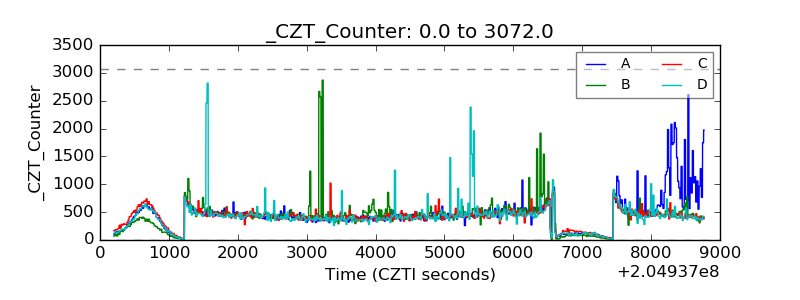 |
| +2.5 Volts monitor |  |
| +5 Volts monitor |  |
| _ROLL_ROT | 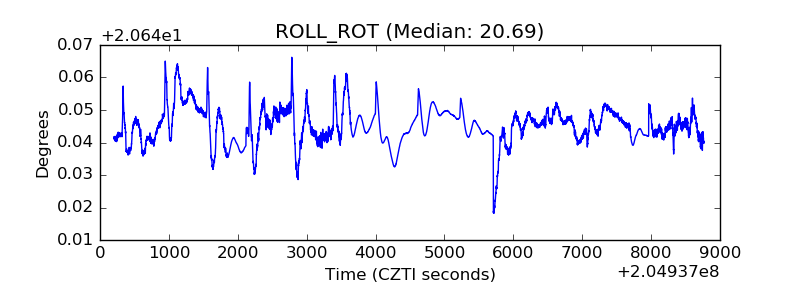 |
| _Roll_DEC | 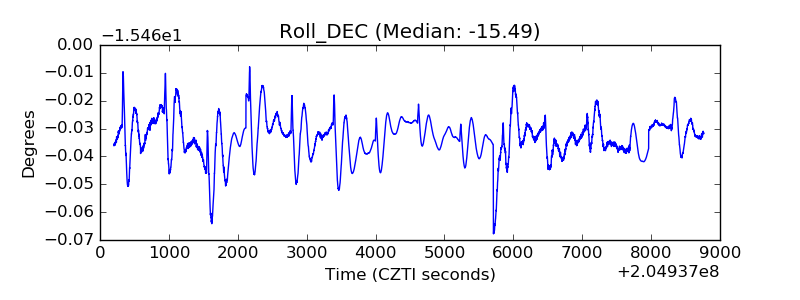 |
| _Roll_RA | 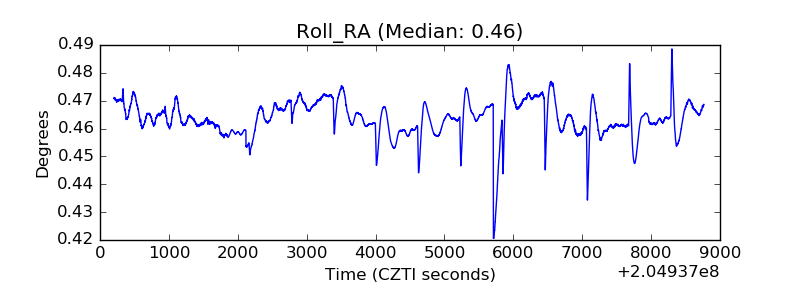 |
| Veto Counter | 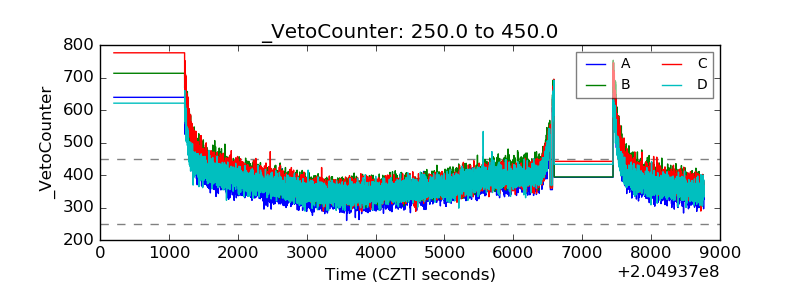 |