| Param | Original file | Final file |
|---|---|---|
| Filename | modeM0/AS1G05_222T01_9000000520_04085cztM0_level2.evt | modeM0/AS1G05_222T01_9000000520_04085cztM0_level2_quad_clean.evt |
| Size (bytes) | 500,137,920 | 85,438,080 |
| Size | 477.0 MB | 81.5 MB |
| Events in quadrant A | 4,002,630 | 520,365 |
| Events in quadrant B | 3,625,459 | 528,194 |
| Events in quadrant C | 3,474,786 | 519,633 |
| Events in quadrant D | 3,537,274 | 500,205 |
| Mode M9 | |||
|---|---|---|---|
| Quadrant | BADHDUFLAG | Total packets | Discarded packets |
| A | 0 | 13 | 0 |
| B | 0 | 13 | 0 |
| C | 0 | 13 | 0 |
| D | 0 | 13 | 0 |
| Mode SS | |||
|---|---|---|---|
| Quadrant | BADHDUFLAG | Total packets | Discarded packets |
| A | 0 | 154 | 0 |
| B | 0 | 154 | 0 |
| C | 0 | 154 | 0 |
| D | 0 | 154 | 0 |
| Mode M0 | |||
|---|---|---|---|
| Quadrant | BADHDUFLAG | Total packets | Discarded packets |
| A | 0 | 17178 | 3 |
| B | 0 | 15874 | 2 |
| C | 0 | 15672 | 2 |
| D | 0 | 16039 | 2 |
| Quadrant | Total seconds | Saturated seconds | Saturation percentage |
|---|---|---|---|
| A | 7451 | 126 | 1.691048% |
| B | 7451 | 141 | 1.892363% |
| C | 7451 | 105 | 1.409207% |
| D | 7451 | 99 | 1.328681% |
Noise dominated data is calculated using 1-second bins in cleaned event files. If a bin has >2000 counts, and if more than 50% of those come from <1% of pixels, then it is considered to be noise-dominated and hence unusable.
| Quadrant | # 1 sec bins | Bins with >0 counts | Bins with >2000 counts | High rate bins dominated by noise | Noise dominated (total time) | Noise dominated (detector-on time) | Marked lightcurve |
|---|---|---|---|---|---|---|---|
| A | 8736 | 7454 | 42 | 42 | 0.48% | 0.56% | 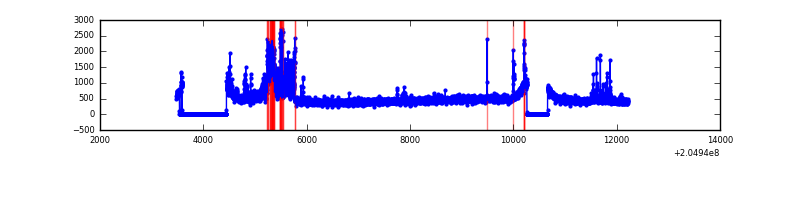 |
| B | 8736 | 7452 | 15 | 15 | 0.17% | 0.20% | 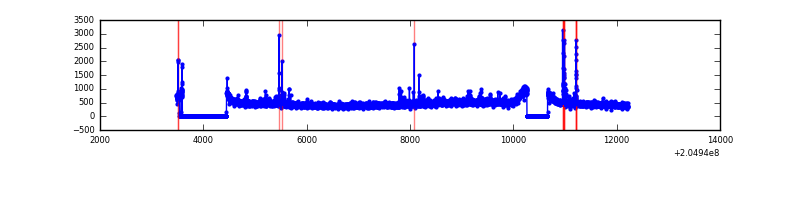 |
| C | 8736 | 7453 | 8 | 8 | 0.09% | 0.11% | 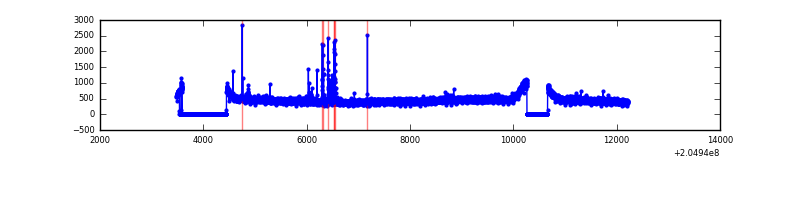 |
| D | 8736 | 7454 | 21 | 21 | 0.24% | 0.28% | 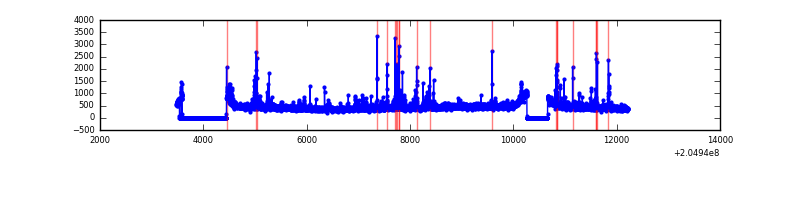 |
Top three noisy pixels from each quadrant. If the there are fewer than three noisy pixels in the level2.evt file, extra rows are filled as -1
| Pixel properties | Quadrant properties | ||||||
|---|---|---|---|---|---|---|---|
| Quadrant | DetID | PixID | Counts | Sigma | Mean | Median | Sigma |
| A | 0 | 199 | 498041 | 2730.54 | 875 | 854 | 182.1 |
| A | 0 | 50 | 89654 | 487.69 | 875 | 854 | 182.1 |
| A | 0 | 226 | 52142 | 281.67 | 875 | 854 | 182.1 |
| B | 10 | 16 | 87191 | 495.57 | 891 | 869 | 174.2 |
| B | 4 | 48 | 21389 | 117.8 | 891 | 869 | 174.2 |
| B | 15 | 204 | 20340 | 111.78 | 891 | 869 | 174.2 |
| C | 9 | 144 | 93156 | 448.88 | 864 | 868 | 205.6 |
| C | 13 | 61 | 7118 | 30.4 | 864 | 868 | 205.6 |
| C | 4 | 253 | 4526 | 17.79 | 864 | 868 | 205.6 |
| D | 10 | 172 | 67029 | 309.54 | 859 | 832 | 213.9 |
| D | 2 | 14 | 47391 | 217.71 | 859 | 832 | 213.9 |
| D | 13 | 239 | 42892 | 196.67 | 859 | 832 | 213.9 |
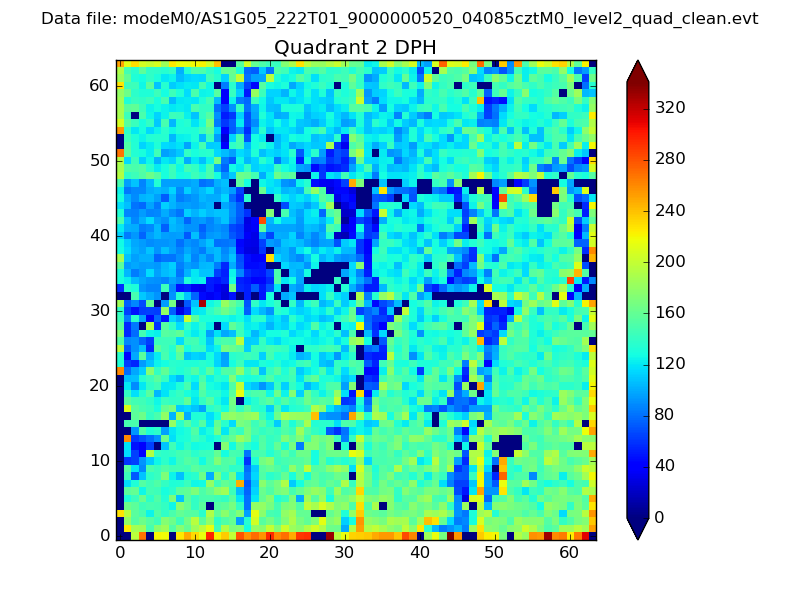
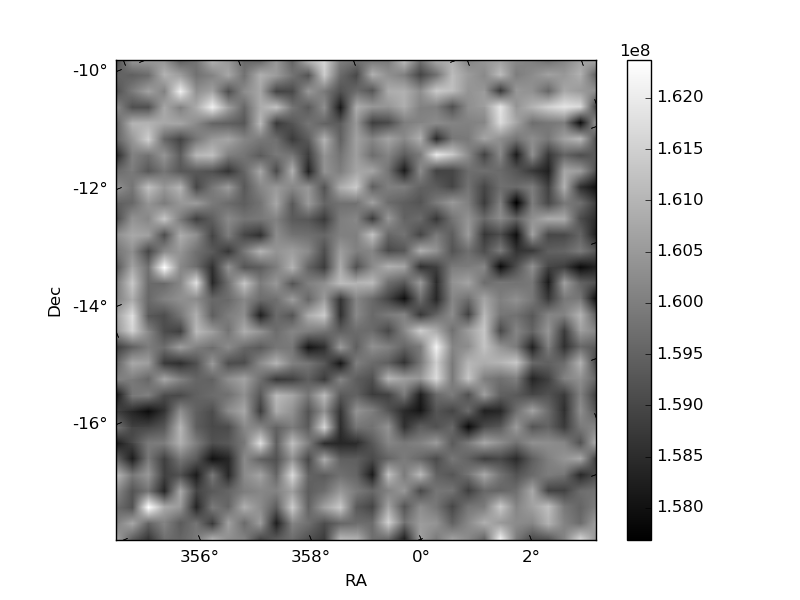
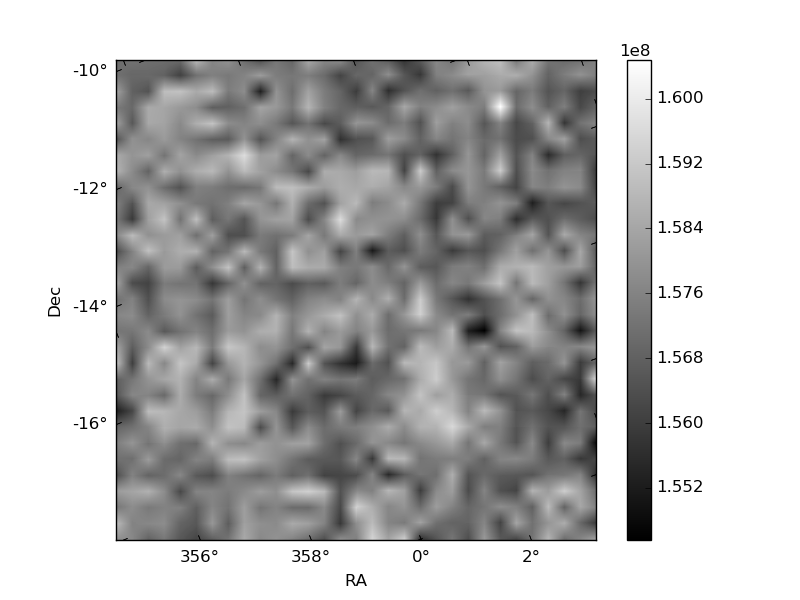
Histogram calculated using DETX and DETY for each event in the final _common_clean file
| Quadrant A | 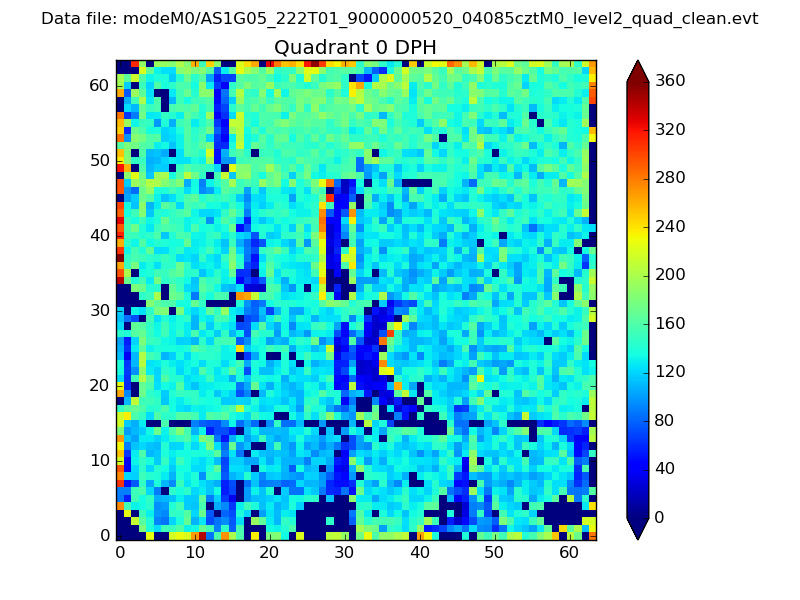 |
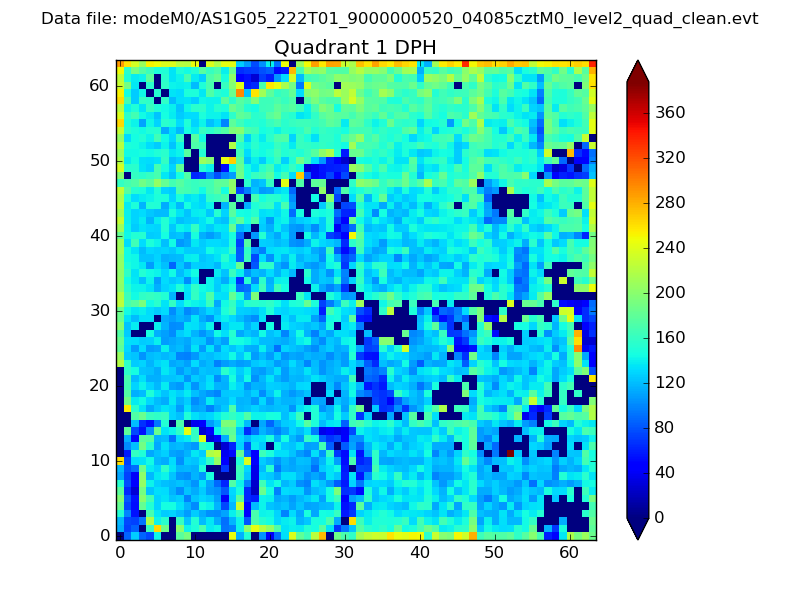 |
Quadrant B |
|---|---|---|---|
| Quadrant D | 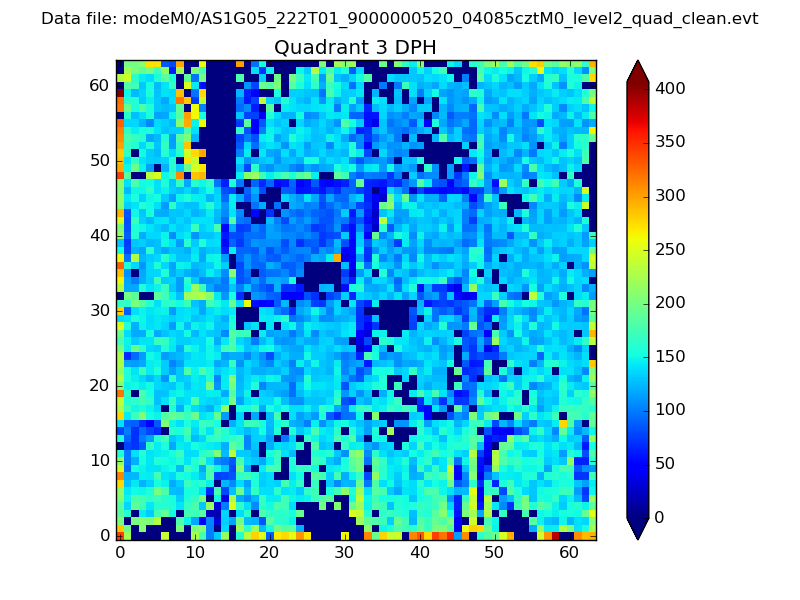 |
 |
Quadrant C |
| Plot type | Count rate plots | Images |
|---|---|---|
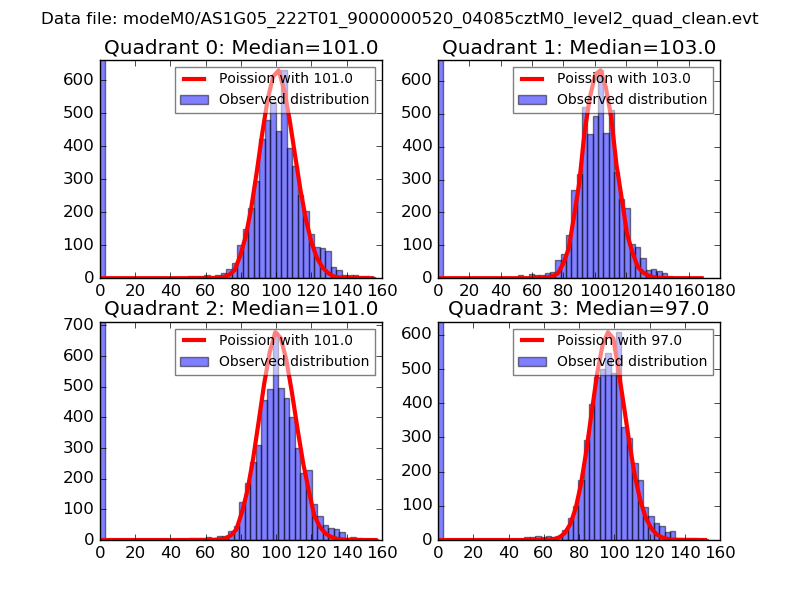
| Comparison with Poisson distribution Blue bars denote a histogram of data divided into 1 sec bins. Red curve is a Poisson curve with rate = median count rate of data. |
 |
 |
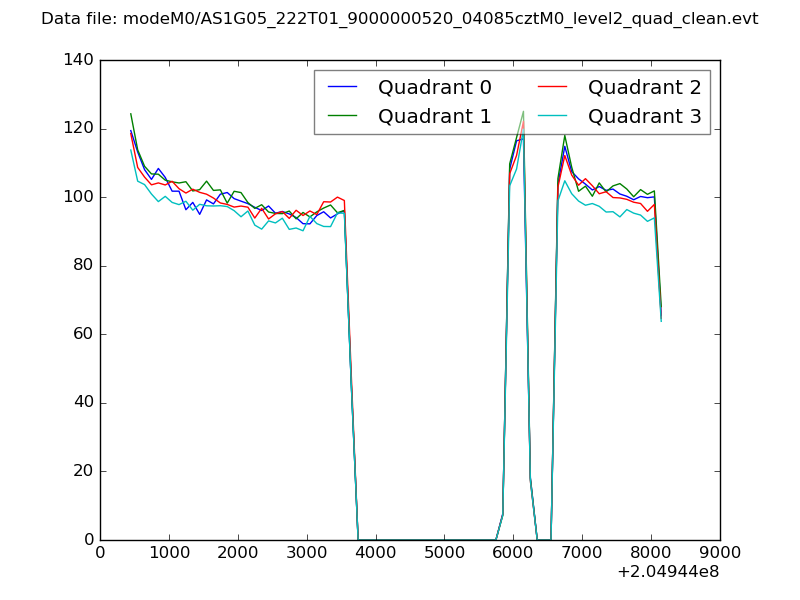
| Quadrant-wise count rates Data is divided into 100 sec bins |
 |
|
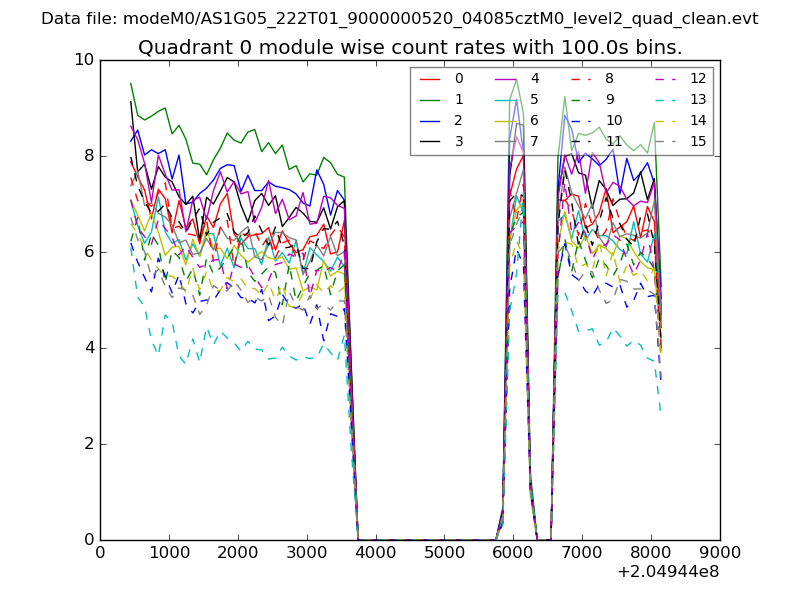
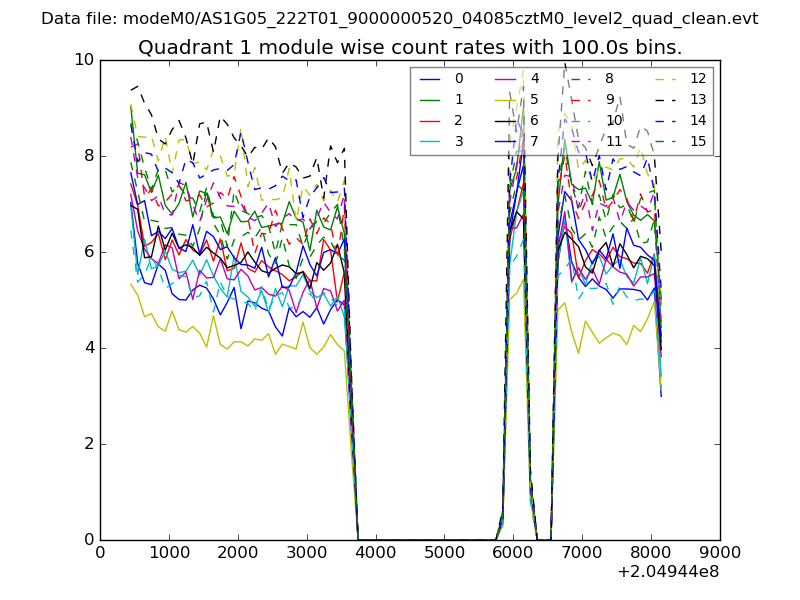
| Module-wise count rates for Quadrant A Data is divided into 100 sec bins |
 |
 |
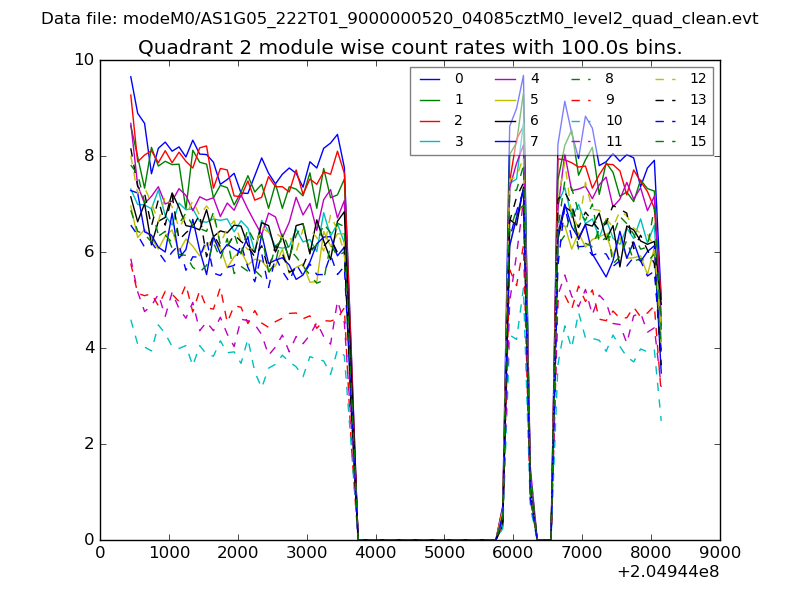
| Module-wise count rates for Quadrant B Data is divided into 100 sec bins |
 |
 |
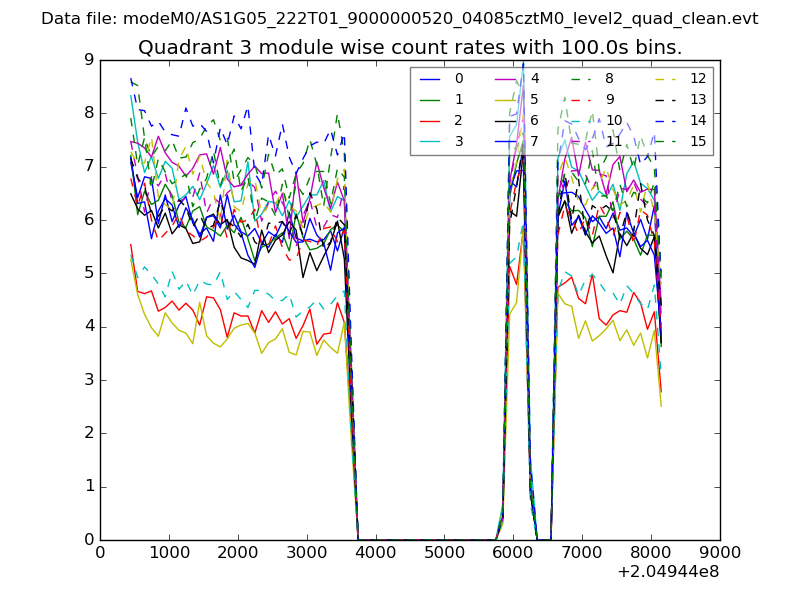
| Module-wise count rates for Quadrant C Data is divided into 100 sec bins |
 |
 |
| Module-wise count rates for Quadrant D Data is divided into 100 sec bins |
 |
 |
| Parameter | Plot |
|---|---|
| CZT HV Monitor | 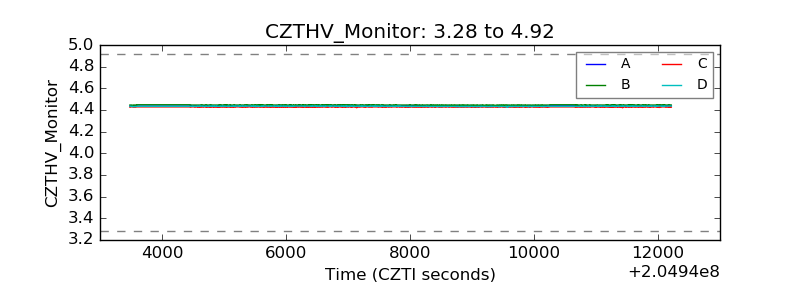 |
| D_VDD | 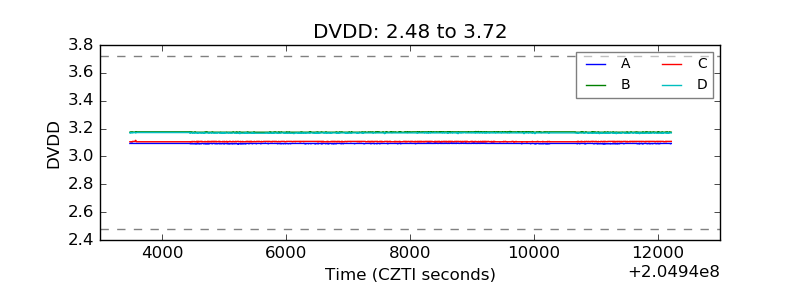 |
| Temperature 1 | 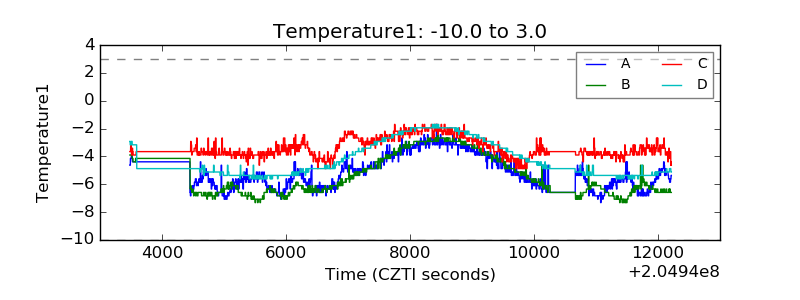 |
| Veto HV Monitor | 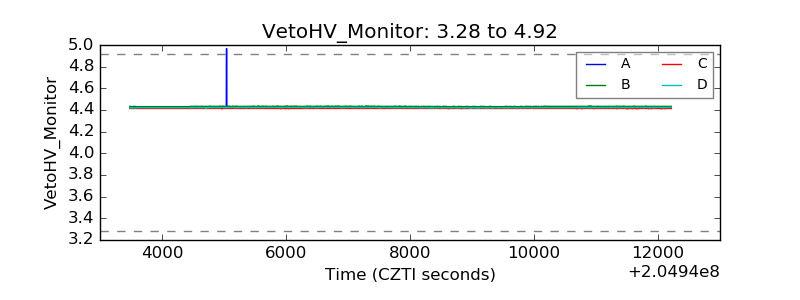 |
| Veto LLD | 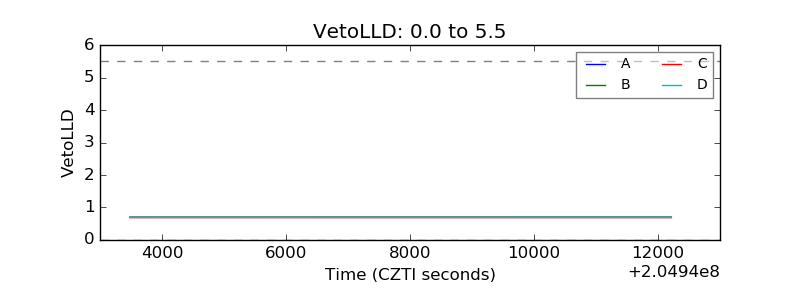 |
| Alpha Counter | 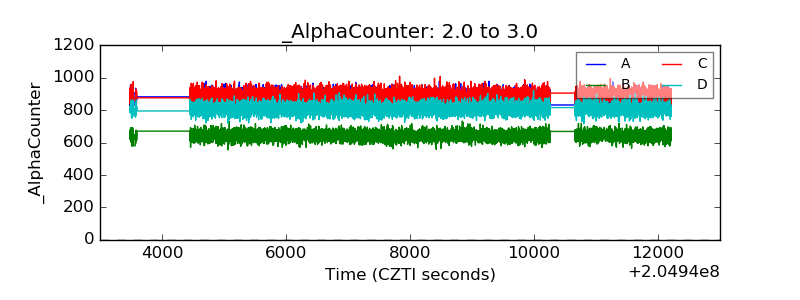 |
| _CPM_Rate | 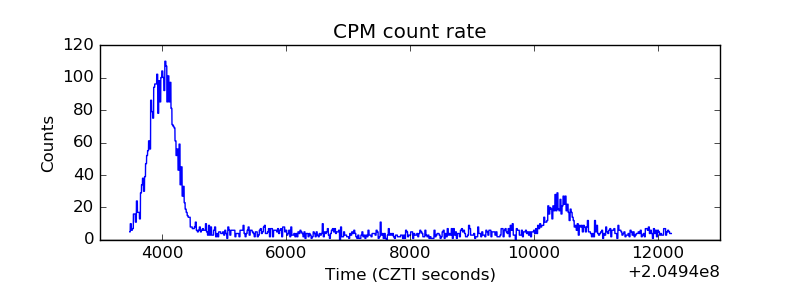 |
| CZT Counter | 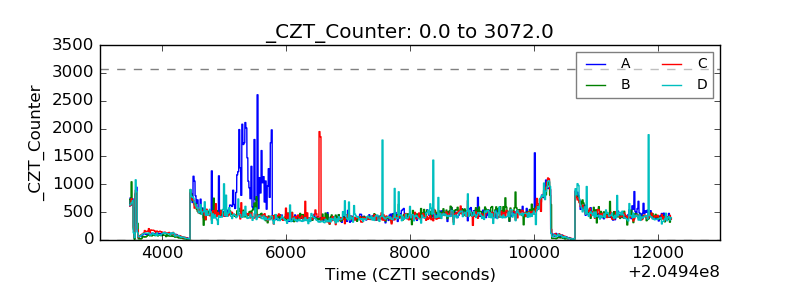 |
| +2.5 Volts monitor |  |
| +5 Volts monitor |  |
| _ROLL_ROT | 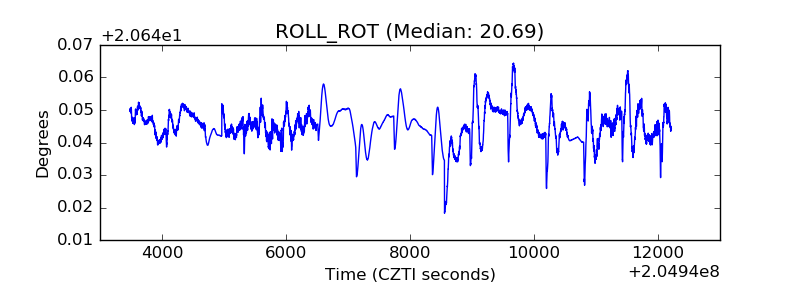 |
| _Roll_DEC | 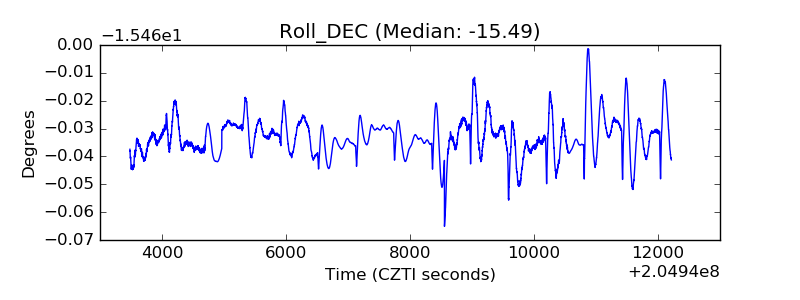 |
| _Roll_RA | 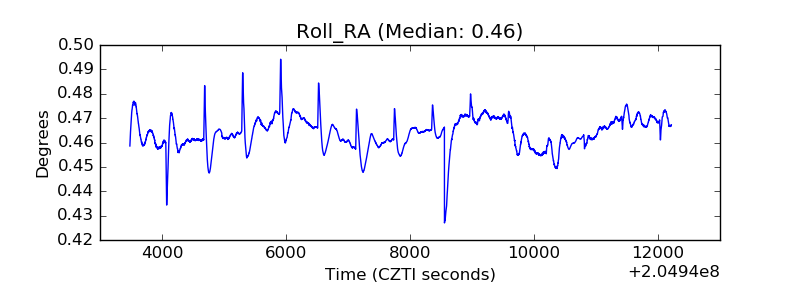 |
| Veto Counter | 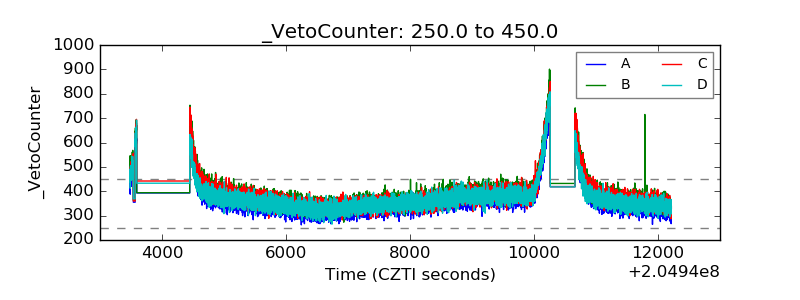 |