| Param | Original file | Final file |
|---|---|---|
| Filename | modeM0/AS1G05_222T01_9000000520_04090cztM0_level2.evt | modeM0/AS1G05_222T01_9000000520_04090cztM0_level2_quad_clean.evt |
| Size (bytes) | 1,667,537,280 | 252,132,480 |
| Size | 1.6 GB | 240.5 MB |
| Events in quadrant A | 11,314,075 | 1,507,390 |
| Events in quadrant B | 14,005,109 | 1,498,814 |
| Events in quadrant C | 11,564,352 | 1,499,181 |
| Events in quadrant D | 11,955,574 | 1,438,549 |
| Mode M9 | |||
|---|---|---|---|
| Quadrant | BADHDUFLAG | Total packets | Discarded packets |
| A | 0 | 20 | 0 |
| B | 0 | 20 | 0 |
| C | 0 | 20 | 0 |
| D | 0 | 20 | 0 |
| Mode SS | |||
|---|---|---|---|
| Quadrant | BADHDUFLAG | Total packets | Discarded packets |
| A | 0 | 502 | 0 |
| B | 0 | 502 | 0 |
| C | 0 | 502 | 0 |
| D | 0 | 502 | 0 |
| Mode M0 | |||
|---|---|---|---|
| Quadrant | BADHDUFLAG | Total packets | Discarded packets |
| A | 0 | 50908 | 112 |
| B | 0 | 57533 | 171 |
| C | 0 | 51953 | 127 |
| D | 0 | 53834 | 144 |
| Quadrant | Total seconds | Saturated seconds | Saturation percentage |
|---|---|---|---|
| A | 24581 | 486 | 1.977137% |
| B | 24576 | 861 | 3.503418% |
| C | 24575 | 492 | 2.002035% |
| D | 24573 | 577 | 2.348106% |
Noise dominated data is calculated using 1-second bins in cleaned event files. If a bin has >2000 counts, and if more than 50% of those come from <1% of pixels, then it is considered to be noise-dominated and hence unusable.
| Quadrant | # 1 sec bins | Bins with >0 counts | Bins with >2000 counts | High rate bins dominated by noise | Noise dominated (total time) | Noise dominated (detector-on time) | Marked lightcurve |
|---|---|---|---|---|---|---|---|
| A | 26686 | 24607 | 23 | 23 | 0.09% | 0.09% |  |
| B | 26686 | 24607 | 326 | 326 | 1.22% | 1.32% |  |
| C | 26686 | 24606 | 181 | 181 | 0.68% | 0.74% | 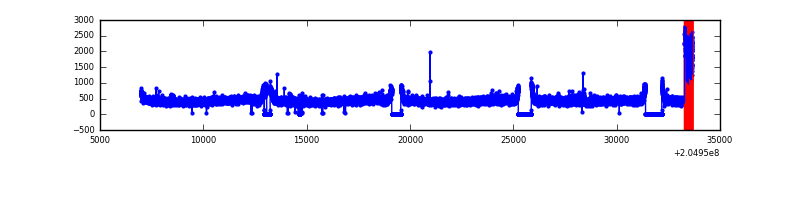 |
| D | 26686 | 24606 | 179 | 179 | 0.67% | 0.73% | 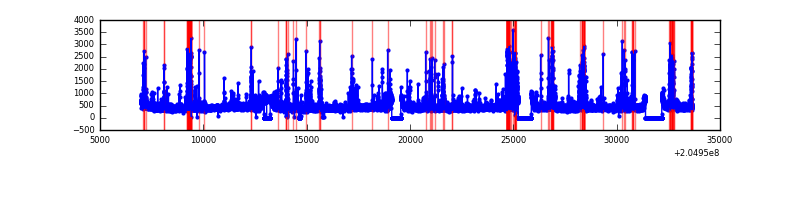 |
Top three noisy pixels from each quadrant. If the there are fewer than three noisy pixels in the level2.evt file, extra rows are filled as -1
| Pixel properties | Quadrant properties | ||||||
|---|---|---|---|---|---|---|---|
| Quadrant | DetID | PixID | Counts | Sigma | Mean | Median | Sigma |
| A | 15 | 234 | 132043 | 221.75 | 2837 | 2764 | 583.0 |
| A | 0 | 50 | 98232 | 163.76 | 2837 | 2764 | 583.0 |
| A | 0 | 199 | 83142 | 137.87 | 2837 | 2764 | 583.0 |
| B | 10 | 16 | 1582994 | 2905.32 | 2844 | 2775 | 543.9 |
| B | 3 | 0 | 580559 | 1062.29 | 2844 | 2775 | 543.9 |
| B | 14 | 167 | 307616 | 560.47 | 2844 | 2775 | 543.9 |
| C | 12 | 204 | 680976 | 1051.4 | 2763 | 2774 | 645.0 |
| C | 8 | 128 | 25617 | 35.41 | 2763 | 2774 | 645.0 |
| C | 9 | 144 | 25516 | 35.26 | 2763 | 2774 | 645.0 |
| D | 12 | 233 | 275476 | 407.61 | 2757 | 2666 | 669.3 |
| D | 13 | 239 | 271171 | 401.18 | 2757 | 2666 | 669.3 |
| D | 11 | 132 | 195984 | 288.84 | 2757 | 2666 | 669.3 |
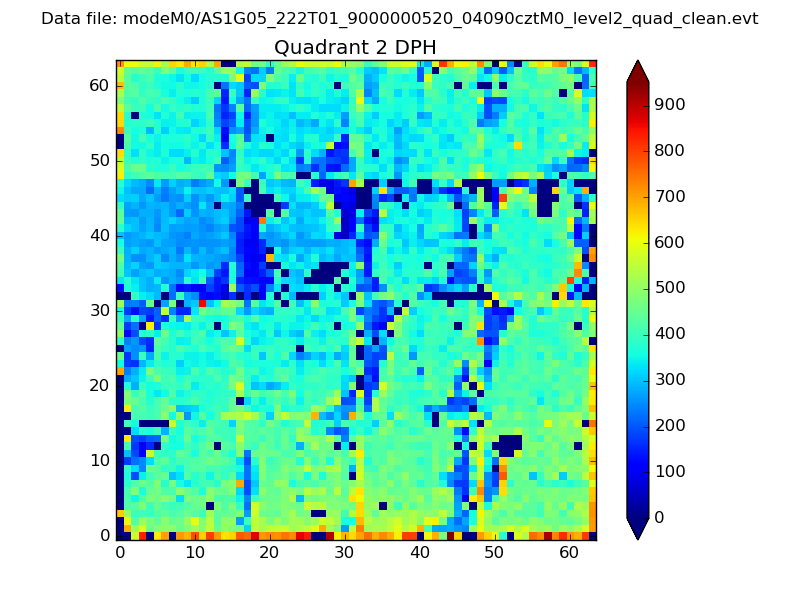
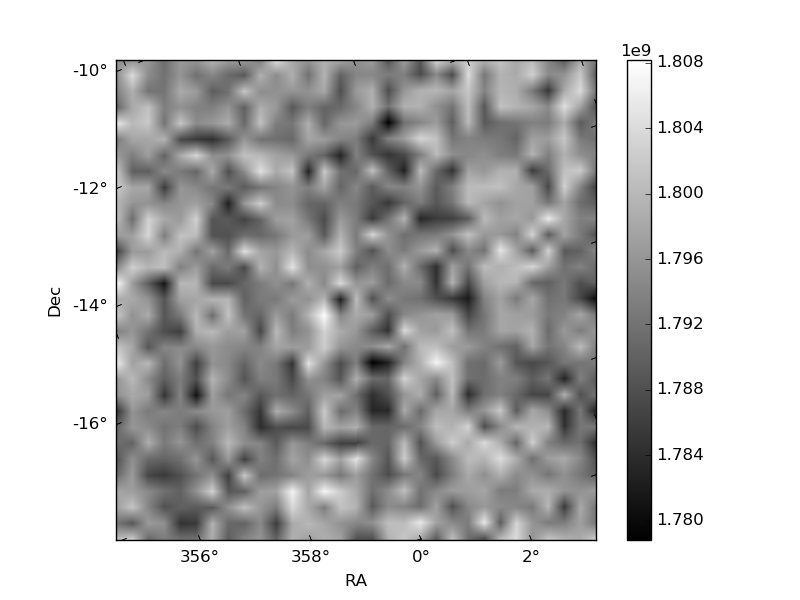
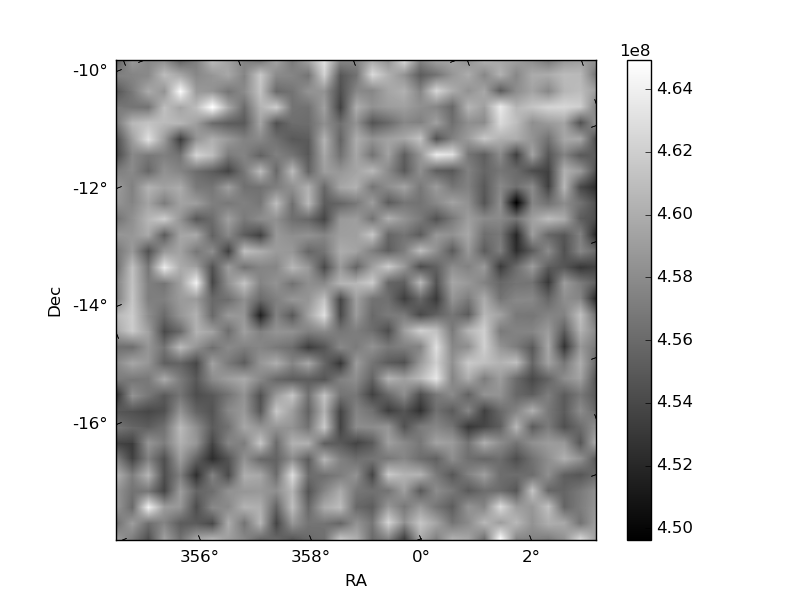
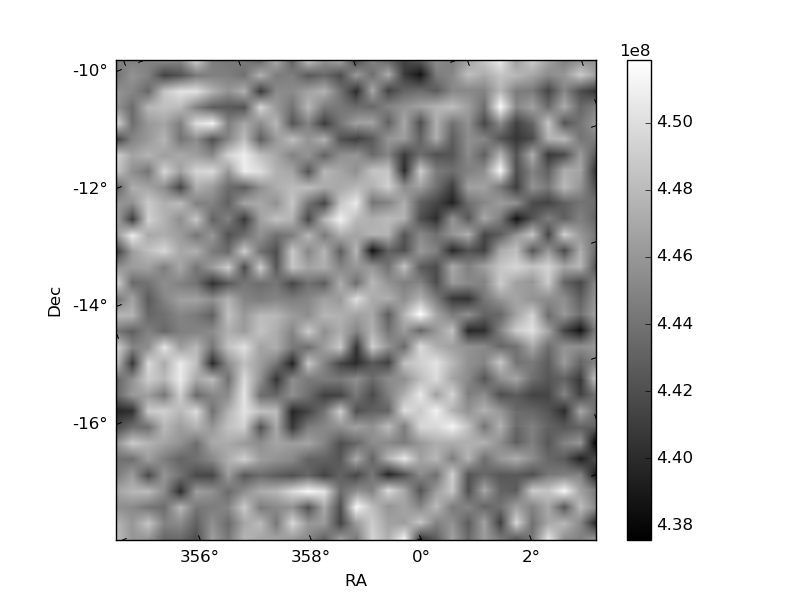
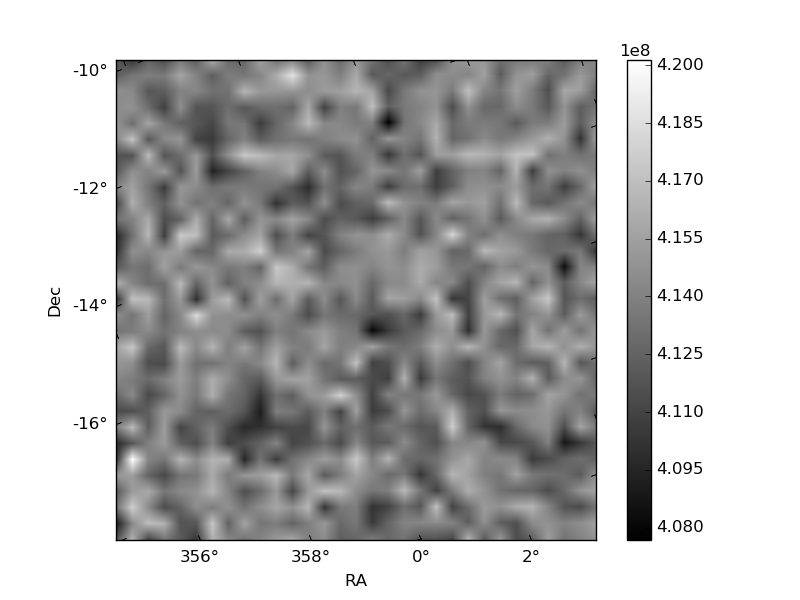
Histogram calculated using DETX and DETY for each event in the final _common_clean file
| Quadrant A |  |
 |
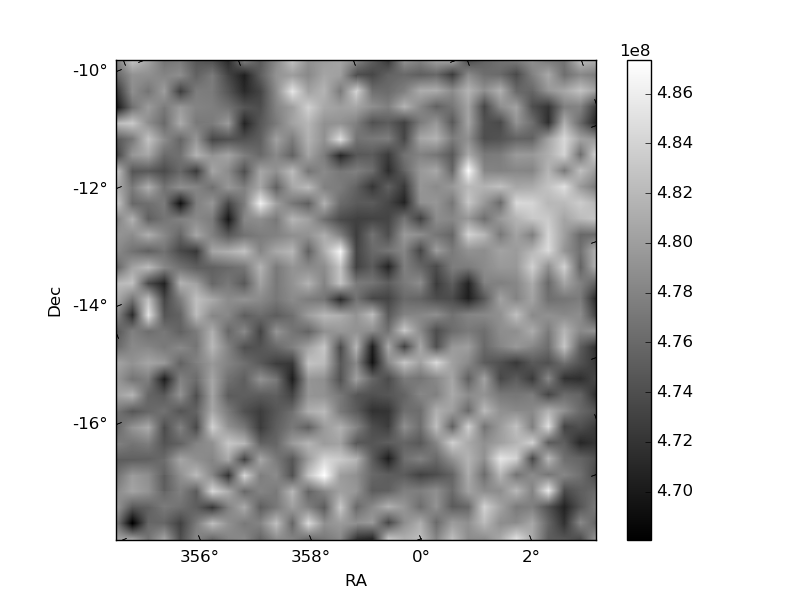
Quadrant B |
|---|---|---|---|
| Quadrant D | 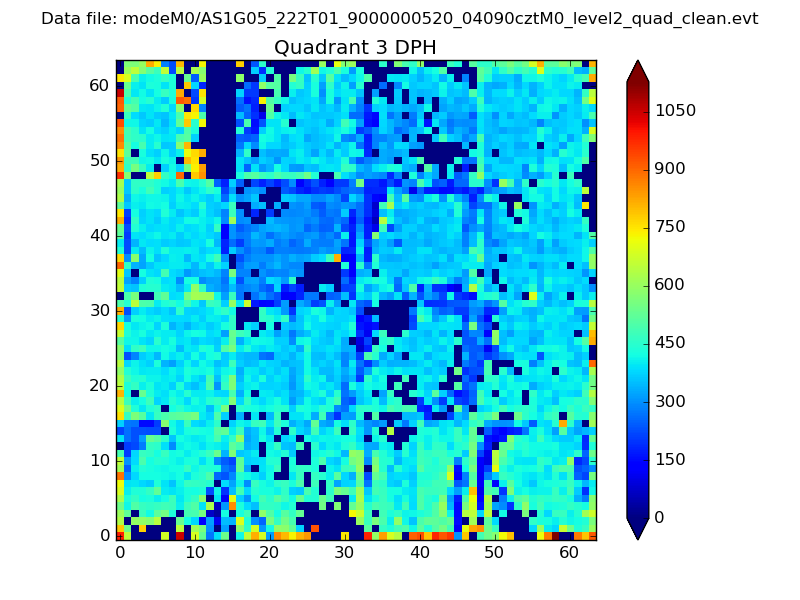 |
 |
Quadrant C |
| Plot type | Count rate plots | Images |
|---|---|---|
| Comparison with Poisson distribution Blue bars denote a histogram of data divided into 1 sec bins. Red curve is a Poisson curve with rate = median count rate of data. |
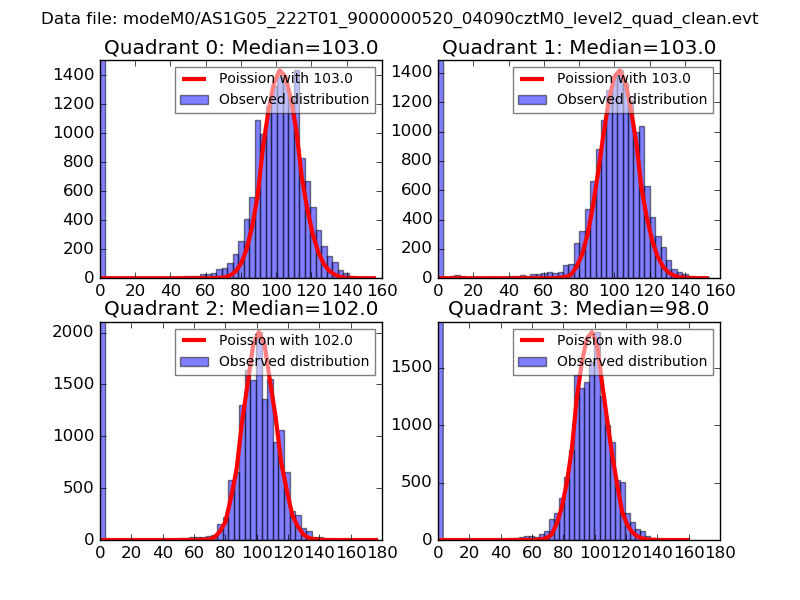 |
 |
| Quadrant-wise count rates Data is divided into 100 sec bins |
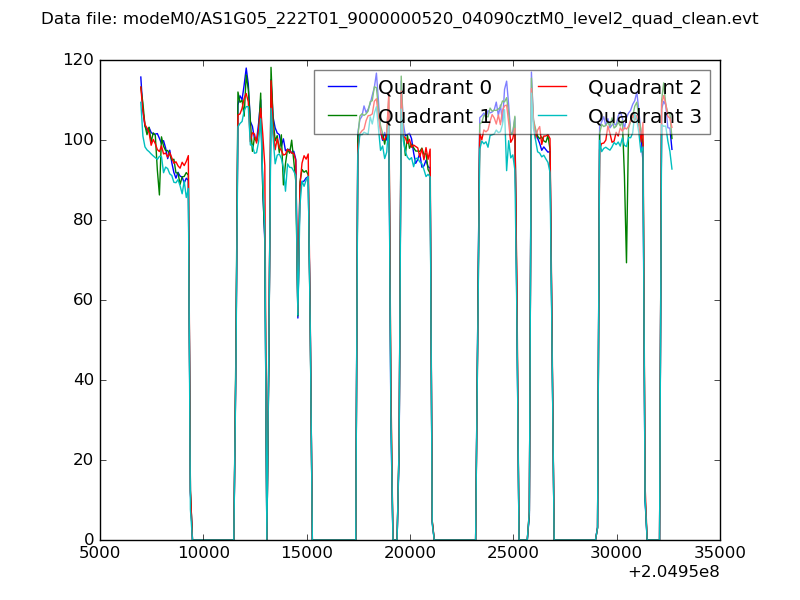 |
|
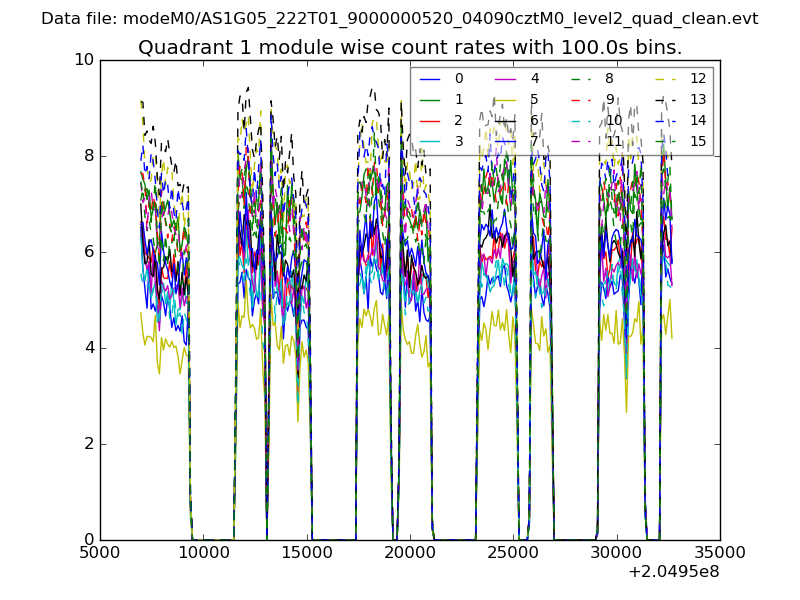
| Module-wise count rates for Quadrant A Data is divided into 100 sec bins |
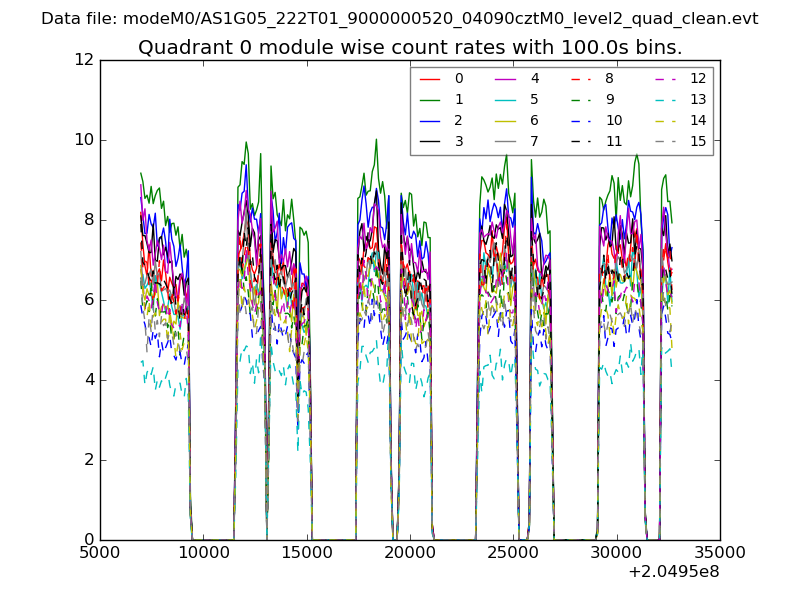 |
 |
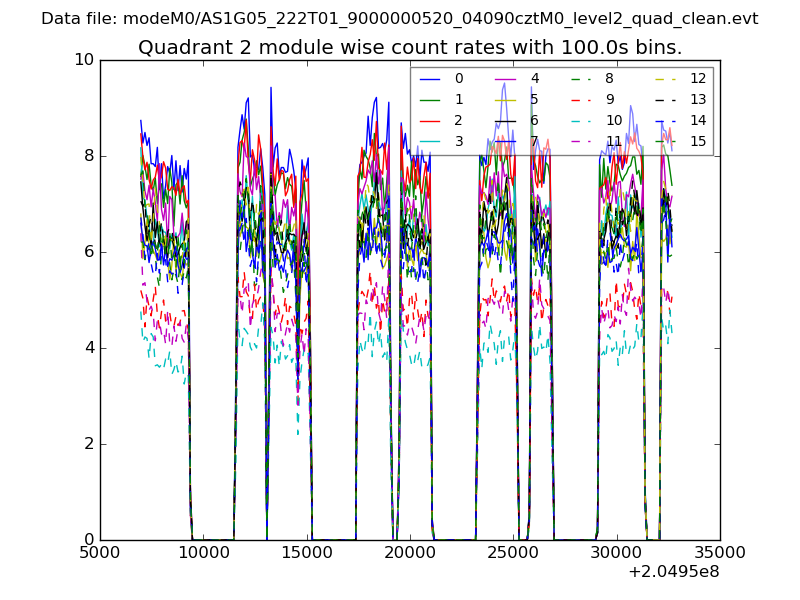
| Module-wise count rates for Quadrant B Data is divided into 100 sec bins |
 |
 |
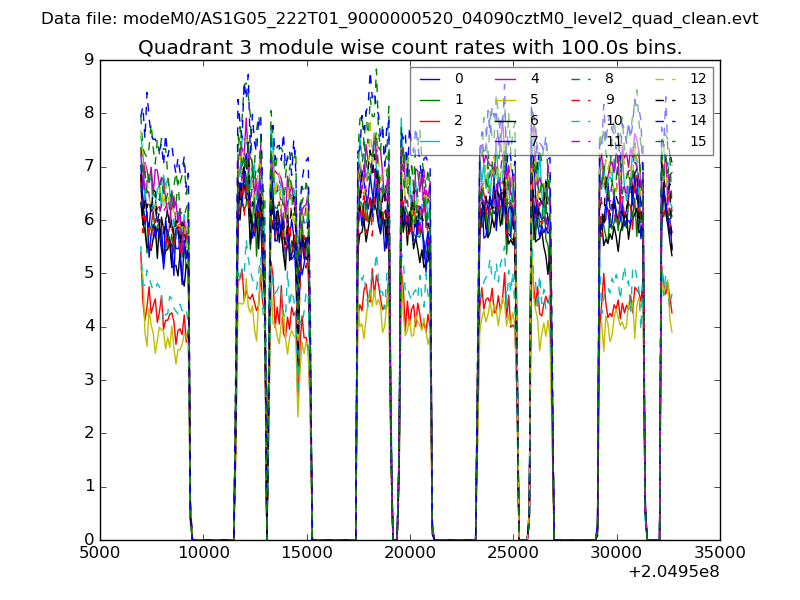
| Module-wise count rates for Quadrant C Data is divided into 100 sec bins |
 |
 |
| Module-wise count rates for Quadrant D Data is divided into 100 sec bins |
 |
 |
| Parameter | Plot |
|---|---|
| CZT HV Monitor | 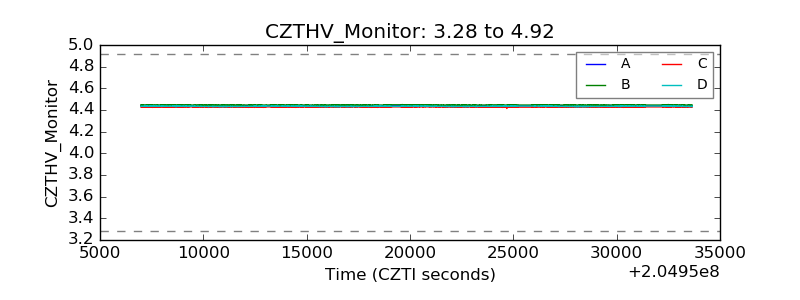 |
| D_VDD | 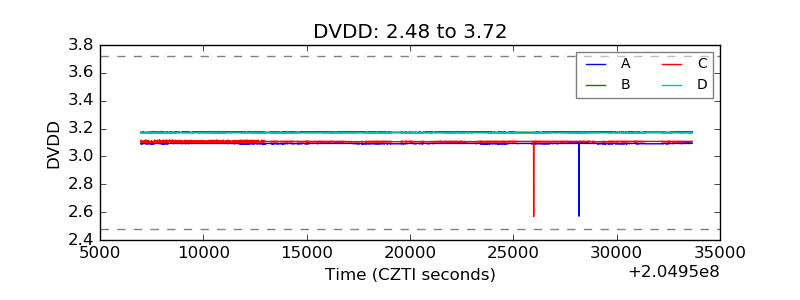 |
| Temperature 1 | 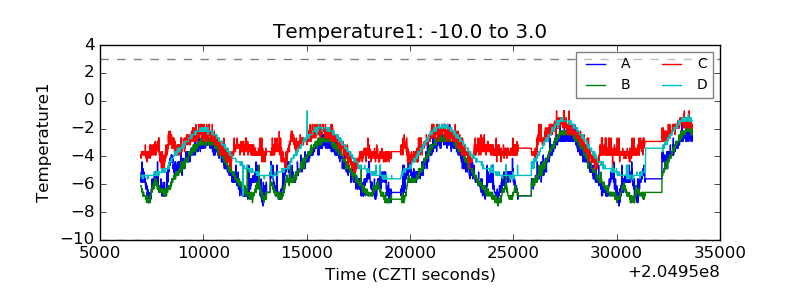 |
| Veto HV Monitor | 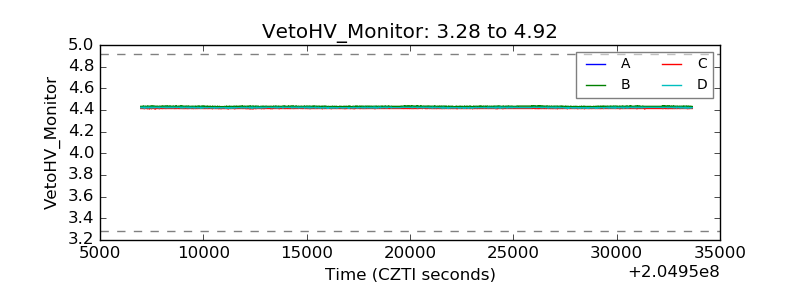 |
| Veto LLD | 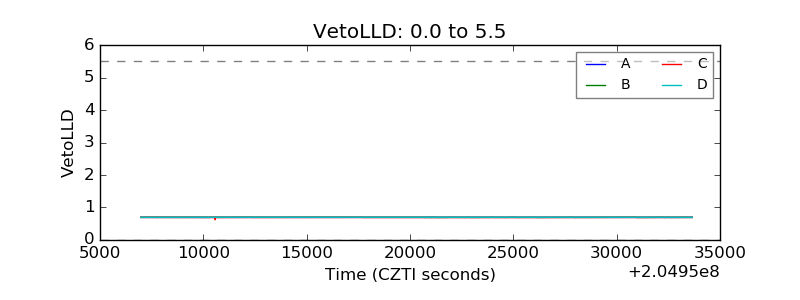 |
| Alpha Counter | 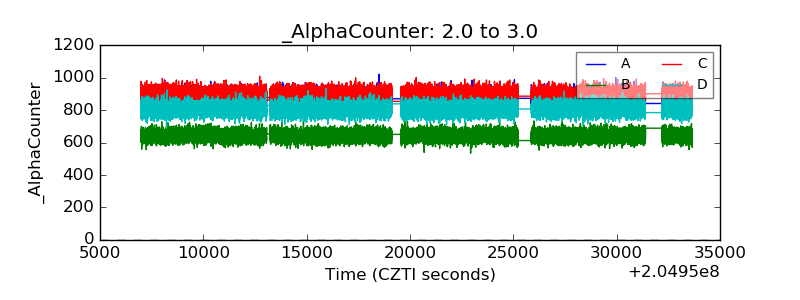 |
| _CPM_Rate | 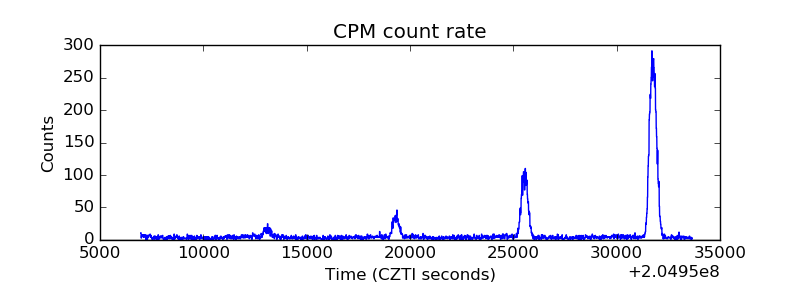 |
| CZT Counter | 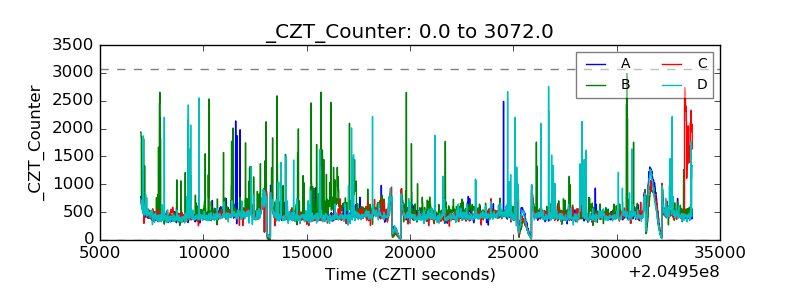 |
| +2.5 Volts monitor | 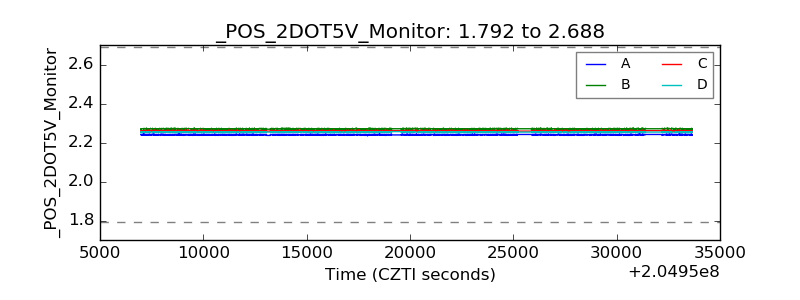 |
| +5 Volts monitor |  |
| _ROLL_ROT | 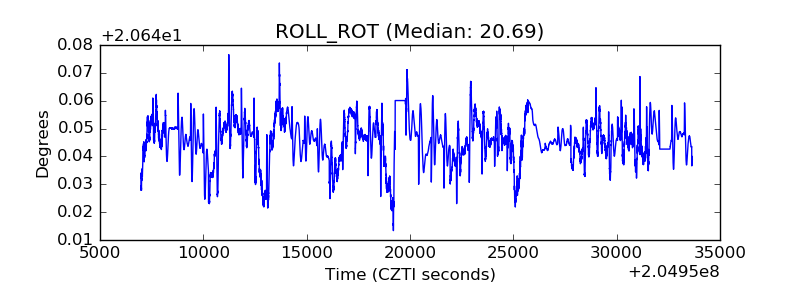 |
| _Roll_DEC | 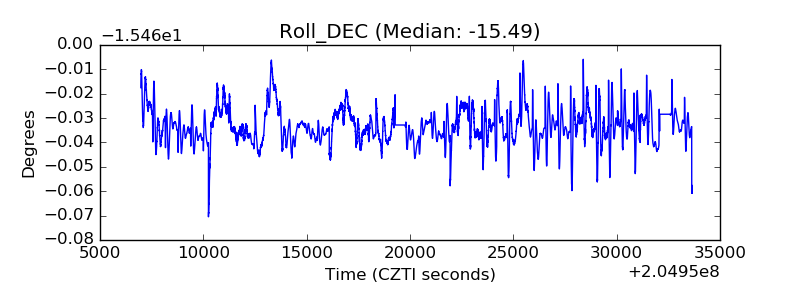 |
| _Roll_RA | 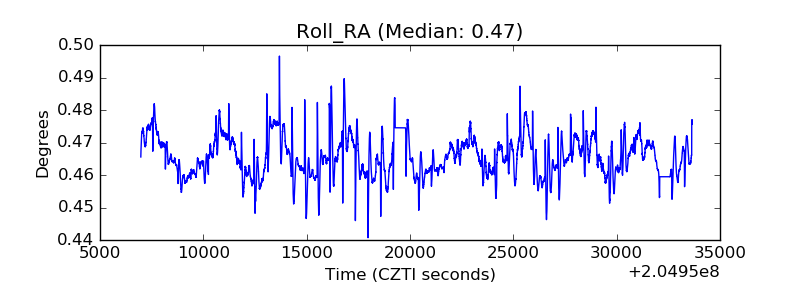 |
| Veto Counter | 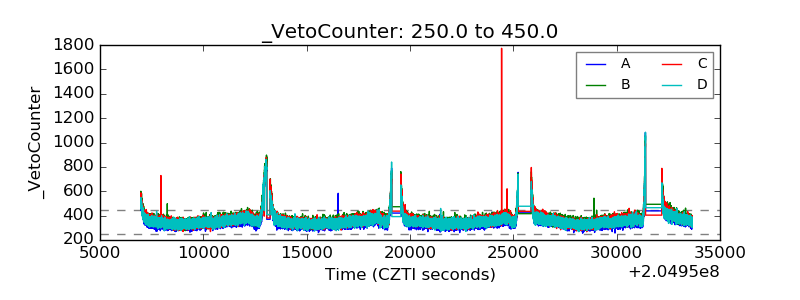 |