| Param | Original file | Final file |
|---|---|---|
| Filename | modeM0/AS1G05_222T01_9000000520_04093cztM0_level2.evt | modeM0/AS1G05_222T01_9000000520_04093cztM0_level2_quad_clean.evt |
| Size (bytes) | 741,061,440 | 52,643,520 |
| Size | 706.7 MB | 50.2 MB |
| Events in quadrant A | 3,643,116 | 310,409 |
| Events in quadrant B | 3,680,536 | 310,047 |
| Events in quadrant C | 11,462,385 | 219,553 |
| Events in quadrant D | 3,213,882 | 295,766 |
| Mode M9 | |||
|---|---|---|---|
| Quadrant | BADHDUFLAG | Total packets | Discarded packets |
| A | 0 | 11 | 0 |
| B | 0 | 11 | 0 |
| C | 0 | 11 | 0 |
| D | 0 | 12 | 0 |
| Mode SS | |||
|---|---|---|---|
| Quadrant | BADHDUFLAG | Total packets | Discarded packets |
| A | 0 | 134 | 0 |
| B | 0 | 134 | 0 |
| C | 0 | 134 | 0 |
| D | 0 | 134 | 0 |
| Mode M0 | |||
|---|---|---|---|
| Quadrant | BADHDUFLAG | Total packets | Discarded packets |
| A | 0 | 15074 | 3 |
| B | 0 | 15207 | 2 |
| C | 0 | 38433 | 9 |
| D | 0 | 14195 | 4 |
| Quadrant | Total seconds | Saturated seconds | Saturation percentage |
|---|---|---|---|
| A | 6548 | 84 | 1.282834% |
| B | 6548 | 173 | 2.642028% |
| C | 6547 | 3259 | 49.778525% |
| D | 6547 | 72 | 1.099740% |
Noise dominated data is calculated using 1-second bins in cleaned event files. If a bin has >2000 counts, and if more than 50% of those come from <1% of pixels, then it is considered to be noise-dominated and hence unusable.
| Quadrant | # 1 sec bins | Bins with >0 counts | Bins with >2000 counts | High rate bins dominated by noise | Noise dominated (total time) | Noise dominated (detector-on time) | Marked lightcurve |
|---|---|---|---|---|---|---|---|
| A | 7648 | 6548 | 4 | 4 | 0.05% | 0.06% | 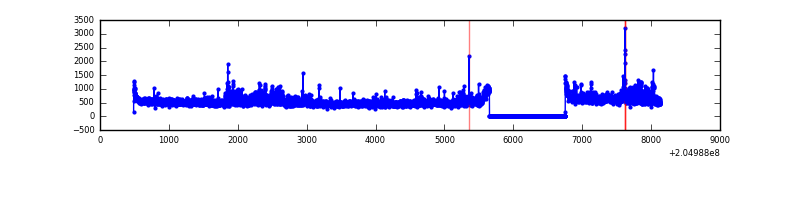 |
| B | 7648 | 6548 | 84 | 84 | 1.10% | 1.28% | 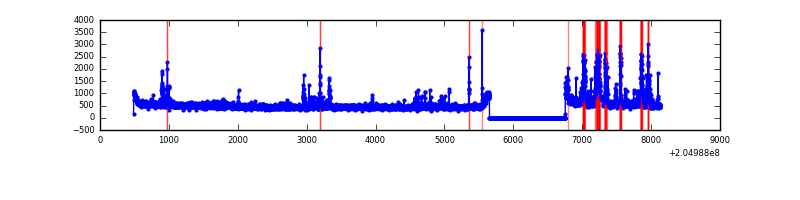 |
| C | 7647 | 6547 | 3286 | 3286 | 42.97% | 50.19% | 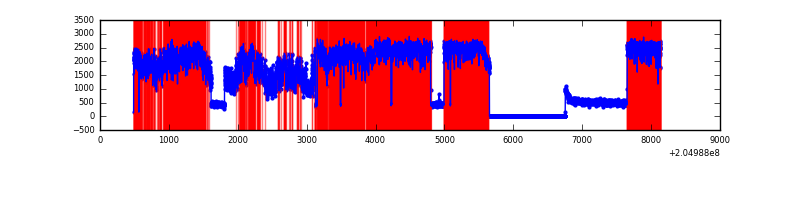 |
| D | 7648 | 6548 | 25 | 25 | 0.33% | 0.38% | 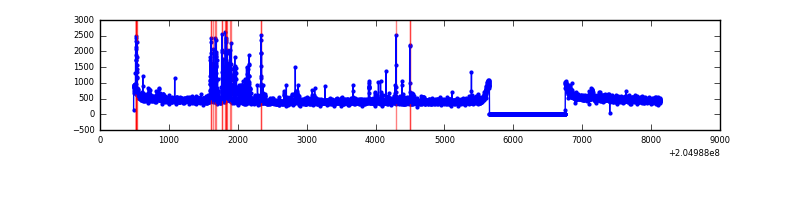 |
Top three noisy pixels from each quadrant. If the there are fewer than three noisy pixels in the level2.evt file, extra rows are filled as -1
| Pixel properties | Quadrant properties | ||||||
|---|---|---|---|---|---|---|---|
| Quadrant | DetID | PixID | Counts | Sigma | Mean | Median | Sigma |
| A | 0 | 199 | 509465 | 3131.38 | 794 | 775 | 162.4 |
| A | 0 | 226 | 55275 | 335.49 | 794 | 775 | 162.4 |
| A | 0 | 118 | 14802 | 86.35 | 794 | 775 | 162.4 |
| B | 10 | 16 | 266567 | 1729.14 | 798 | 780 | 153.7 |
| B | 14 | 167 | 154123 | 997.61 | 798 | 780 | 153.7 |
| B | 3 | 0 | 71468 | 459.88 | 798 | 780 | 153.7 |
| C | 12 | 204 | 8874781 | 57948.77 | 660 | 663 | 153.1 |
| C | 13 | 61 | 5338 | 30.53 | 660 | 663 | 153.1 |
| C | 12 | 4 | 3697 | 19.81 | 660 | 663 | 153.1 |
| D | 12 | 233 | 221662 | 1201.61 | 766 | 745 | 183.9 |
| D | 13 | 223 | 27573 | 145.92 | 766 | 745 | 183.9 |
| D | 13 | 239 | 21978 | 115.49 | 766 | 745 | 183.9 |
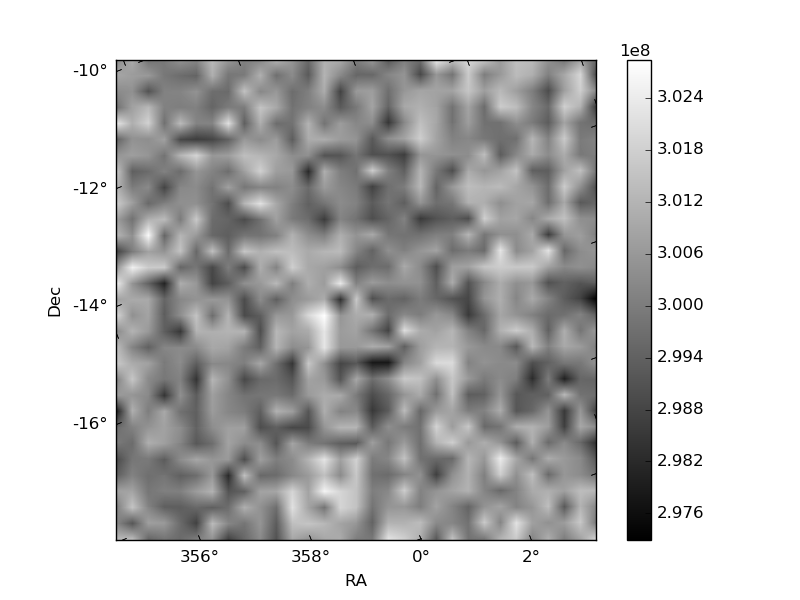
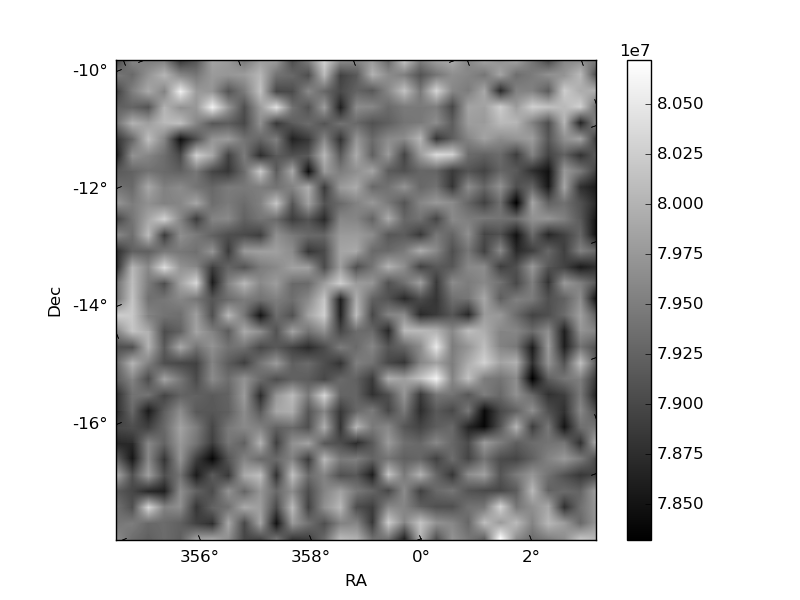
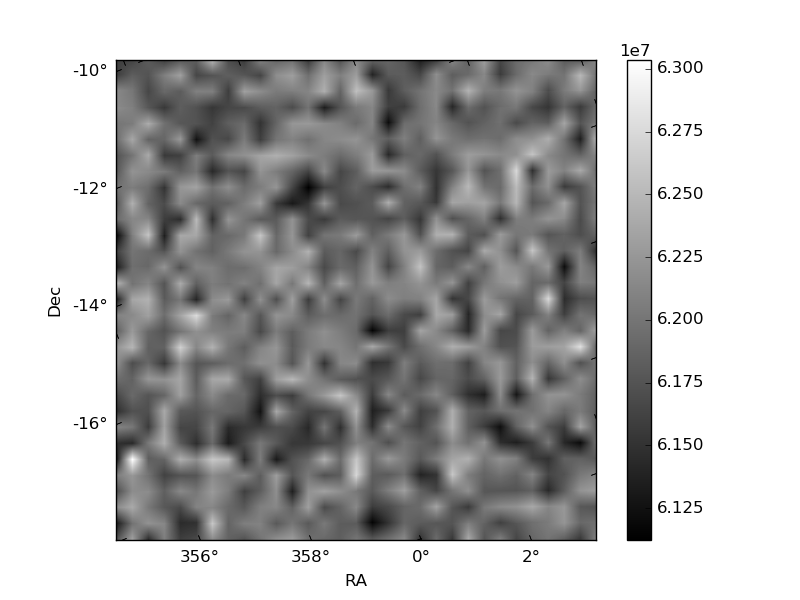
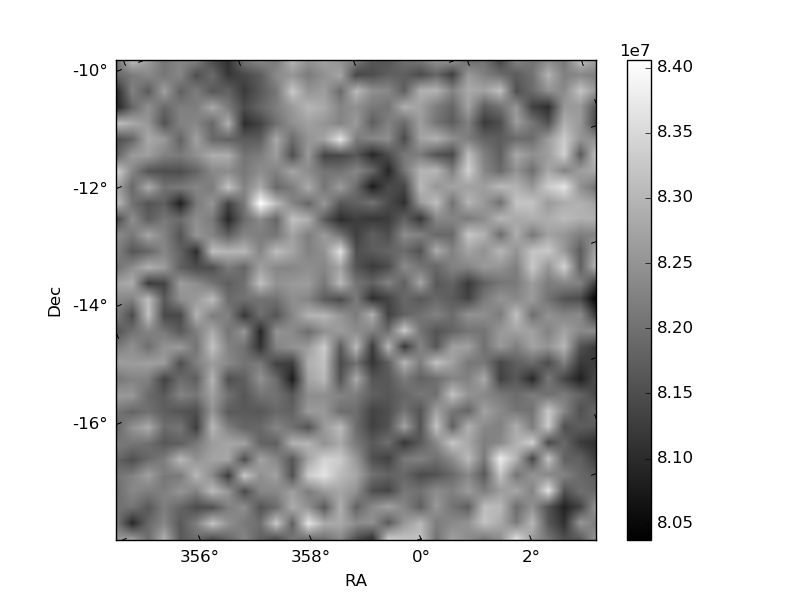
Histogram calculated using DETX and DETY for each event in the final _common_clean file
| Quadrant A | 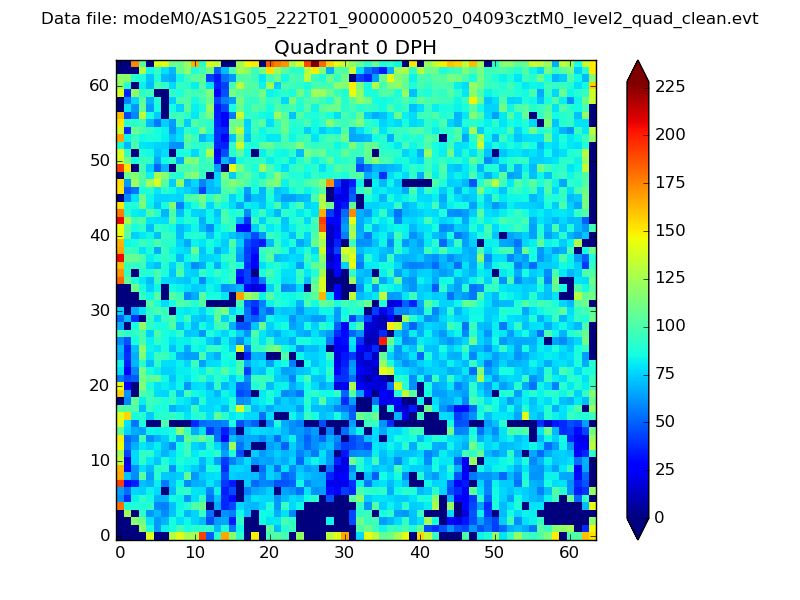 |
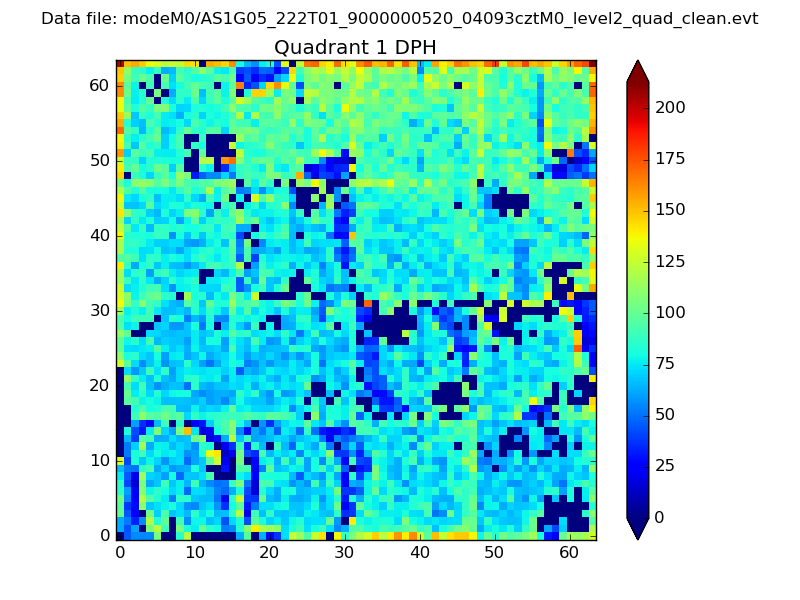 |
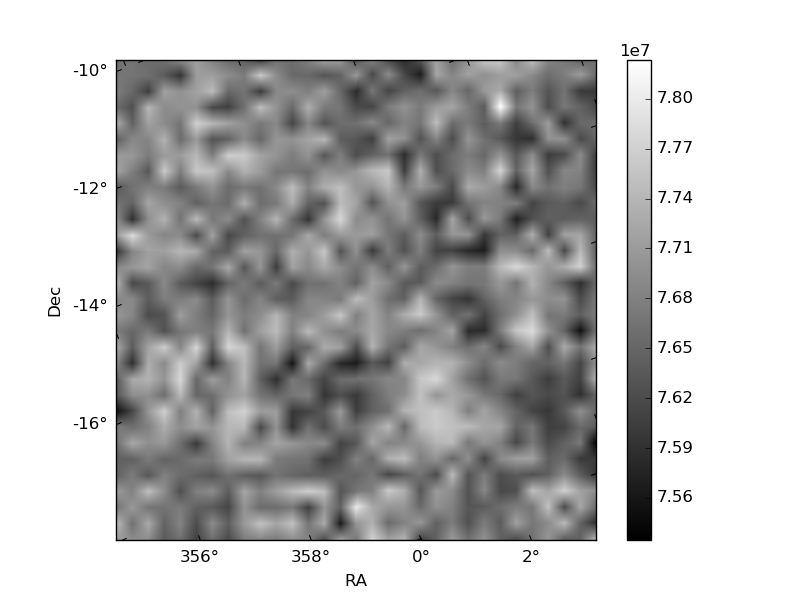
Quadrant B |
|---|---|---|---|
| Quadrant D | 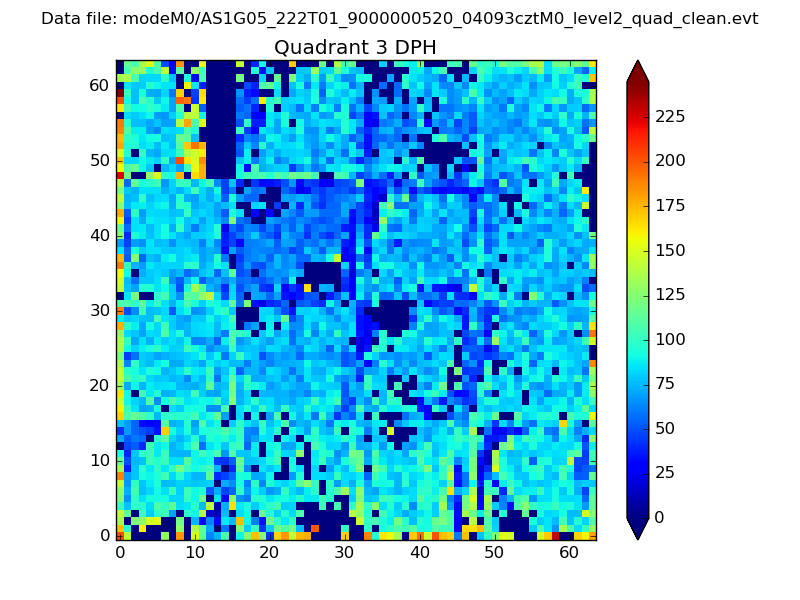 |
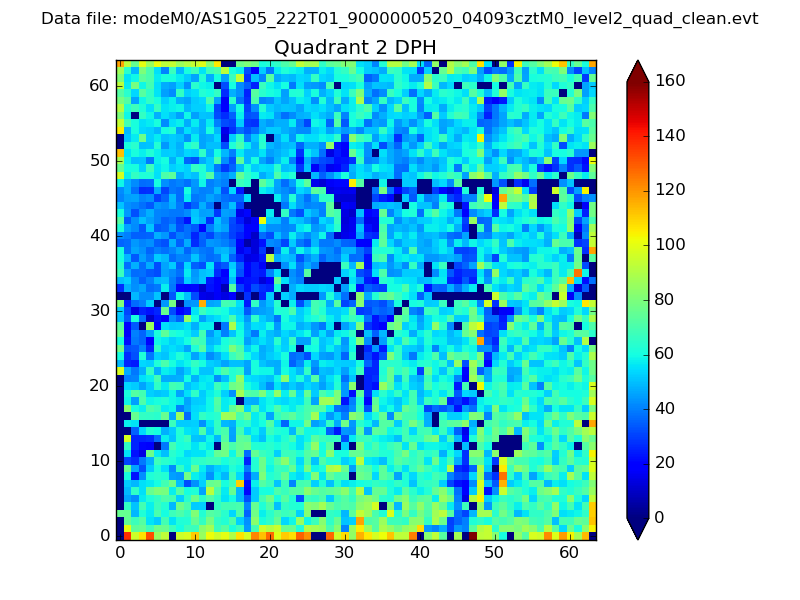 |
Quadrant C |
| Plot type | Count rate plots | Images |
|---|---|---|
| Comparison with Poisson distribution Blue bars denote a histogram of data divided into 1 sec bins. Red curve is a Poisson curve with rate = median count rate of data. |
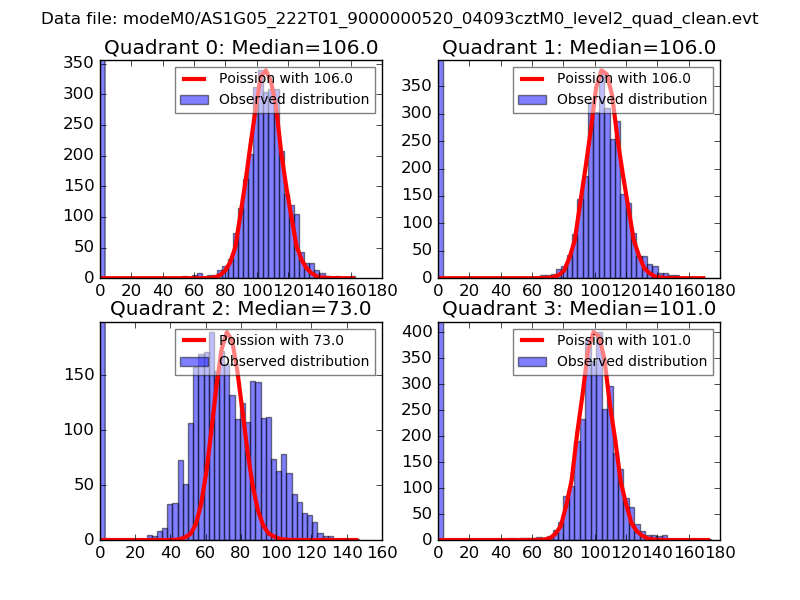 |
 |
| Quadrant-wise count rates Data is divided into 100 sec bins |
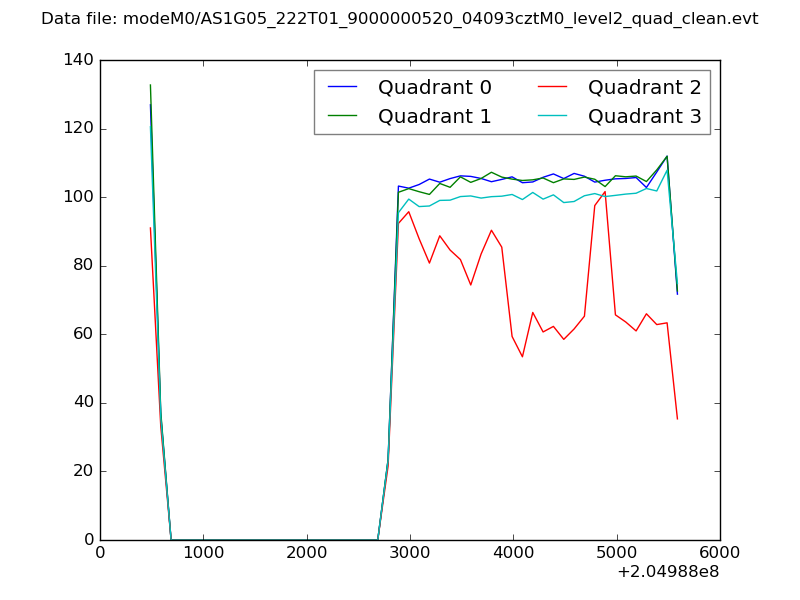 |
|
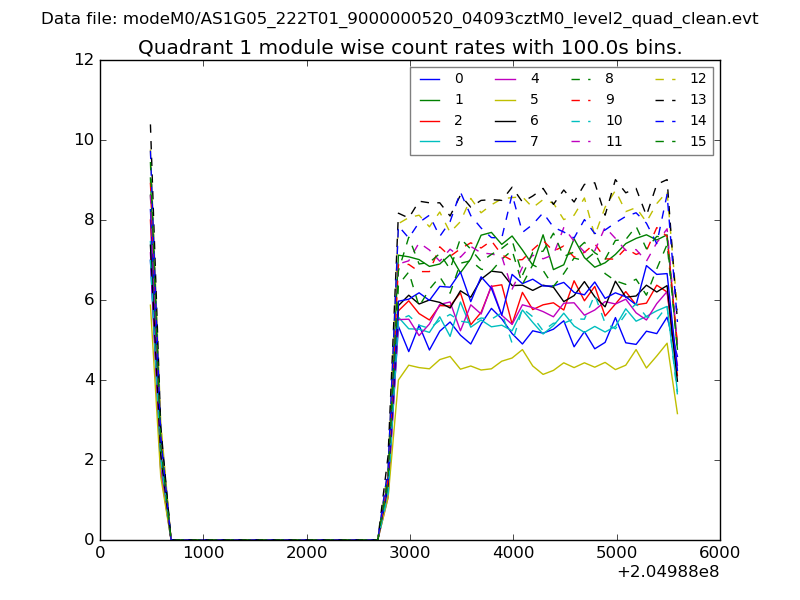
| Module-wise count rates for Quadrant A Data is divided into 100 sec bins |
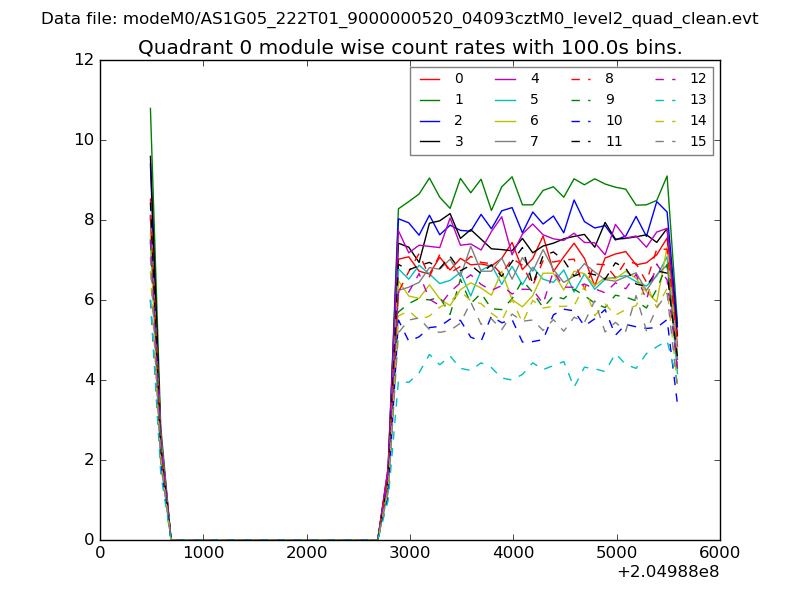 |
 |
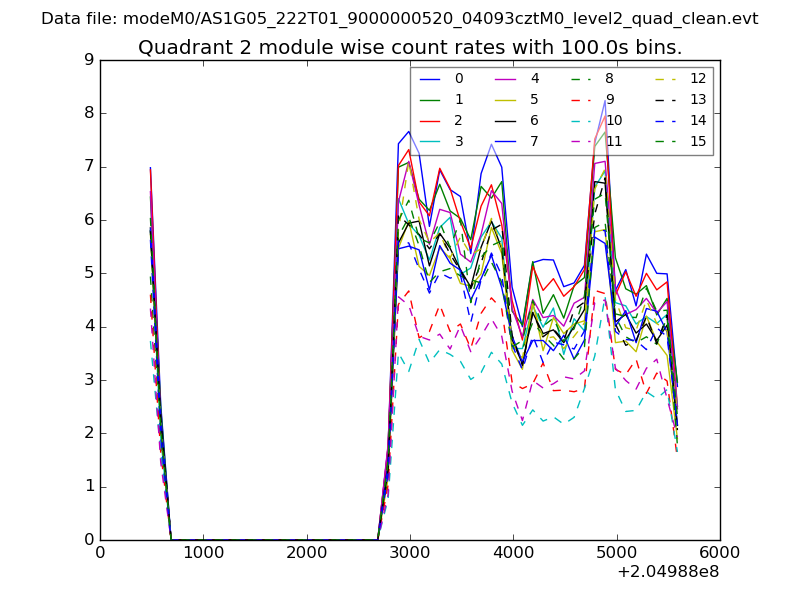
| Module-wise count rates for Quadrant B Data is divided into 100 sec bins |
 |
 |
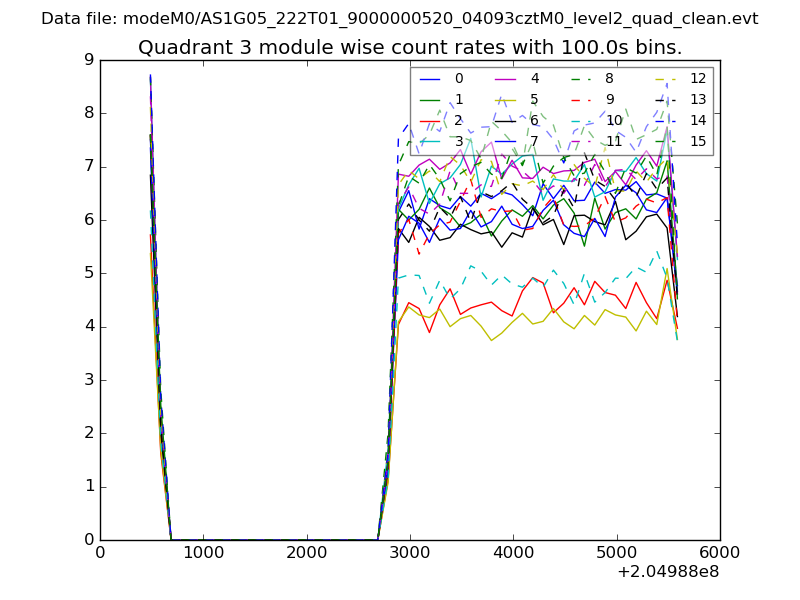
| Module-wise count rates for Quadrant C Data is divided into 100 sec bins |
 |
 |
| Module-wise count rates for Quadrant D Data is divided into 100 sec bins |
 |
 |
| Parameter | Plot |
|---|---|
| CZT HV Monitor | 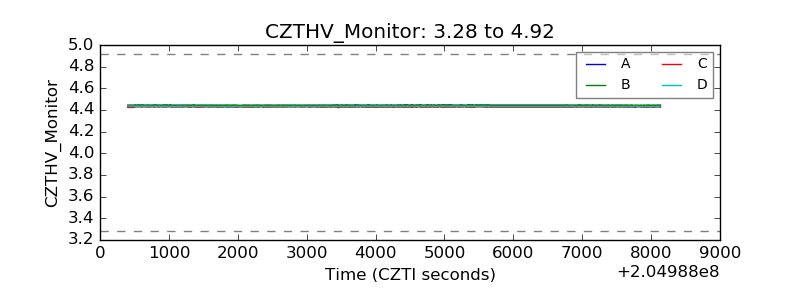 |
| D_VDD | 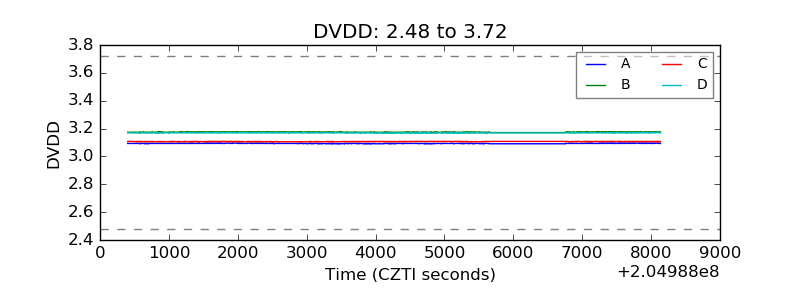 |
| Temperature 1 | 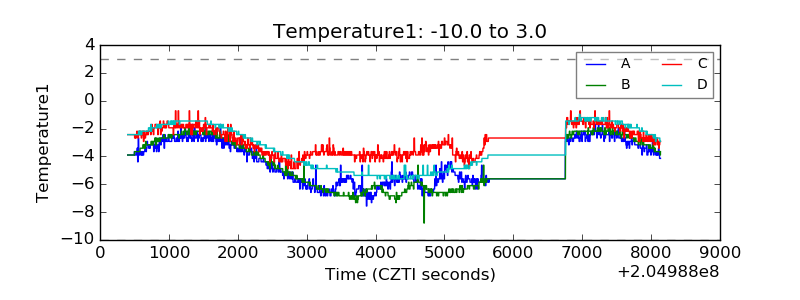 |
| Veto HV Monitor | 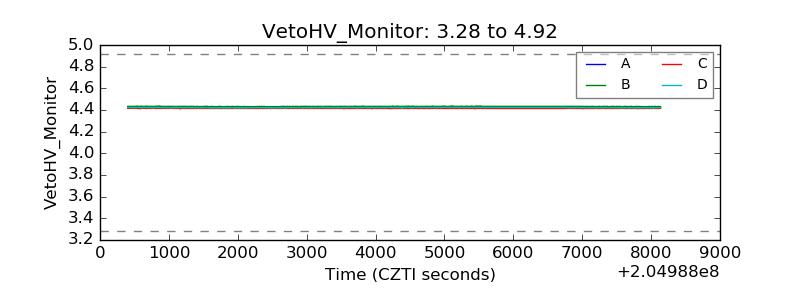 |
| Veto LLD | 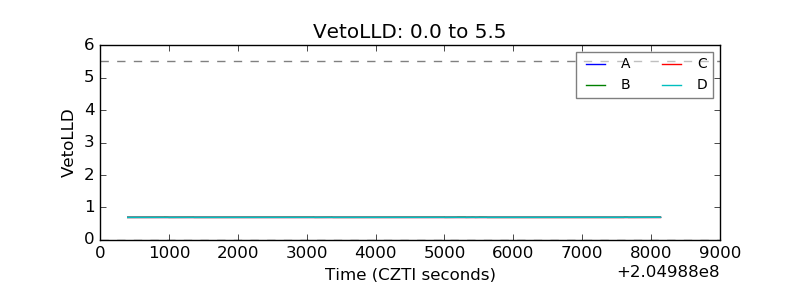 |
| Alpha Counter | 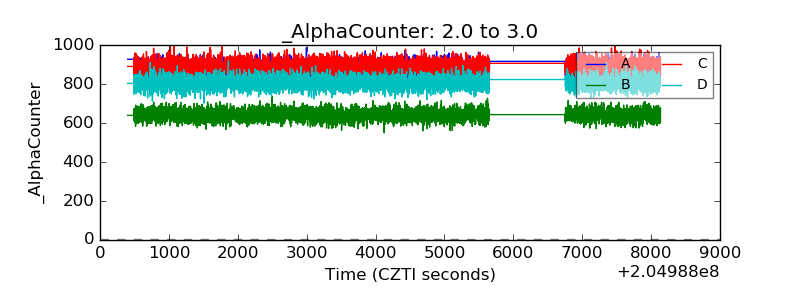 |
| _CPM_Rate | 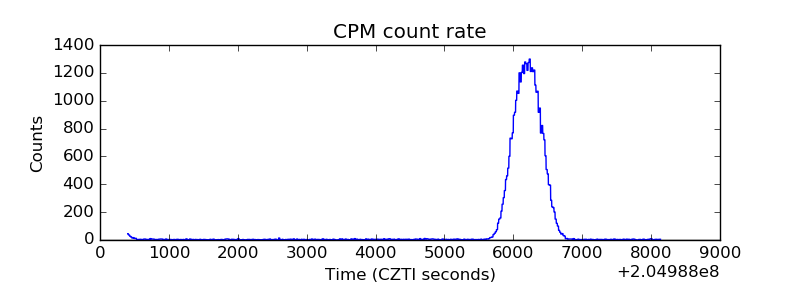 |
| CZT Counter | 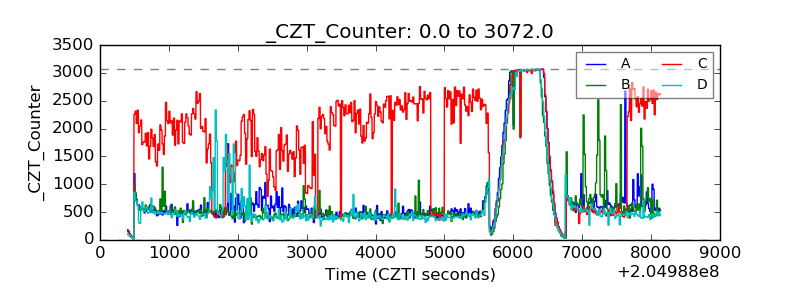 |
| +2.5 Volts monitor |  |
| +5 Volts monitor |  |
| _ROLL_ROT | 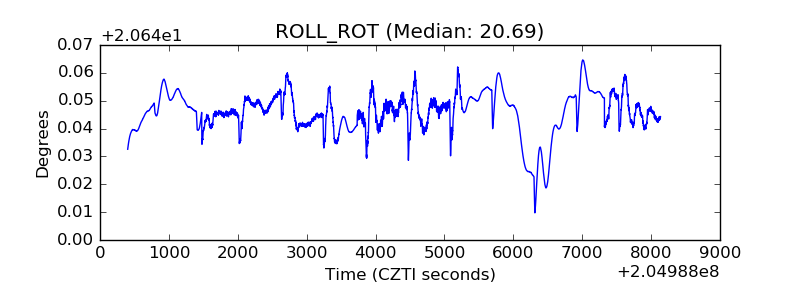 |
| _Roll_DEC | 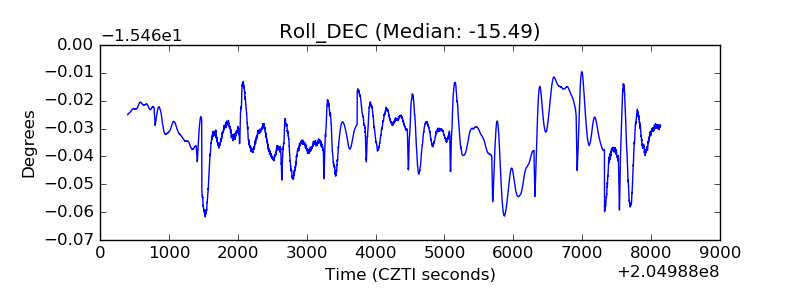 |
| _Roll_RA | 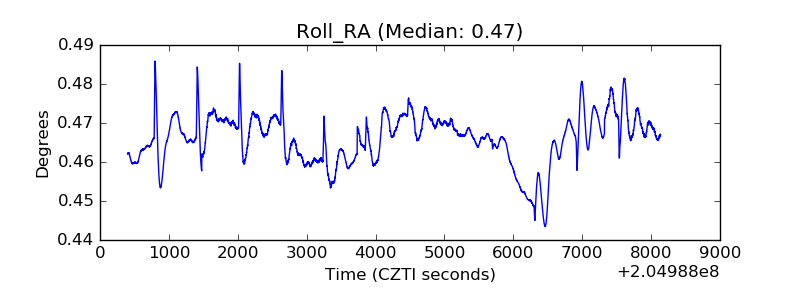 |
| Veto Counter | 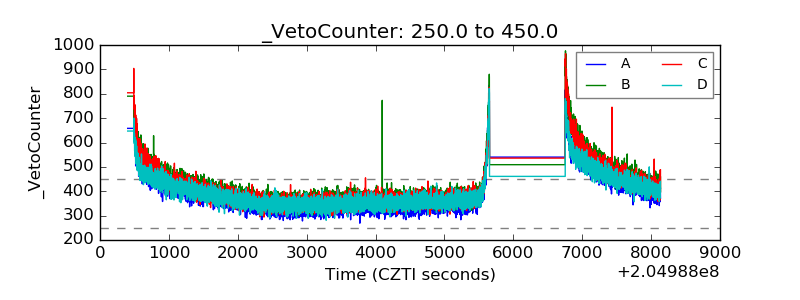 |