| Param | Original file | Final file |
|---|---|---|
| Filename | modeM0/AS1G05_222T01_9000000520_04094cztM0_level2.evt | modeM0/AS1G05_222T01_9000000520_04094cztM0_level2_quad_clean.evt |
| Size (bytes) | 288,987,840 | 11,635,200 |
| Size | 275.6 MB | 11.1 MB |
| Events in quadrant A | 1,422,122 | 50,500 |
| Events in quadrant B | 1,724,192 | 49,755 |
| Events in quadrant C | 4,282,351 | 29,658 |
| Events in quadrant D | 1,157,032 | 47,115 |
| Mode M9 | |||
|---|---|---|---|
| Quadrant | BADHDUFLAG | Total packets | Discarded packets |
| A | 0 | 5 | 0 |
| B | 0 | 5 | 0 |
| C | 0 | 5 | 0 |
| D | 0 | 6 | 0 |
| Mode SS | |||
|---|---|---|---|
| Quadrant | BADHDUFLAG | Total packets | Discarded packets |
| A | 0 | 48 | 0 |
| B | 0 | 48 | 0 |
| C | 0 | 48 | 0 |
| D | 0 | 48 | 0 |
| Mode M0 | |||
|---|---|---|---|
| Quadrant | BADHDUFLAG | Total packets | Discarded packets |
| A | 0 | 5925 | 1 |
| B | 0 | 6709 | 1 |
| C | 0 | 14252 | 1 |
| D | 0 | 5069 | 1 |
| Quadrant | Total seconds | Saturated seconds | Saturation percentage |
|---|---|---|---|
| A | 2424 | 23 | 0.948845% |
| B | 2424 | 124 | 5.115512% |
| C | 2424 | 1524 | 62.871287% |
| D | 2424 | 6 | 0.247525% |
Noise dominated data is calculated using 1-second bins in cleaned event files. If a bin has >2000 counts, and if more than 50% of those come from <1% of pixels, then it is considered to be noise-dominated and hence unusable.
| Quadrant | # 1 sec bins | Bins with >0 counts | Bins with >2000 counts | High rate bins dominated by noise | Noise dominated (total time) | Noise dominated (detector-on time) | Marked lightcurve |
|---|---|---|---|---|---|---|---|
| A | 2424 | 2424 | 4 | 4 | 0.17% | 0.17% | 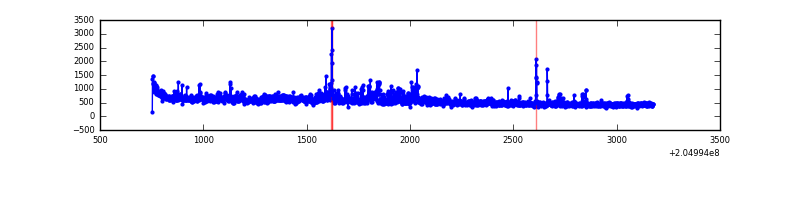 |
| B | 2424 | 2424 | 86 | 86 | 3.55% | 3.55% | 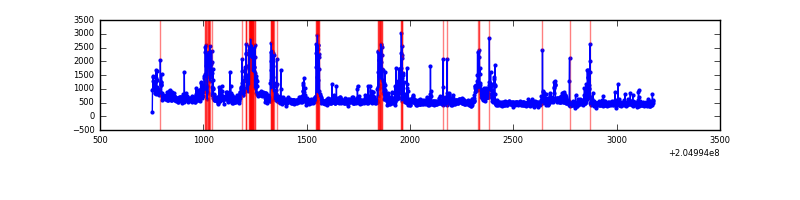 |
| C | 2423 | 2423 | 1485 | 1485 | 61.29% | 61.29% | 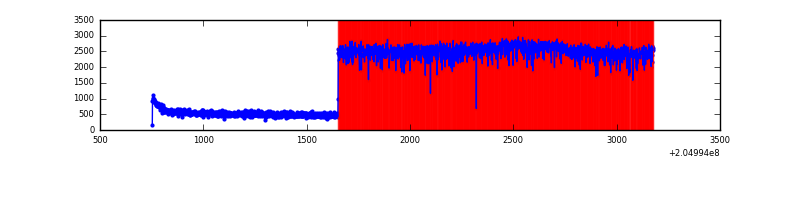 |
| D | 2424 | 2424 | 1 | 1 | 0.04% | 0.04% | 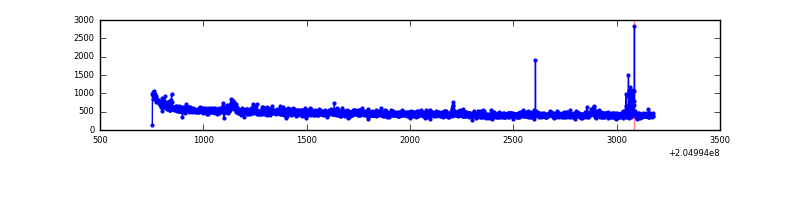 |
Top three noisy pixels from each quadrant. If the there are fewer than three noisy pixels in the level2.evt file, extra rows are filled as -1
| Pixel properties | Quadrant properties | ||||||
|---|---|---|---|---|---|---|---|
| Quadrant | DetID | PixID | Counts | Sigma | Mean | Median | Sigma |
| A | 0 | 199 | 187311 | 2928.06 | 306 | 299 | 63.9 |
| A | 0 | 118 | 24204 | 374.28 | 306 | 299 | 63.9 |
| A | 0 | 226 | 22154 | 342.18 | 306 | 299 | 63.9 |
| B | 10 | 16 | 272846 | 4576.02 | 305 | 298 | 59.6 |
| B | 14 | 167 | 122990 | 2059.97 | 305 | 298 | 59.6 |
| B | 3 | 0 | 98431 | 1647.63 | 305 | 298 | 59.6 |
| C | 12 | 204 | 3391837 | 63407.84 | 227 | 228 | 53.5 |
| C | 13 | 61 | 1782 | 29.05 | 227 | 228 | 53.5 |
| C | 12 | 4 | 600 | 6.95 | 227 | 228 | 53.5 |
| D | 2 | 37 | 17097 | 232.38 | 294 | 285 | 72.3 |
| D | 7 | 223 | 12403 | 167.5 | 294 | 285 | 72.3 |
| D | 2 | 232 | 7061 | 93.66 | 294 | 285 | 72.3 |
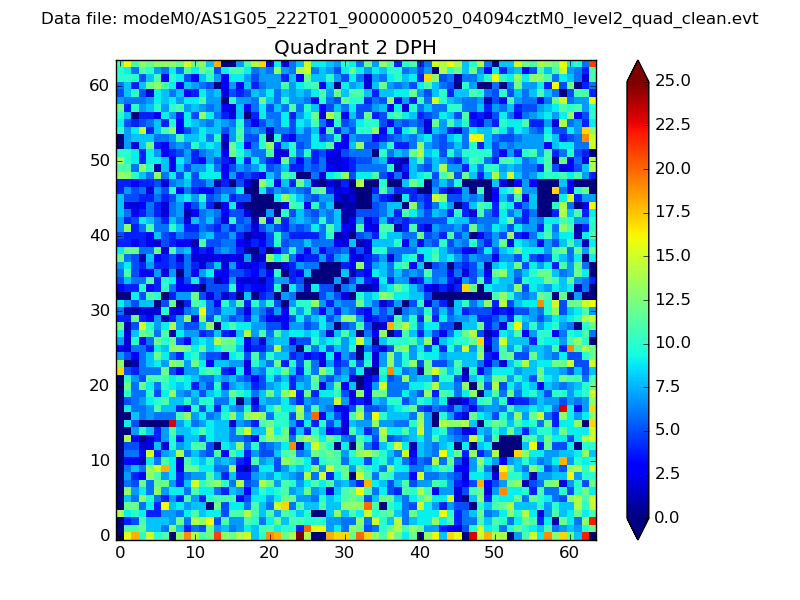
Histogram calculated using DETX and DETY for each event in the final _common_clean file
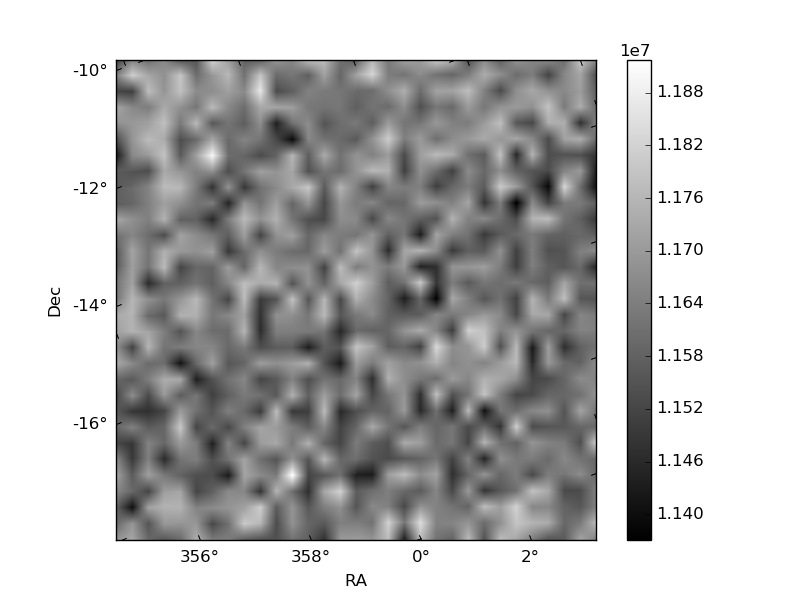
| Quadrant A |  |
 |
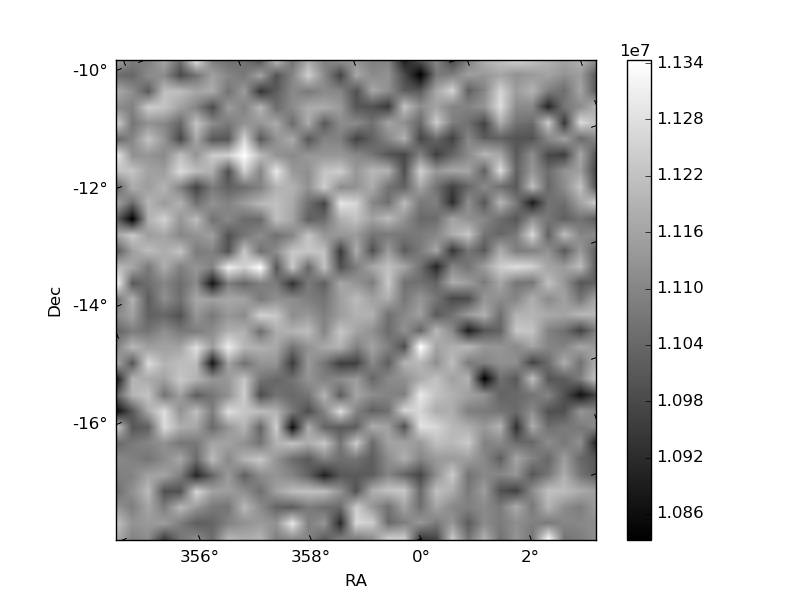
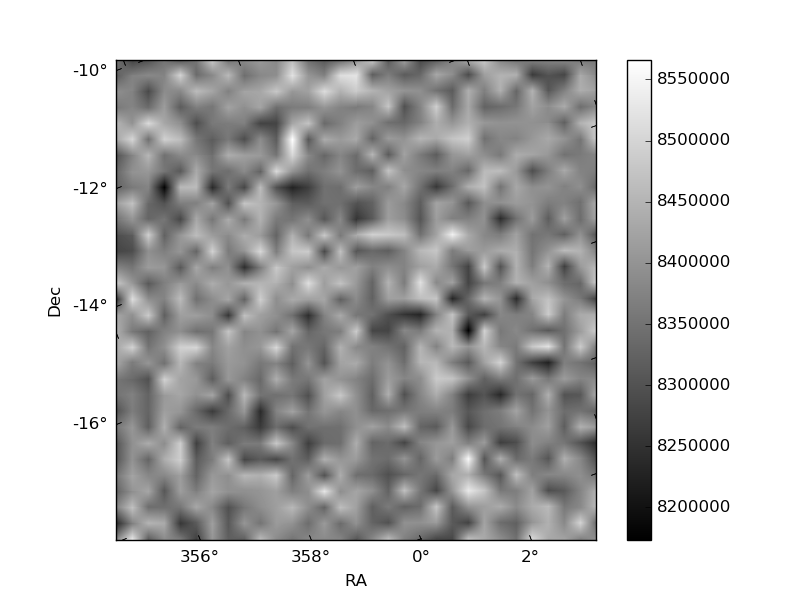
Quadrant B |
|---|---|---|---|
| Quadrant D | 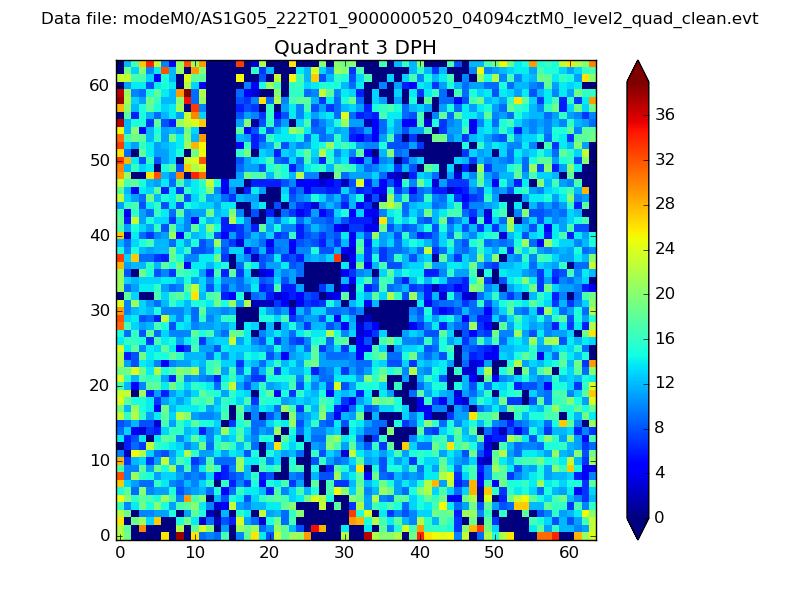 |
 |
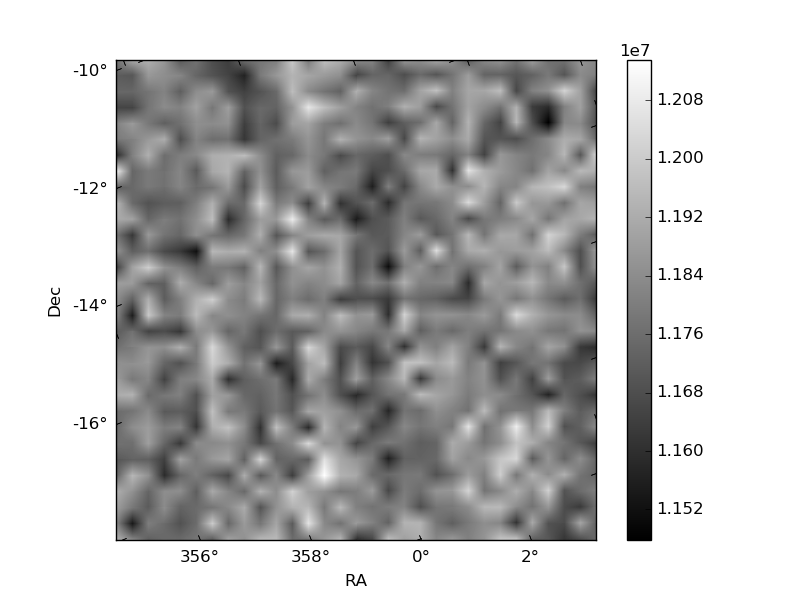
Quadrant C |
| Plot type | Count rate plots | Images |
|---|---|---|
| Comparison with Poisson distribution Blue bars denote a histogram of data divided into 1 sec bins. Red curve is a Poisson curve with rate = median count rate of data. |
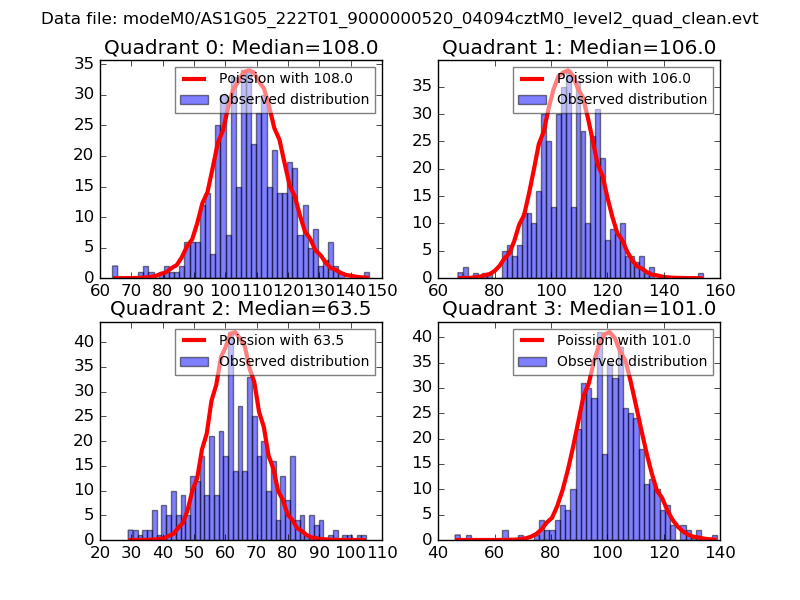 |
 |
| Quadrant-wise count rates Data is divided into 100 sec bins |
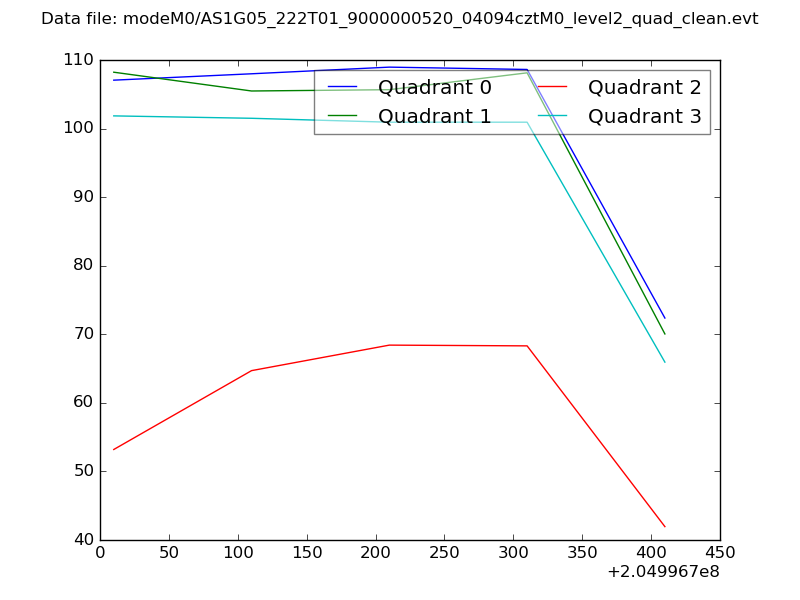 |
|
| Module-wise count rates for Quadrant A Data is divided into 100 sec bins |
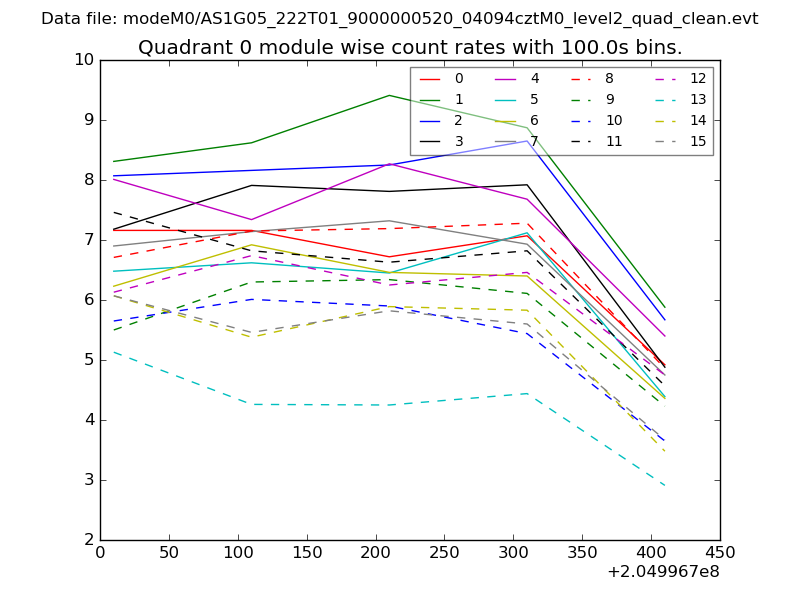 |
 |
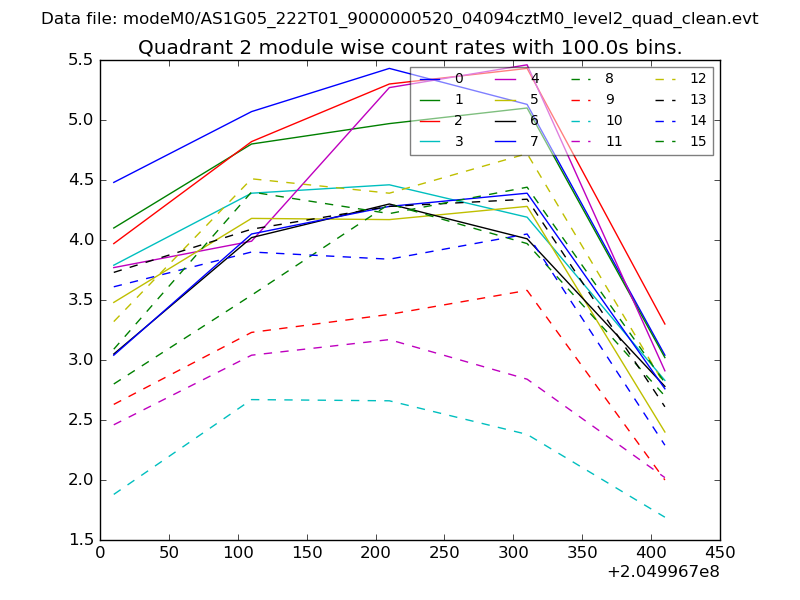
| Module-wise count rates for Quadrant B Data is divided into 100 sec bins |
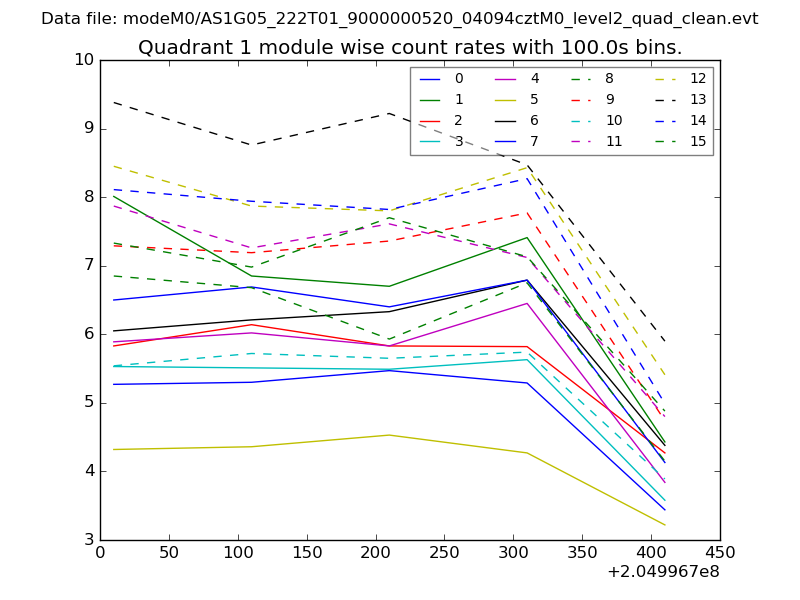 |
 |
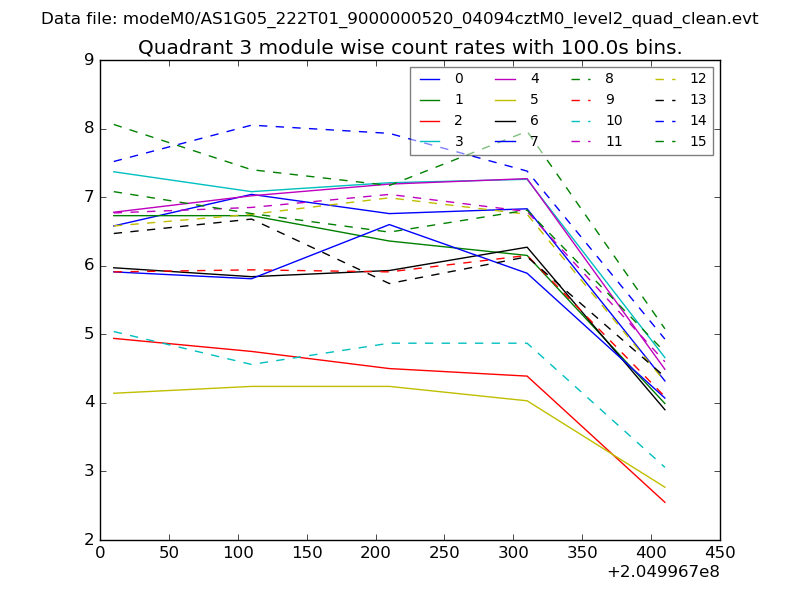
| Module-wise count rates for Quadrant C Data is divided into 100 sec bins |
 |
 |
| Module-wise count rates for Quadrant D Data is divided into 100 sec bins |
 |
 |
| Parameter | Plot |
|---|---|
| CZT HV Monitor | 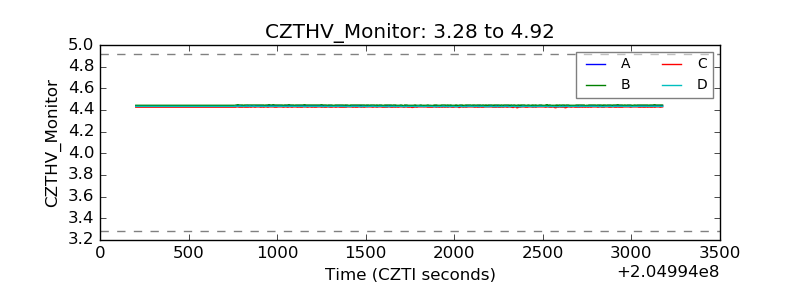 |
| D_VDD | 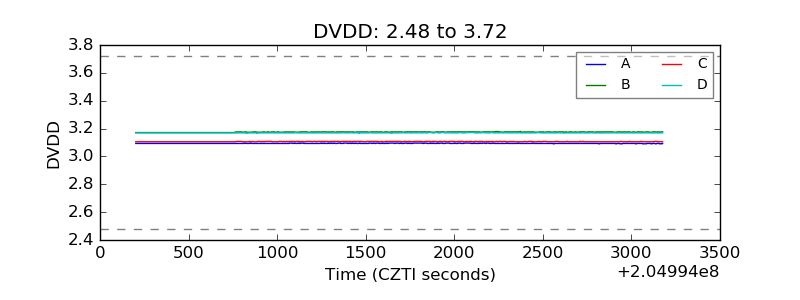 |
| Temperature 1 | 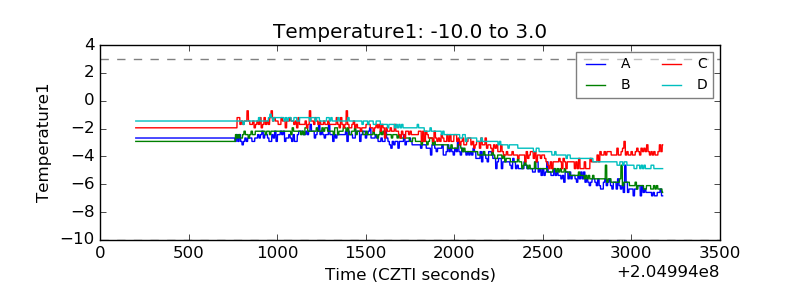 |
| Veto HV Monitor | 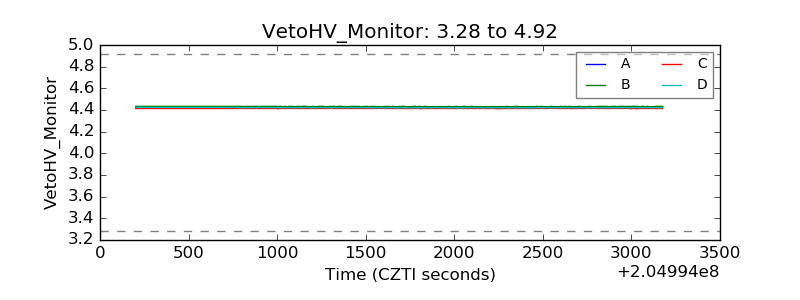 |
| Veto LLD | 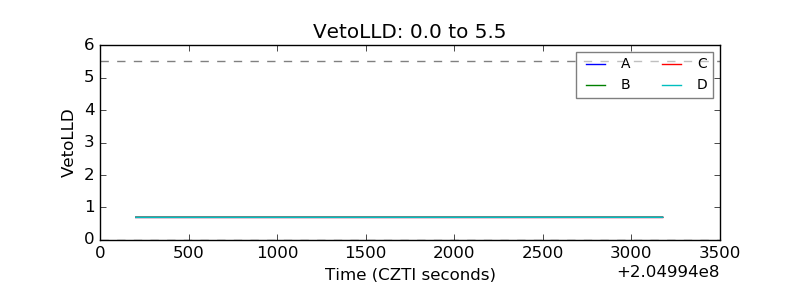 |
| Alpha Counter | 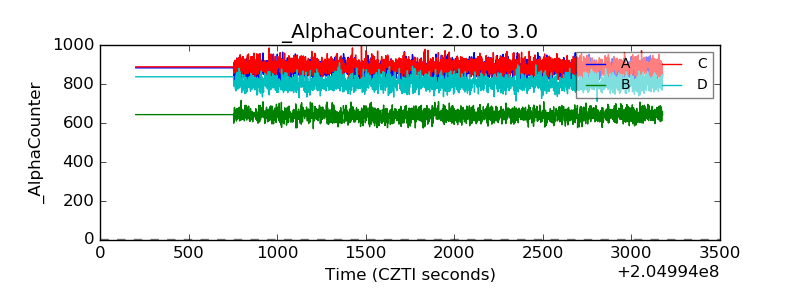 |
| _CPM_Rate | 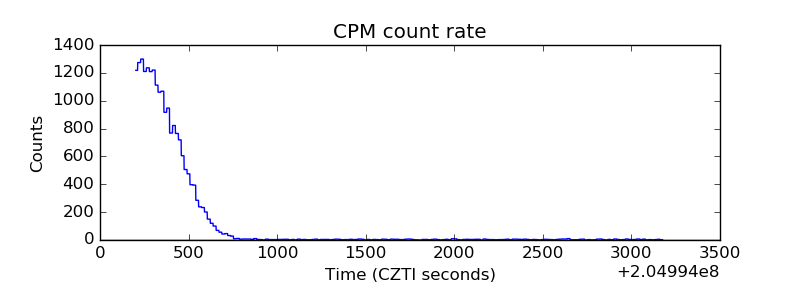 |
| CZT Counter | 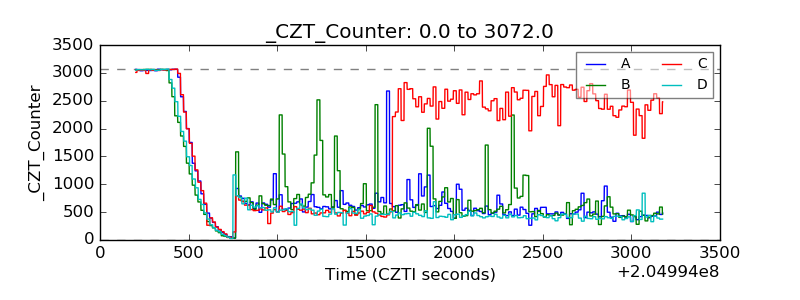 |
| +2.5 Volts monitor |  |
| +5 Volts monitor |  |
| _ROLL_ROT | 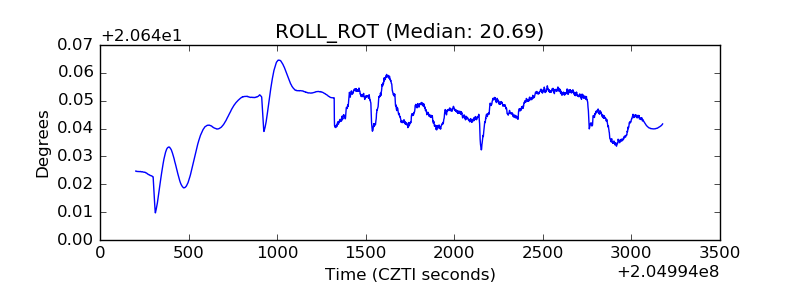 |
| _Roll_DEC | 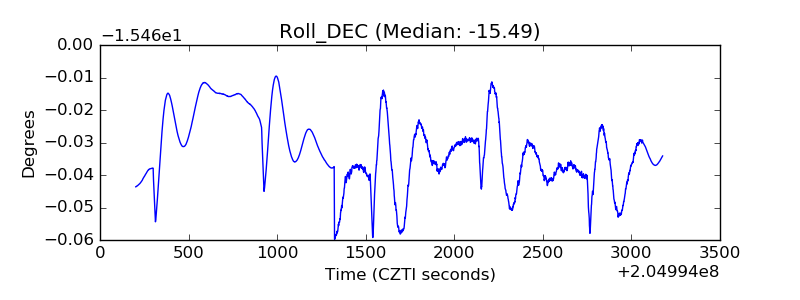 |
| _Roll_RA | 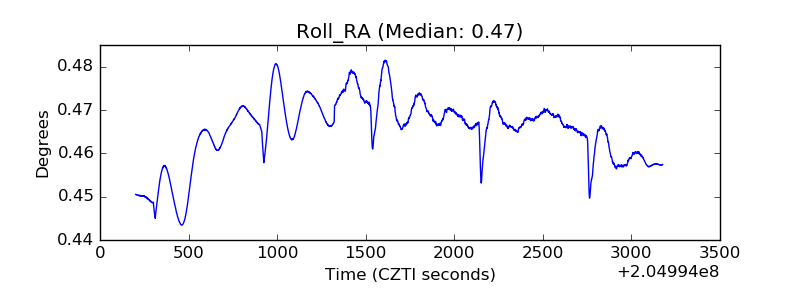 |
| Veto Counter | 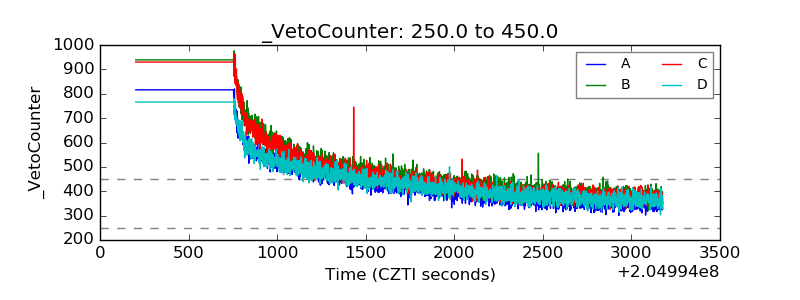 |