| Param | Original file | Final file |
|---|---|---|
| Filename | modeM0/AS1SLEW_01234_9000000519_04068cztM0_level2.evt | modeM0/AS1SLEW_01234_9000000519_04068cztM0_level2_quad_clean.evt |
| Size (bytes) | 39,332,160 | 10,635,840 |
| Size | 37.5 MB | 10.1 MB |
| Events in quadrant A | 267,872 | 68,973 |
| Events in quadrant B | 288,588 | 69,297 |
| Events in quadrant C | 270,932 | 66,431 |
| Events in quadrant D | 316,464 | 64,081 |
| Mode SS | |||
|---|---|---|---|
| Quadrant | BADHDUFLAG | Total packets | Discarded packets |
| A | 0 | 14 | 0 |
| B | 0 | 14 | 0 |
| C | 0 | 14 | 0 |
| D | 0 | 14 | 0 |
| Mode M0 | |||
|---|---|---|---|
| Quadrant | BADHDUFLAG | Total packets | Discarded packets |
| A | 0 | 1284 | 0 |
| B | 0 | 1294 | 0 |
| C | 0 | 1282 | 0 |
| D | 0 | 1420 | 0 |
| Quadrant | Total seconds | Saturated seconds | Saturation percentage |
|---|---|---|---|
| A | 639 | 0 | 0.000000% |
| B | 639 | 0 | 0.000000% |
| C | 639 | 1 | 0.156495% |
| D | 639 | 5 | 0.782473% |
Noise dominated data is calculated using 1-second bins in cleaned event files. If a bin has >2000 counts, and if more than 50% of those come from <1% of pixels, then it is considered to be noise-dominated and hence unusable.
| Quadrant | # 1 sec bins | Bins with >0 counts | Bins with >2000 counts | High rate bins dominated by noise | Noise dominated (total time) | Noise dominated (detector-on time) | Marked lightcurve |
|---|---|---|---|---|---|---|---|
| A | 639 | 639 | 0 | 0 | 0.00% | 0.00% | 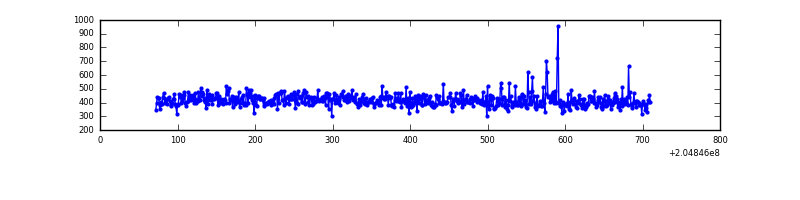 |
| B | 639 | 639 | 0 | 0 | 0.00% | 0.00% | 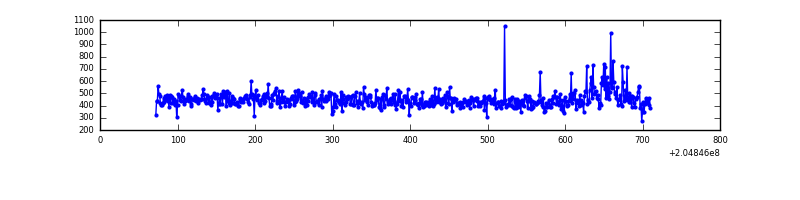 |
| C | 639 | 639 | 0 | 0 | 0.00% | 0.00% |  |
| D | 639 | 639 | 7 | 7 | 1.10% | 1.10% | 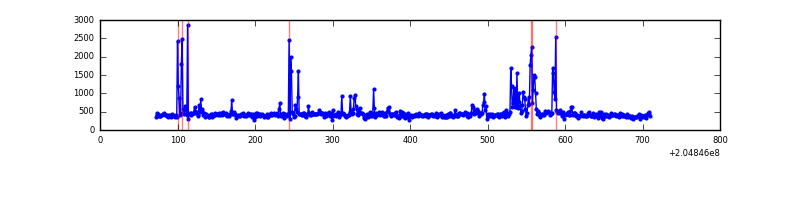 |
Top three noisy pixels from each quadrant. If the there are fewer than three noisy pixels in the level2.evt file, extra rows are filled as -1
| Pixel properties | Quadrant properties | ||||||
|---|---|---|---|---|---|---|---|
| Quadrant | DetID | PixID | Counts | Sigma | Mean | Median | Sigma |
| A | 0 | 50 | 3175 | 189.25 | 68 | 67 | 16.4 |
| A | 0 | 226 | 730 | 40.37 | 68 | 67 | 16.4 |
| A | 12 | 194 | 691 | 38.0 | 68 | 67 | 16.4 |
| B | 4 | 81 | 6565 | 424.01 | 70 | 69 | 15.3 |
| B | 15 | 204 | 4821 | 310.18 | 70 | 69 | 15.3 |
| B | 14 | 167 | 1855 | 116.58 | 70 | 69 | 15.3 |
| C | 12 | 4 | 1210 | 62.45 | 68 | 68 | 18.3 |
| C | 9 | 144 | 726 | 35.98 | 68 | 68 | 18.3 |
| C | 13 | 61 | 608 | 29.53 | 68 | 68 | 18.3 |
| D | 10 | 172 | 46992 | 2664.26 | 67 | 65 | 17.6 |
| D | 2 | 14 | 6238 | 350.47 | 67 | 65 | 17.6 |
| D | 2 | 232 | 4329 | 242.09 | 67 | 65 | 17.6 |
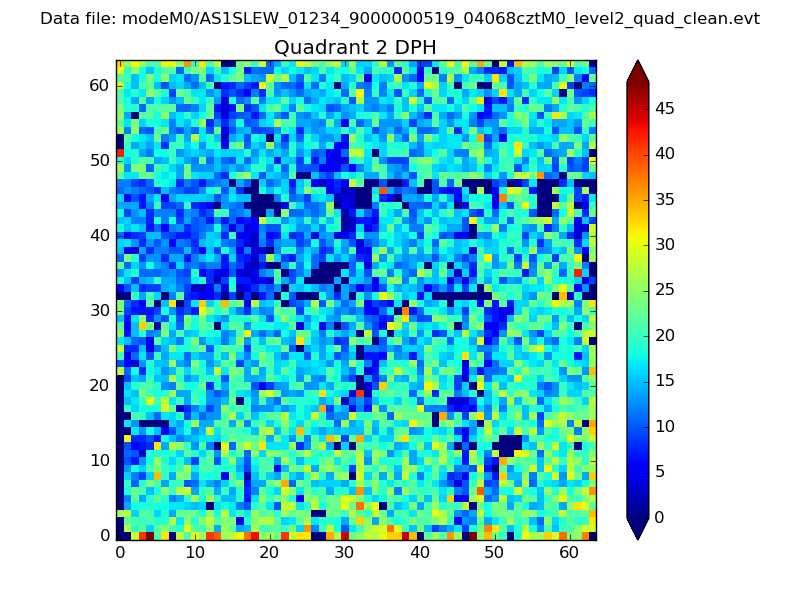
Histogram calculated using DETX and DETY for each event in the final _common_clean file
| Quadrant A | 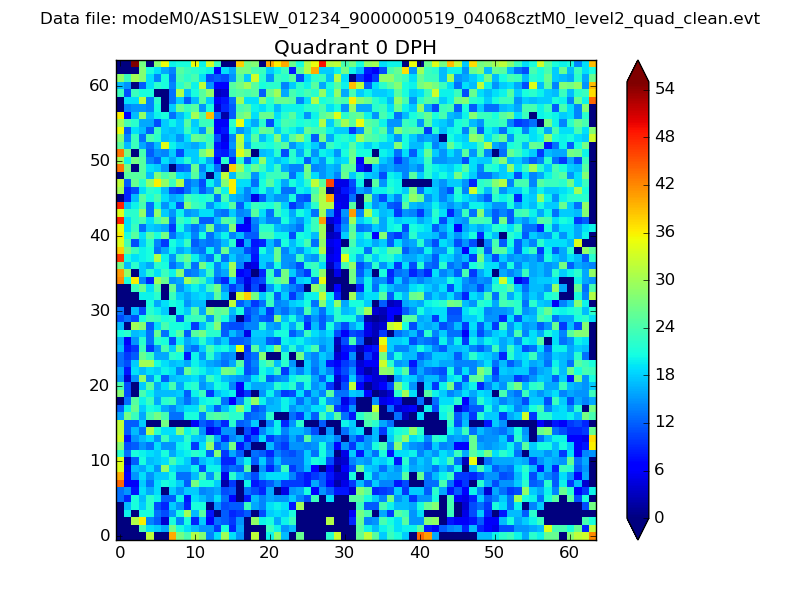 |
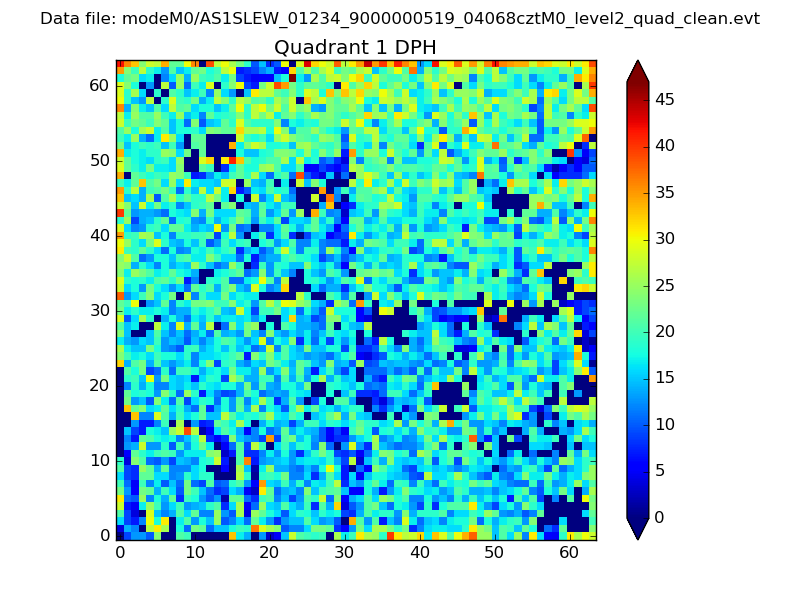 |
Quadrant B |
|---|---|---|---|
| Quadrant D | 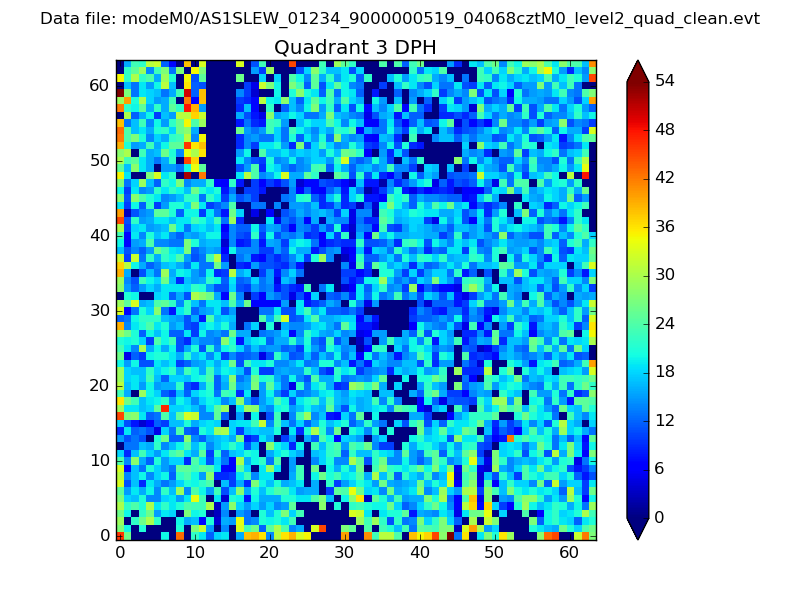 |
 |
Quadrant C |
| Plot type | Count rate plots | Images |
|---|---|---|
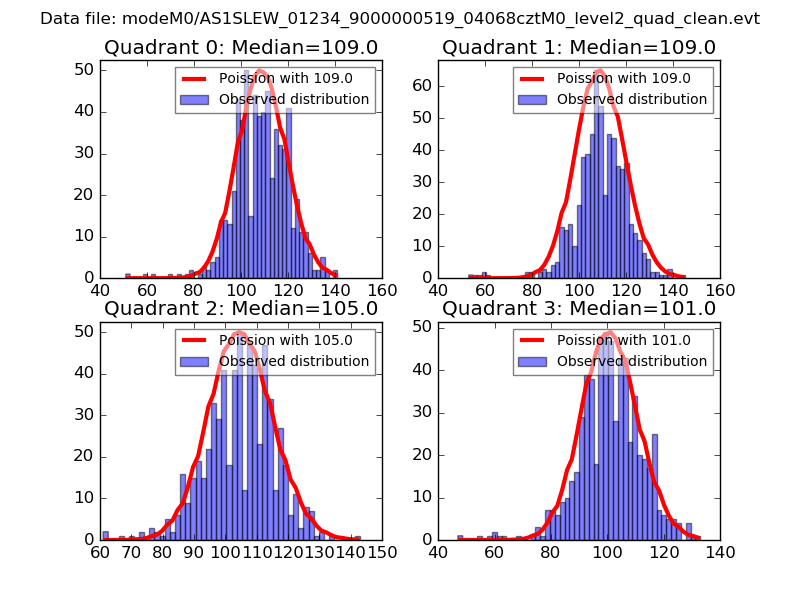
| Comparison with Poisson distribution Blue bars denote a histogram of data divided into 1 sec bins. Red curve is a Poisson curve with rate = median count rate of data. |
 |
 |
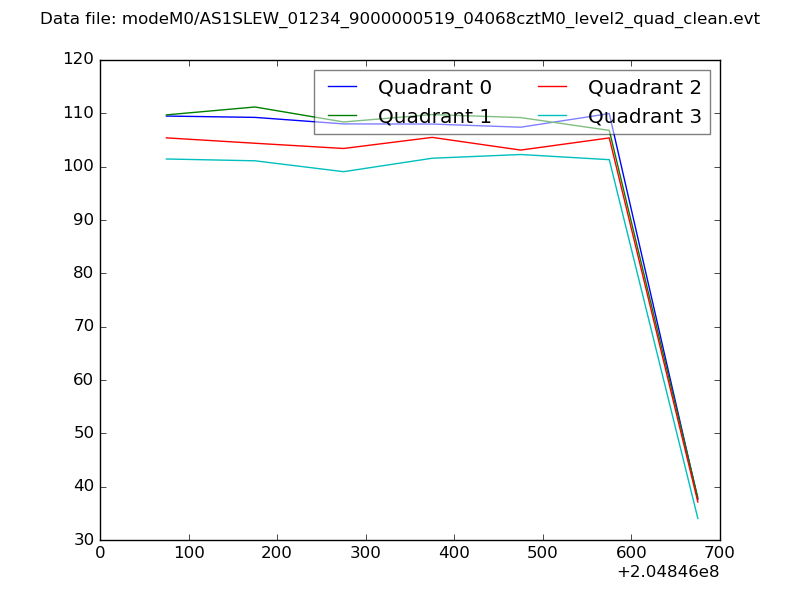
| Quadrant-wise count rates Data is divided into 100 sec bins |
 |
|
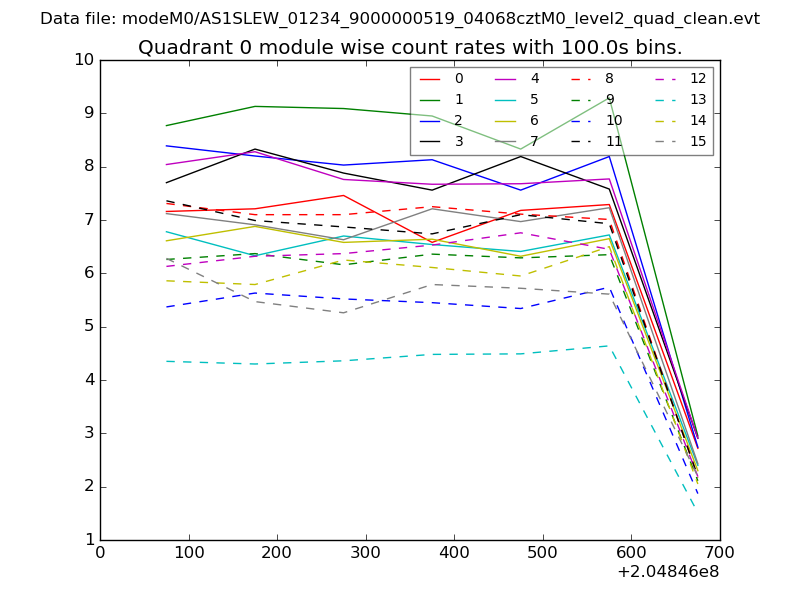
| Module-wise count rates for Quadrant A Data is divided into 100 sec bins |
 |
 |
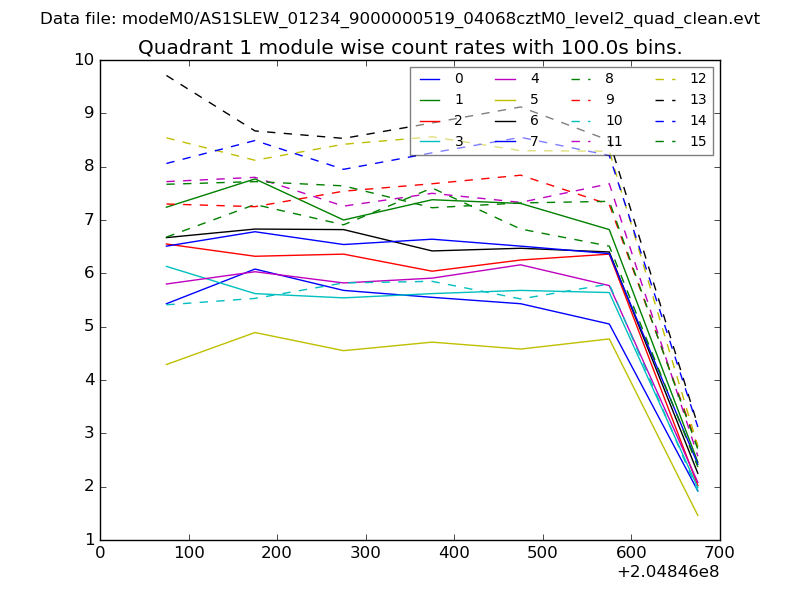
| Module-wise count rates for Quadrant B Data is divided into 100 sec bins |
 |
 |
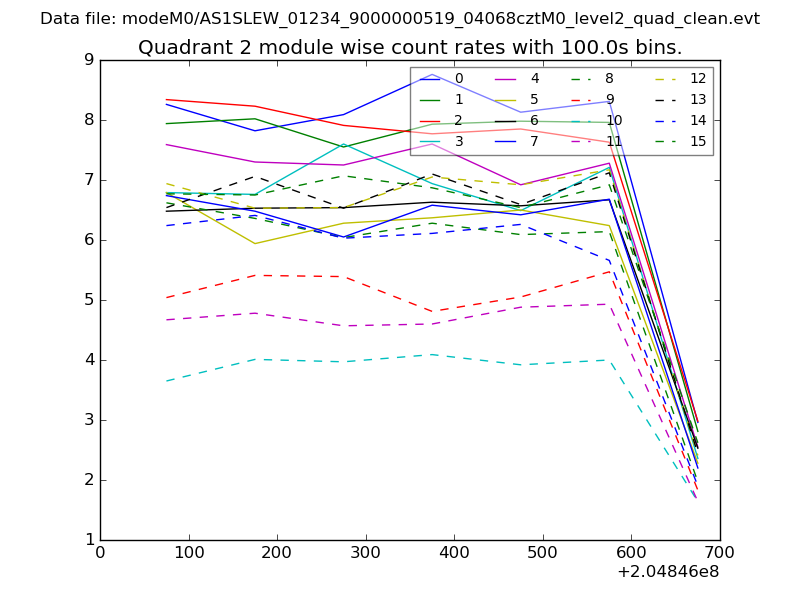
| Module-wise count rates for Quadrant C Data is divided into 100 sec bins |
 |
 |
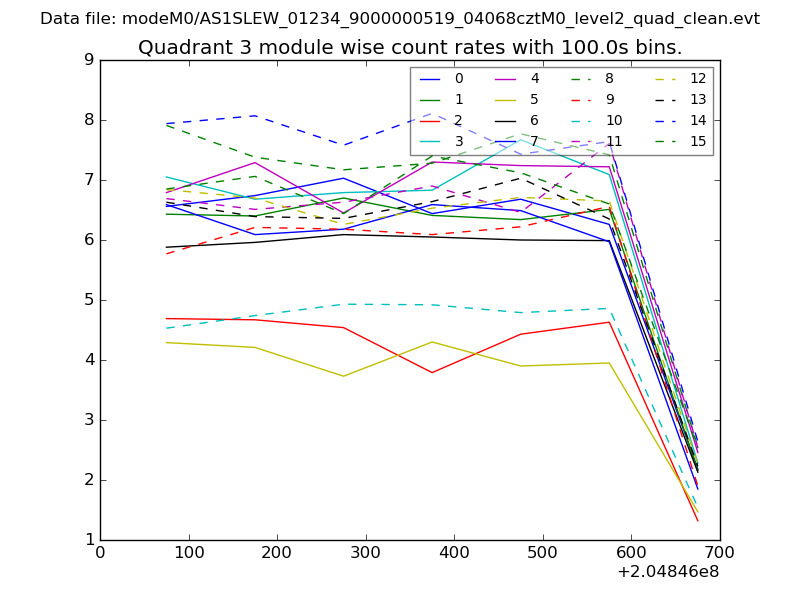
| Module-wise count rates for Quadrant D Data is divided into 100 sec bins |
 |
 |
| Parameter | Plot |
|---|---|
| CZT HV Monitor | 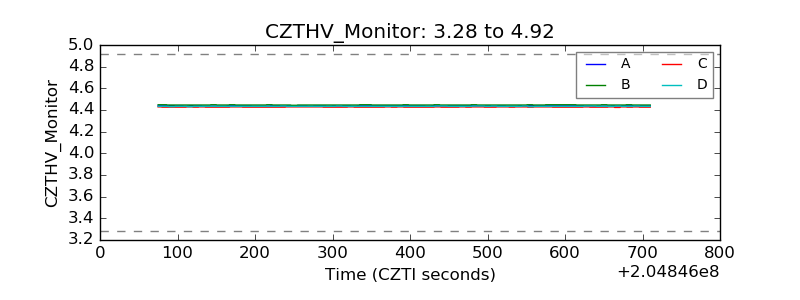 |
| D_VDD | 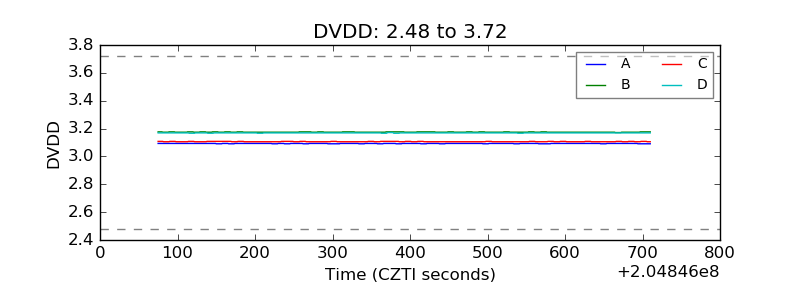 |
| Temperature 1 | 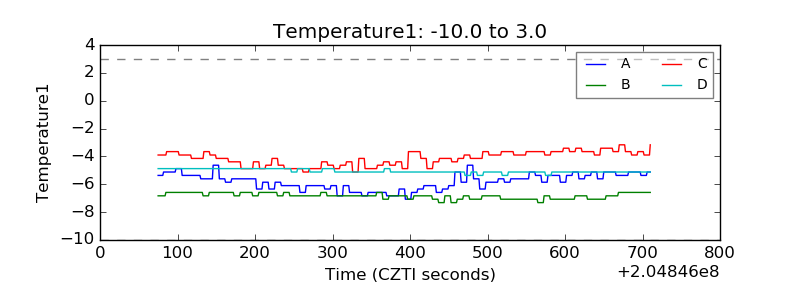 |
| Veto HV Monitor | 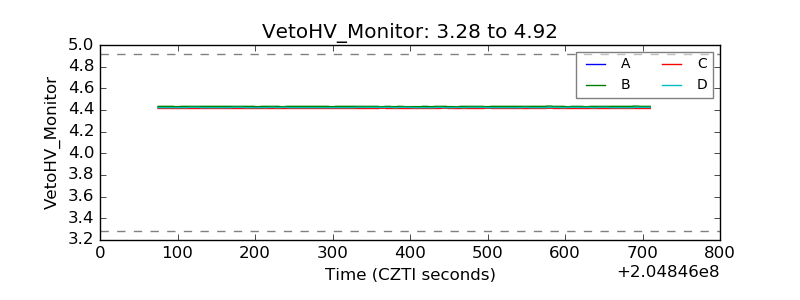 |
| Veto LLD | 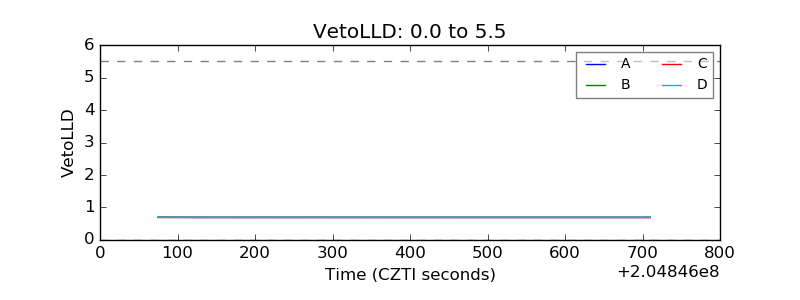 |
| Alpha Counter | 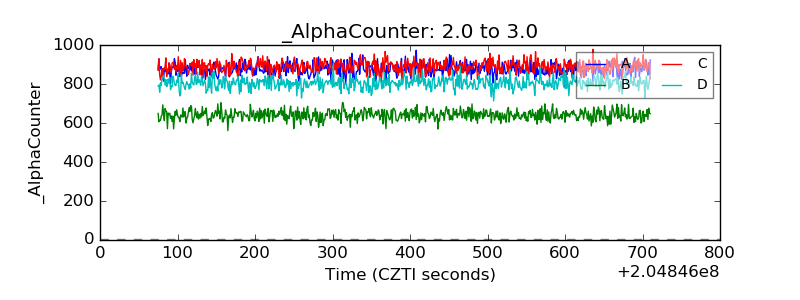 |
| _CPM_Rate | 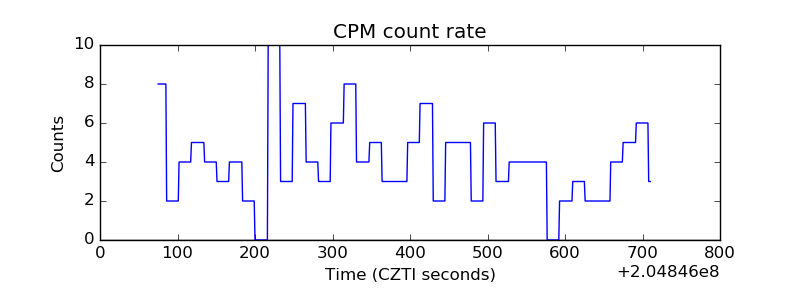 |
| CZT Counter | 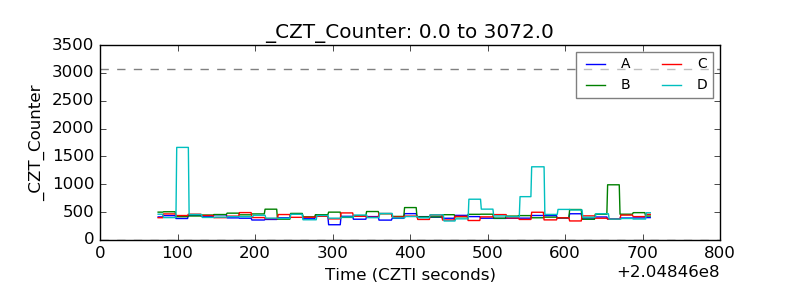 |
| +2.5 Volts monitor |  |
| +5 Volts monitor |  |
| _ROLL_ROT | 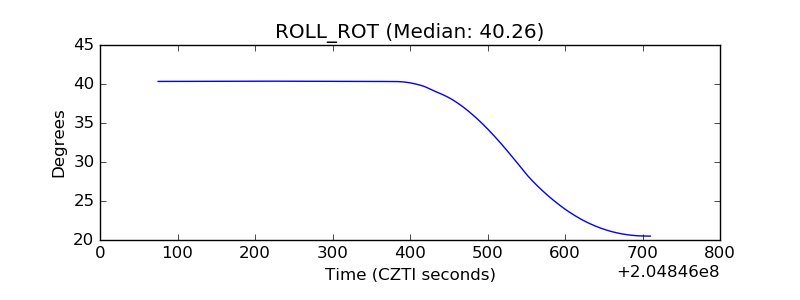 |
| _Roll_DEC | 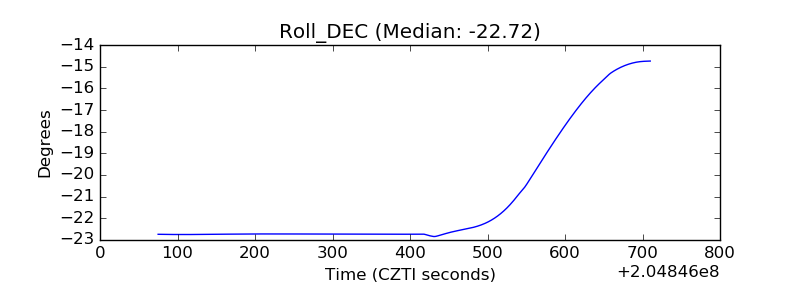 |
| _Roll_RA |  |
| Veto Counter | 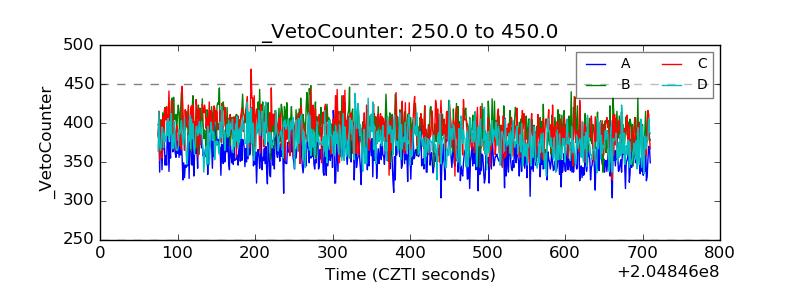 |