| Param | Original file | Final file |
|---|---|---|
| Filename | modeM0/AS1G05_192T01_9000000522cztM0_level2.fits | modeM0/AS1G05_192T01_9000000522cztM0_level2_quad_clean.evt |
| Size (bytes) | 208,552,320 | 191,099,520 |
| Size | 198.9 MB | 182.2 MB |
| Events in quadrant A | 1,302,558 | 1,199,143 |
| Events in quadrant B | 1,246,256 | 1,170,113 |
| Events in quadrant C | 1,066,836 | 774,319 |
| Events in quadrant D | 1,129,100 | 1,075,930 |
| Mode SS | |||
|---|---|---|---|
| Quadrant | BADHDUFLAG | Total packets | Discarded packets |
| A | 0 | 464 | 0 |
| B | 0 | 464 | 0 |
| C | 0 | 464 | 0 |
| D | 0 | 464 | 0 |
| Mode M0 | |||
|---|---|---|---|
| Quadrant | BADHDUFLAG | Total packets | Discarded packets |
| A | 0 | 49569 | 0 |
| B | 0 | 65546 | 0 |
| C | 0 | 97922 | 0 |
| D | 0 | 49512 | 0 |
| Mode M9 | |||
|---|---|---|---|
| Quadrant | BADHDUFLAG | Total packets | Discarded packets |
| A | 0 | 61 | 0 |
| B | 0 | 61 | 0 |
| C | 0 | 61 | 0 |
| D | 0 | 61 | 0 |
| Quadrant | Total seconds | Saturated seconds | Saturation percentage |
|---|---|---|---|
| A | 22773 | 271 | 1.190006% |
| B | 22773 | 1163 | 5.106925% |
| C | 22773 | 8377 | 36.784789% |
| D | 22773 | 270 | 1.185615% |
Noise dominated data is calculated using 1-second bins in cleaned event files. If a bin has >2000 counts, and if more than 50% of those come from <1% of pixels, then it is considered to be noise-dominated and hence unusable.
| Quadrant | # 1 sec bins | Bins with >0 counts | Bins with >2000 counts | High rate bins dominated by noise | Noise dominated (total time) | Noise dominated (detector-on time) | Marked lightcurve |
|---|---|---|---|---|---|---|---|
| A | 28847 | 22770 | 0 | 0 | 0.00% | 0.00% |  |
| B | 28848 | 22769 | 0 | 0 | 0.00% | 0.00% | 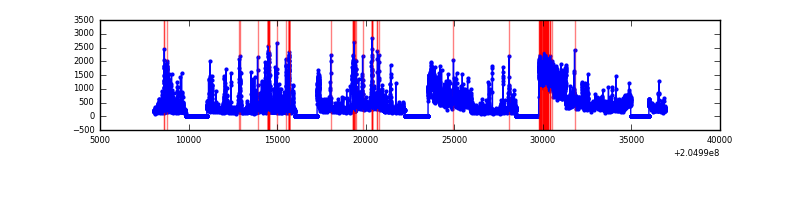 |
| C | 28848 | 22769 | 0 | 0 | 0.00% | 0.00% | 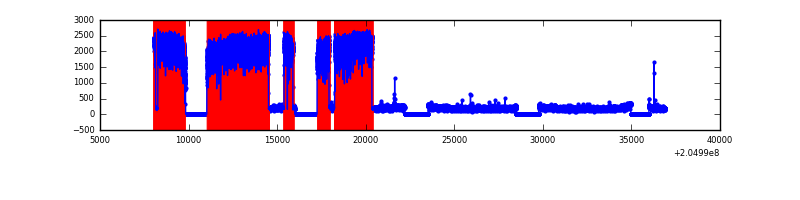 |
| D | 28848 | 22768 | 0 | 0 | 0.00% | 0.00% | 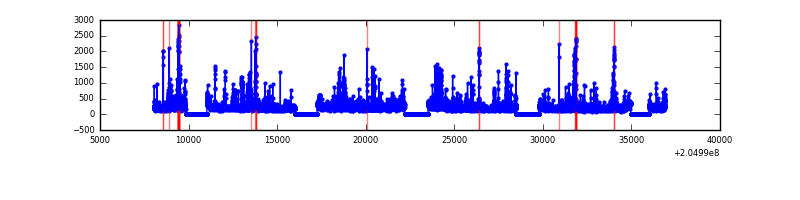 |
Top three noisy pixels from each quadrant. If the there are fewer than three noisy pixels in the level2.evt file, extra rows are filled as -1
| Pixel properties | Quadrant properties | ||||||
|---|---|---|---|---|---|---|---|
| Quadrant | DetID | PixID | Counts | Sigma | Mean | Median | Sigma |
| A | 0 | 29 | 1301 | 11.06 | 339 | 317 | 89.0 |
| A | 7 | 110 | 1080 | 8.58 | 339 | 317 | 89.0 |
| A | 0 | 30 | 1063 | 8.39 | 339 | 317 | 89.0 |
| B | 2 | 9 | 1040 | 10.83 | 329 | 314 | 67.0 |
| B | 12 | 226 | 928 | 9.16 | 329 | 314 | 67.0 |
| B | 5 | 128 | 905 | 8.82 | 329 | 314 | 67.0 |
| C | 7 | 111 | 765 | 6.66 | 281 | 262 | 75.5 |
| C | 1 | 80 | 756 | 6.54 | 281 | 262 | 75.5 |
| C | 12 | 241 | 741 | 6.35 | 281 | 262 | 75.5 |
| D | 11 | 82 | 907 | 7.04 | 321 | 293 | 87.2 |
| D | 3 | 14 | 883 | 6.77 | 321 | 293 | 87.2 |
| D | 7 | 3 | 840 | 6.28 | 321 | 293 | 87.2 |
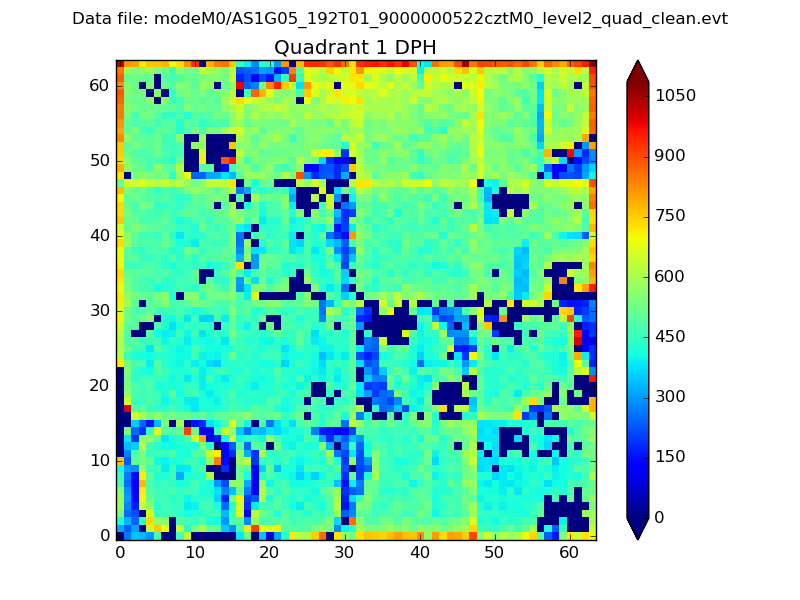
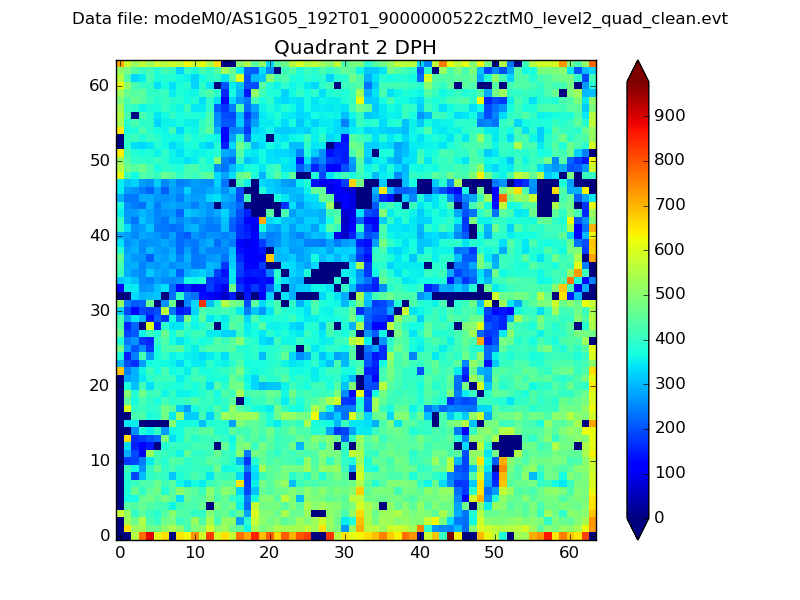
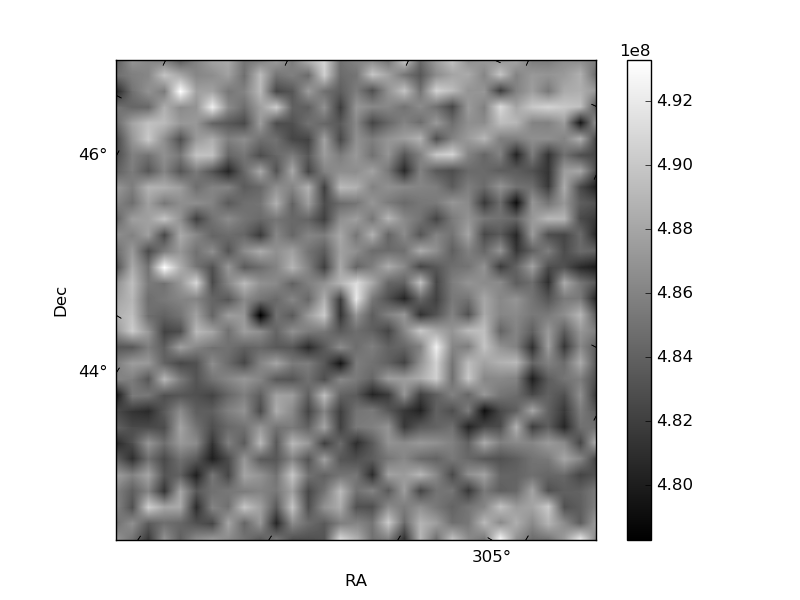
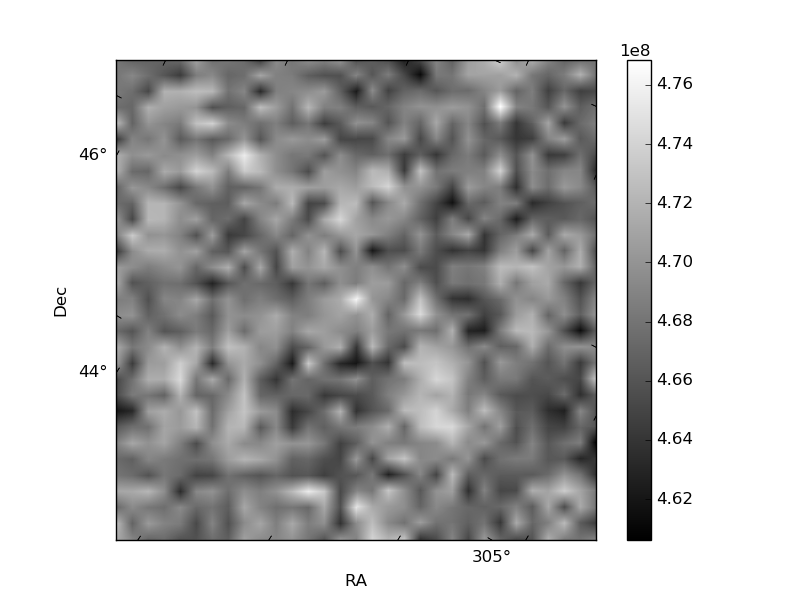
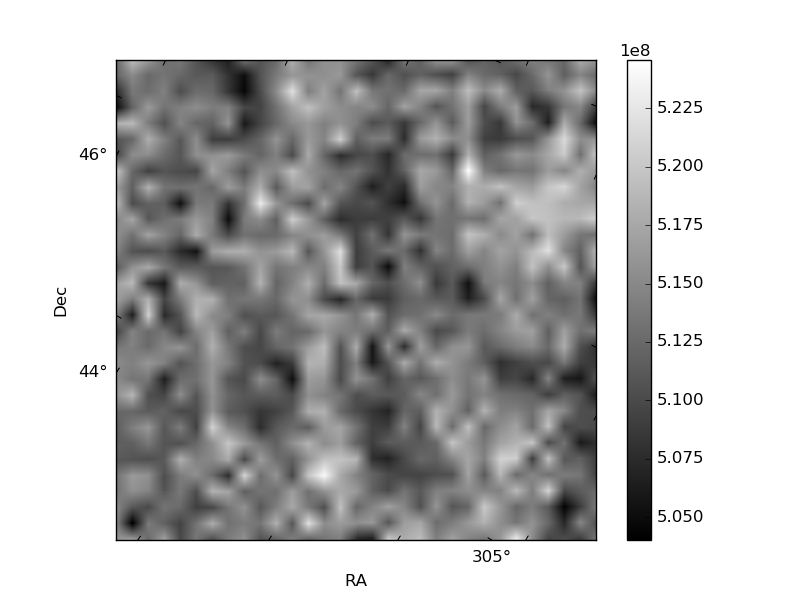
Histogram calculated using DETX and DETY for each event in the final _common_clean file
| Quadrant A | 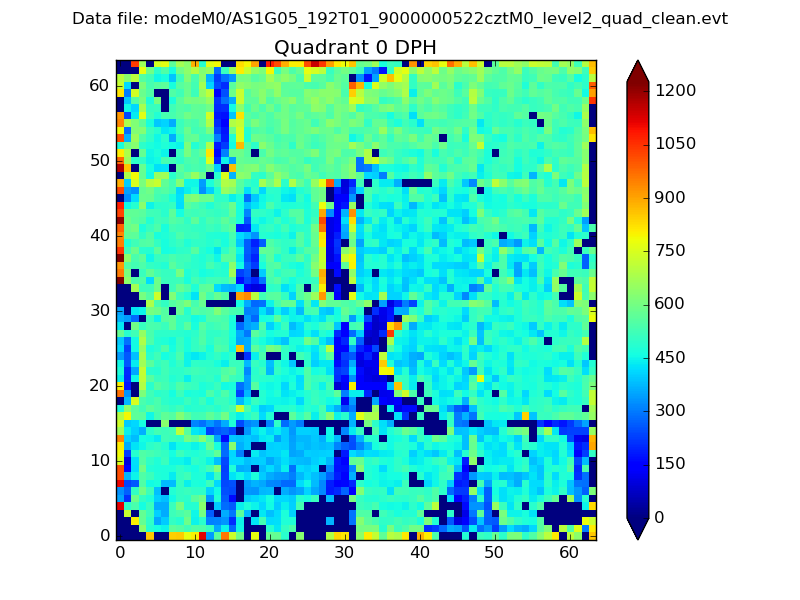 |
 |
Quadrant B |
|---|---|---|---|
| Quadrant D | 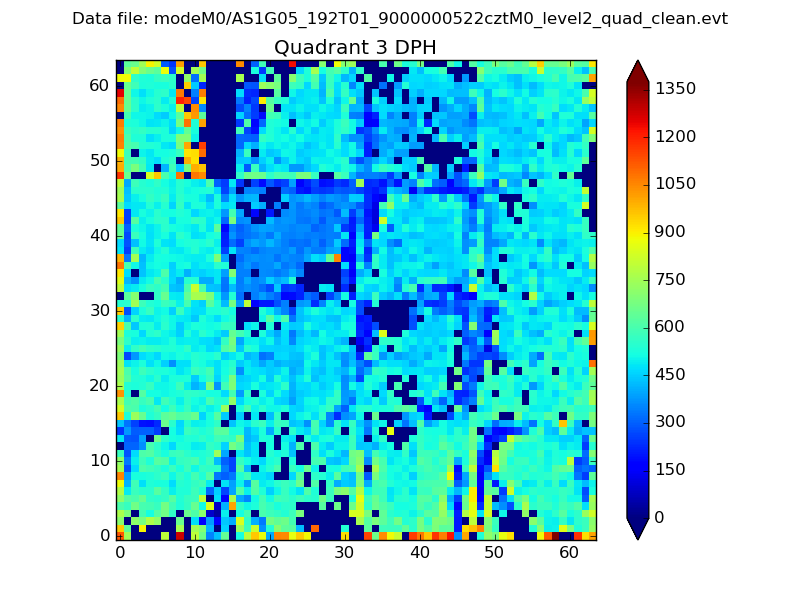 |
 |
Quadrant C |
| Plot type | Count rate plots | Images |
|---|---|---|
| Comparison with Poisson distribution Blue bars denote a histogram of data divided into 1 sec bins. Red curve is a Poisson curve with rate = median count rate of data. |
 |
 |
| Quadrant-wise count rates Data is divided into 100 sec bins |
 |
|
| Module-wise count rates for Quadrant A Data is divided into 100 sec bins |
 |
 |
| Module-wise count rates for Quadrant B Data is divided into 100 sec bins |
 |
 |
| Module-wise count rates for Quadrant C Data is divided into 100 sec bins |
 |
 |
| Module-wise count rates for Quadrant D Data is divided into 100 sec bins |
 |
 |
| Parameter | Plot |
|---|---|
| CZT HV Monitor |  |
| D_VDD | 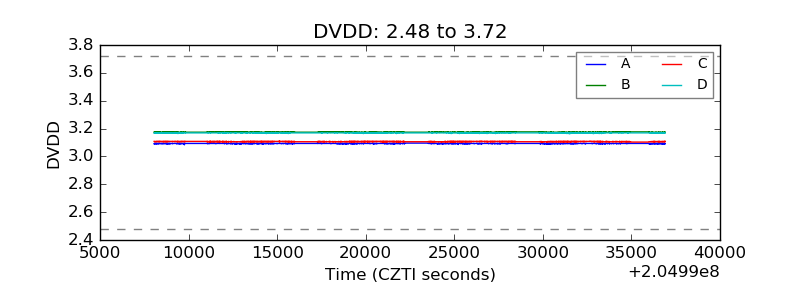 |
| Temperature 1 |  |
| Veto HV Monitor |  |
| Veto LLD | 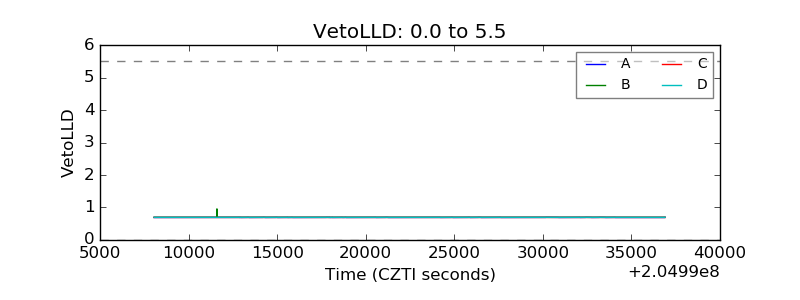 |
| Alpha Counter |  |
| _CPM_Rate | 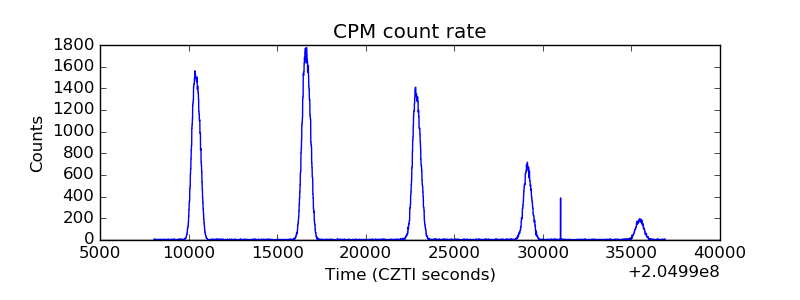 |
| CZT Counter | 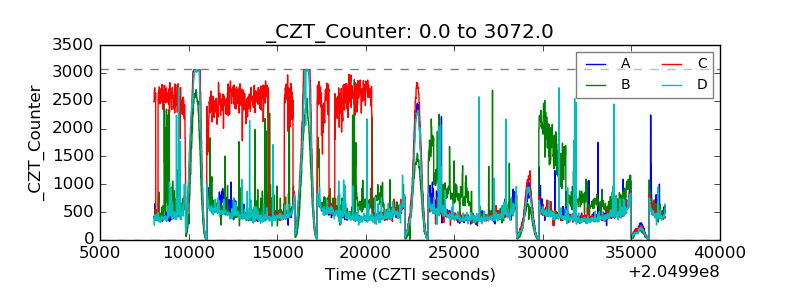 |
| +2.5 Volts monitor | 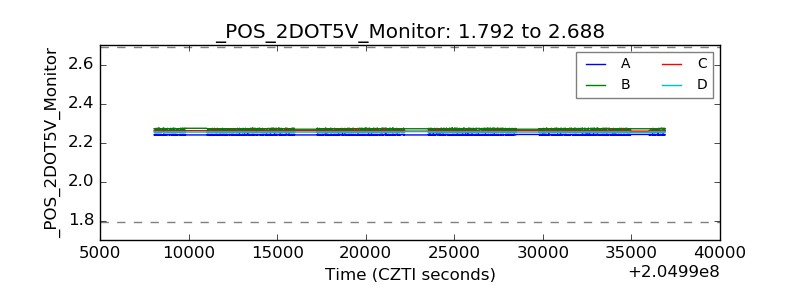 |
| +5 Volts monitor |  |
| _ROLL_ROT |  |
| _Roll_DEC |  |
| _Roll_RA | 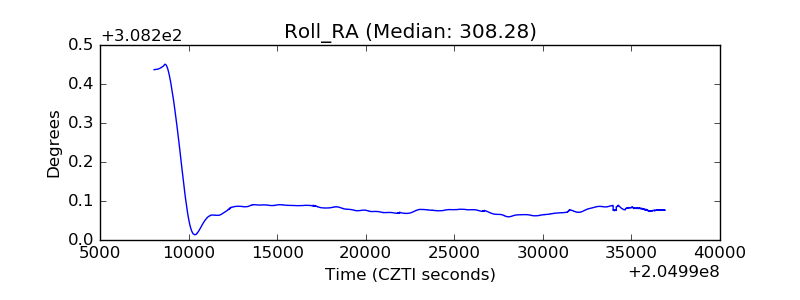 |
| Veto Counter | 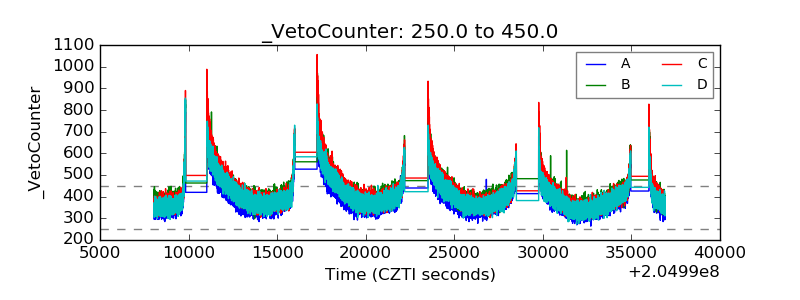 |