| Param | Original file | Final file |
|---|---|---|
| Filename | modeM0/AS1G05_192T01_9000000522_04094cztM0_level2.evt | modeM0/AS1G05_192T01_9000000522_04094cztM0_level2_quad_clean.evt |
| Size (bytes) | 410,722,560 | 34,110,720 |
| Size | 391.7 MB | 32.5 MB |
| Events in quadrant A | 1,614,450 | 231,912 |
| Events in quadrant B | 1,929,317 | 231,026 |
| Events in quadrant C | 7,086,168 | 131,319 |
| Events in quadrant D | 1,603,161 | 222,597 |
| Mode SS | |||
|---|---|---|---|
| Quadrant | BADHDUFLAG | Total packets | Discarded packets |
| A | 0 | 62 | 0 |
| B | 0 | 62 | 0 |
| C | 0 | 62 | 0 |
| D | 0 | 62 | 0 |
| Mode M0 | |||
|---|---|---|---|
| Quadrant | BADHDUFLAG | Total packets | Discarded packets |
| A | 0 | 6935 | 2 |
| B | 0 | 7681 | 1 |
| C | 0 | 23073 | 1 |
| D | 0 | 6800 | 1 |
| Mode M9 | |||
|---|---|---|---|
| Quadrant | BADHDUFLAG | Total packets | Discarded packets |
| A | 0 | 12 | 0 |
| B | 0 | 12 | 0 |
| C | 0 | 12 | 0 |
| D | 0 | 12 | 0 |
| Quadrant | Total seconds | Saturated seconds | Saturation percentage |
|---|---|---|---|
| A | 3013 | 70 | 2.323266% |
| B | 3013 | 137 | 4.546963% |
| C | 3013 | 2834 | 94.059077% |
| D | 3013 | 87 | 2.887488% |
Noise dominated data is calculated using 1-second bins in cleaned event files. If a bin has >2000 counts, and if more than 50% of those come from <1% of pixels, then it is considered to be noise-dominated and hence unusable.
| Quadrant | # 1 sec bins | Bins with >0 counts | Bins with >2000 counts | High rate bins dominated by noise | Noise dominated (total time) | Noise dominated (detector-on time) | Marked lightcurve |
|---|---|---|---|---|---|---|---|
| A | 4213 | 3013 | 1 | 1 | 0.02% | 0.03% | 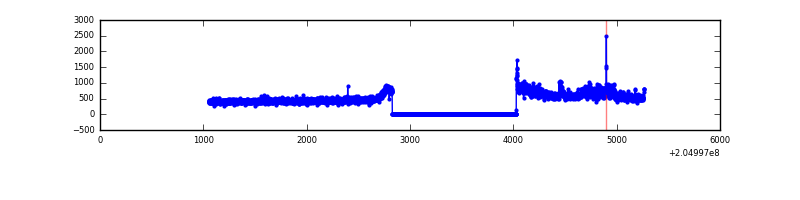 |
| B | 4213 | 3013 | 58 | 58 | 1.38% | 1.92% | 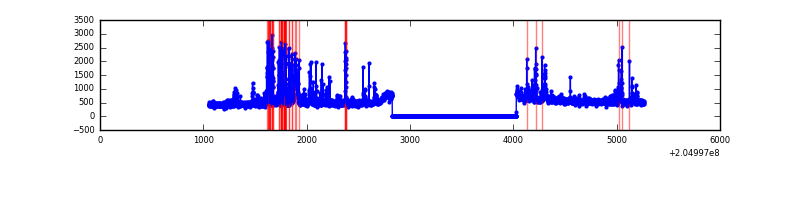 |
| C | 4212 | 3012 | 2702 | 2702 | 64.15% | 89.71% | 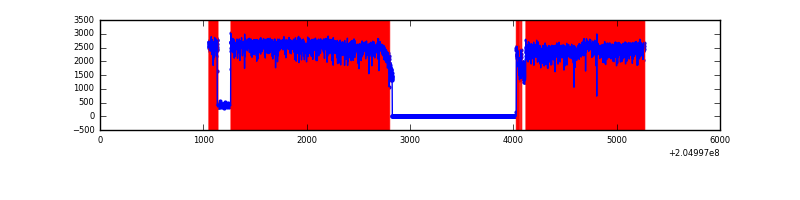 |
| D | 4213 | 3013 | 25 | 25 | 0.59% | 0.83% | 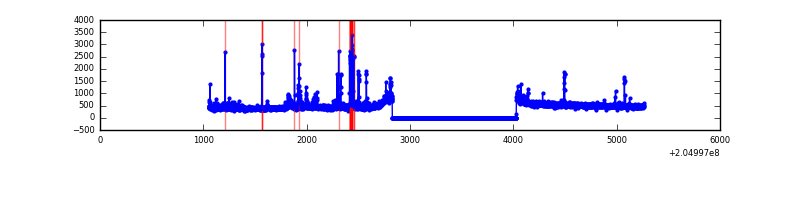 |
Top three noisy pixels from each quadrant. If the there are fewer than three noisy pixels in the level2.evt file, extra rows are filled as -1
| Pixel properties | Quadrant properties | ||||||
|---|---|---|---|---|---|---|---|
| Quadrant | DetID | PixID | Counts | Sigma | Mean | Median | Sigma |
| A | 0 | 199 | 117231 | 1461.88 | 383 | 374 | 79.9 |
| A | 0 | 226 | 14941 | 182.23 | 383 | 374 | 79.9 |
| A | 0 | 50 | 5488 | 63.98 | 383 | 374 | 79.9 |
| B | 10 | 16 | 318732 | 4243.92 | 384 | 376 | 75.0 |
| B | 14 | 167 | 85077 | 1129.12 | 384 | 376 | 75.0 |
| B | 15 | 204 | 15369 | 199.86 | 384 | 376 | 75.0 |
| C | 12 | 204 | 6135133 | 108441.25 | 242 | 242 | 56.6 |
| C | 12 | 4 | 2231 | 35.16 | 242 | 242 | 56.6 |
| C | 13 | 61 | 1955 | 30.28 | 242 | 242 | 56.6 |
| D | 10 | 172 | 97595 | 1081.89 | 369 | 358 | 89.9 |
| D | 2 | 206 | 68352 | 756.52 | 369 | 358 | 89.9 |
| D | 2 | 37 | 16857 | 183.57 | 369 | 358 | 89.9 |
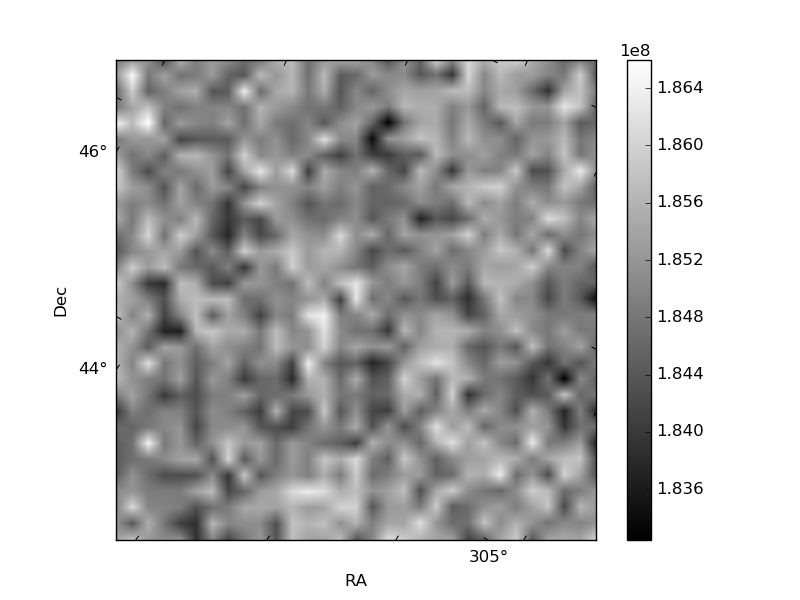
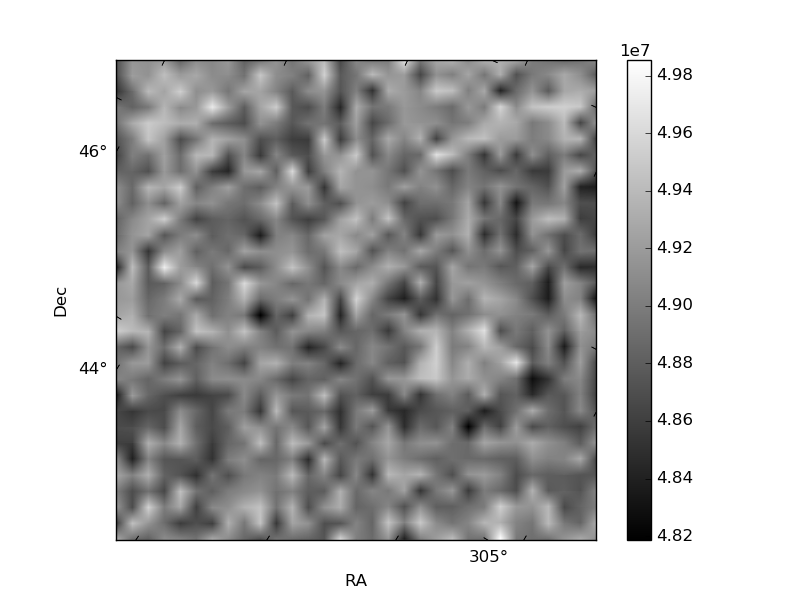
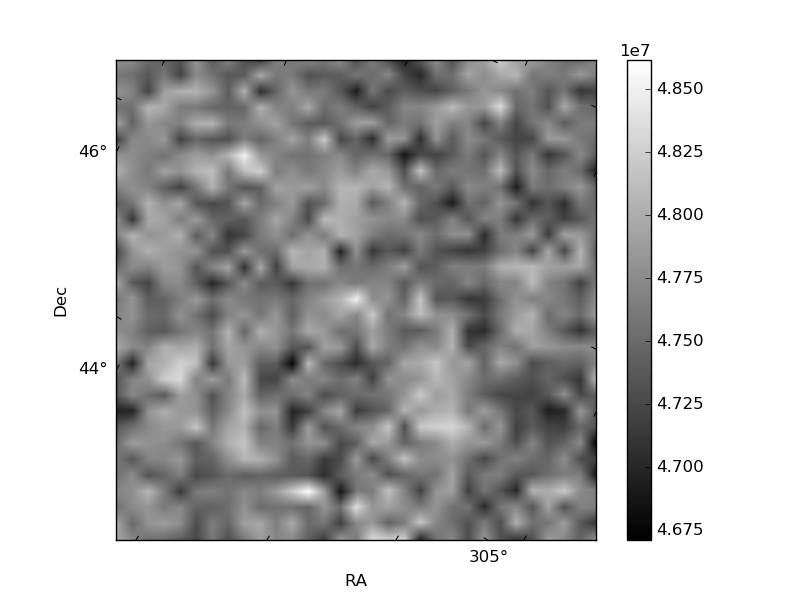
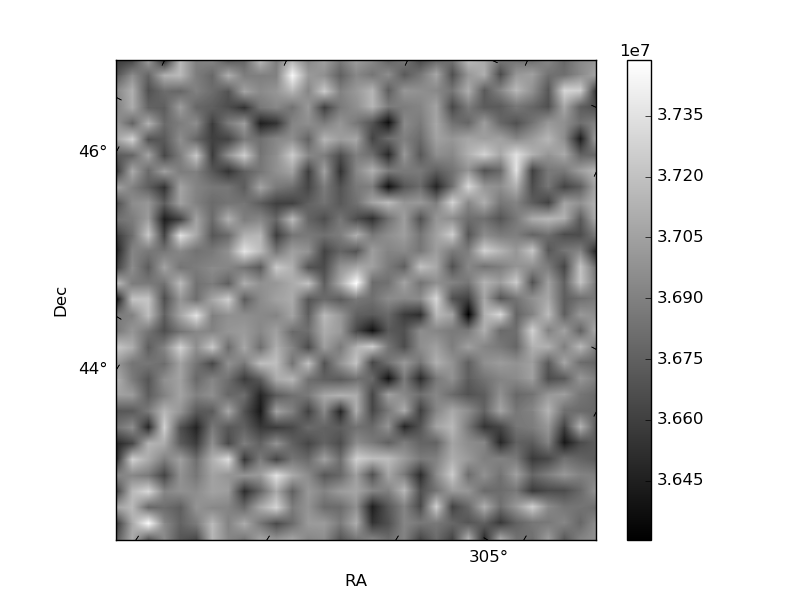
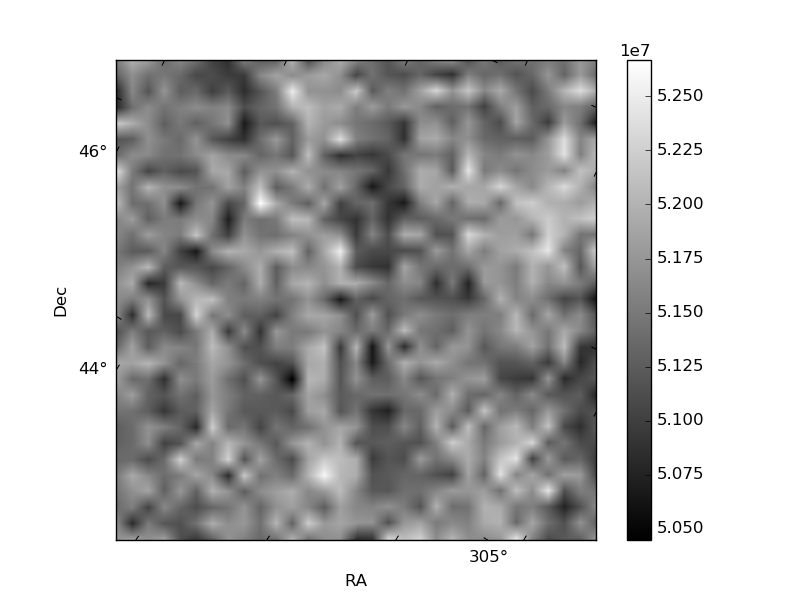
Histogram calculated using DETX and DETY for each event in the final _common_clean file
| Quadrant A | 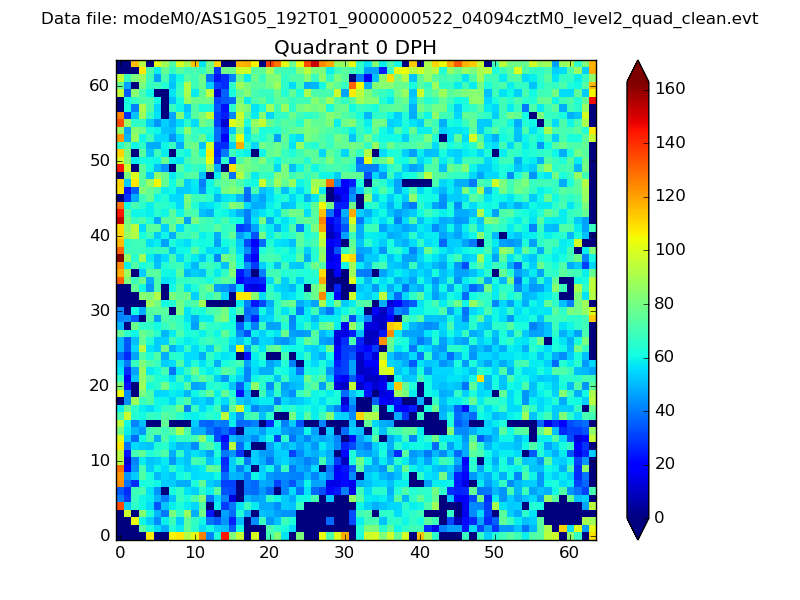 |
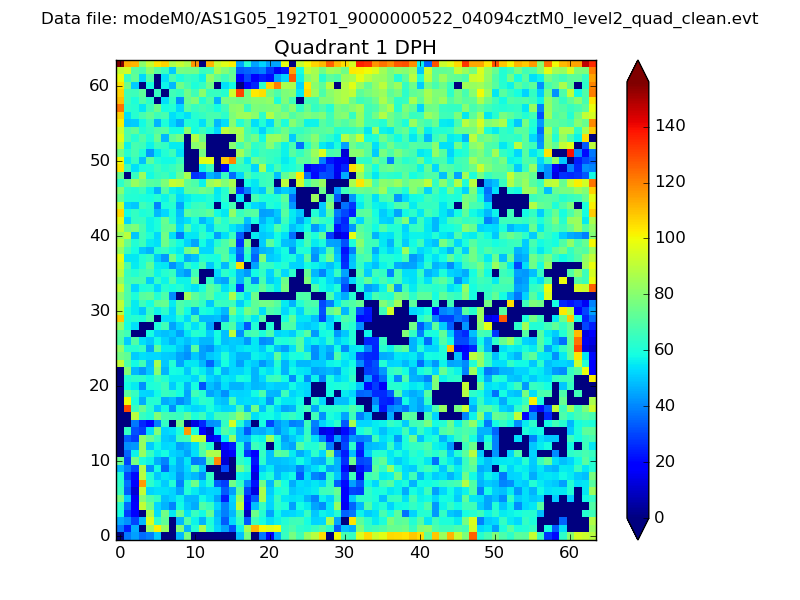 |
Quadrant B |
|---|---|---|---|
| Quadrant D | 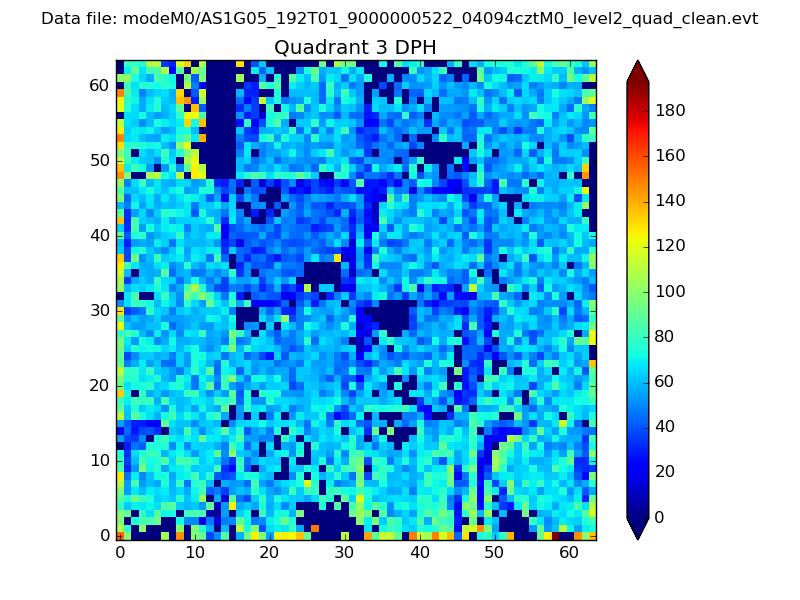 |
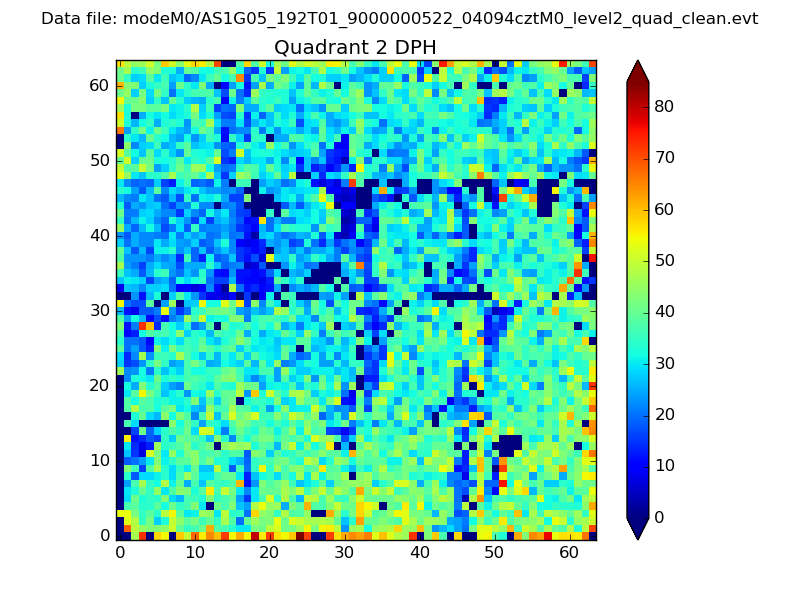 |
Quadrant C |
| Plot type | Count rate plots | Images |
|---|---|---|
| Comparison with Poisson distribution Blue bars denote a histogram of data divided into 1 sec bins. Red curve is a Poisson curve with rate = median count rate of data. |
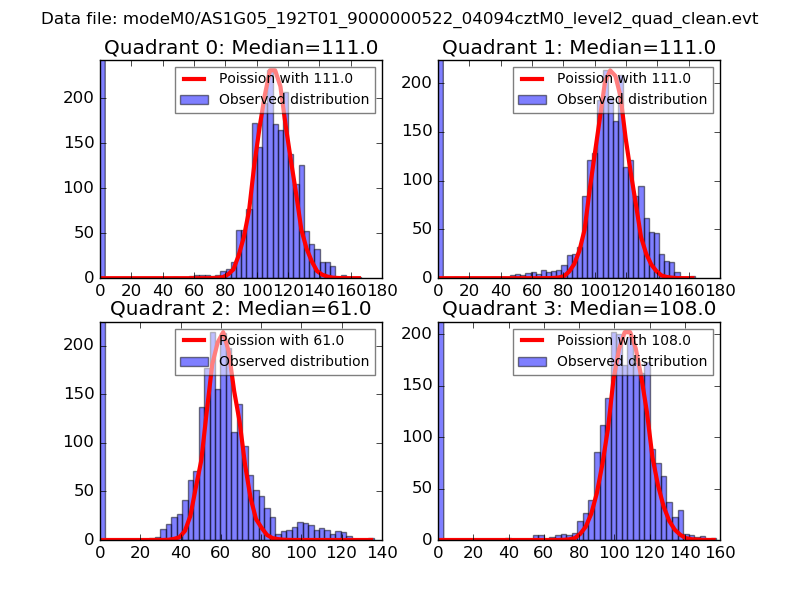 |
 |
| Quadrant-wise count rates Data is divided into 100 sec bins |
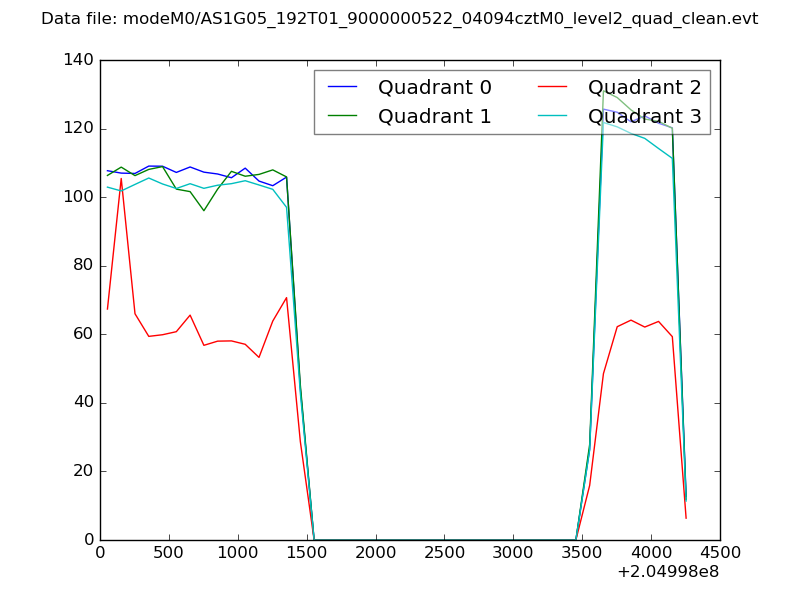 |
|
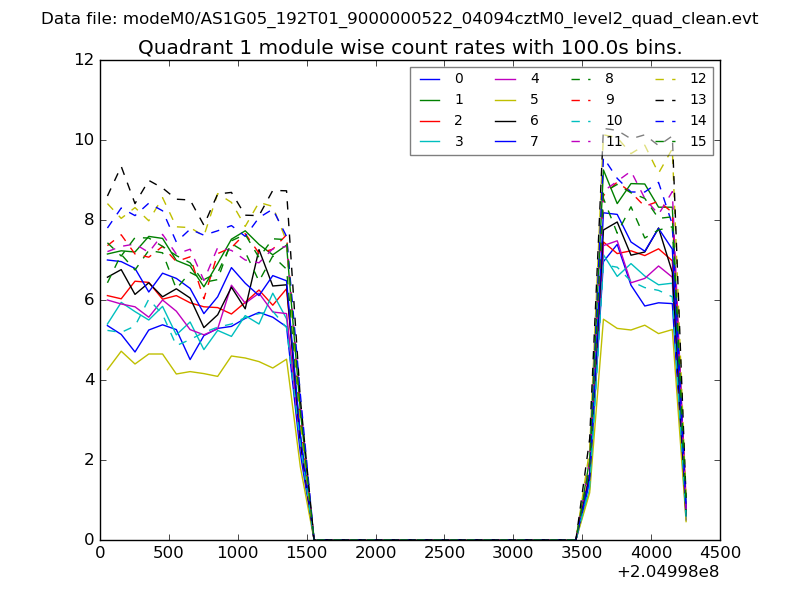
| Module-wise count rates for Quadrant A Data is divided into 100 sec bins |
 |
 |
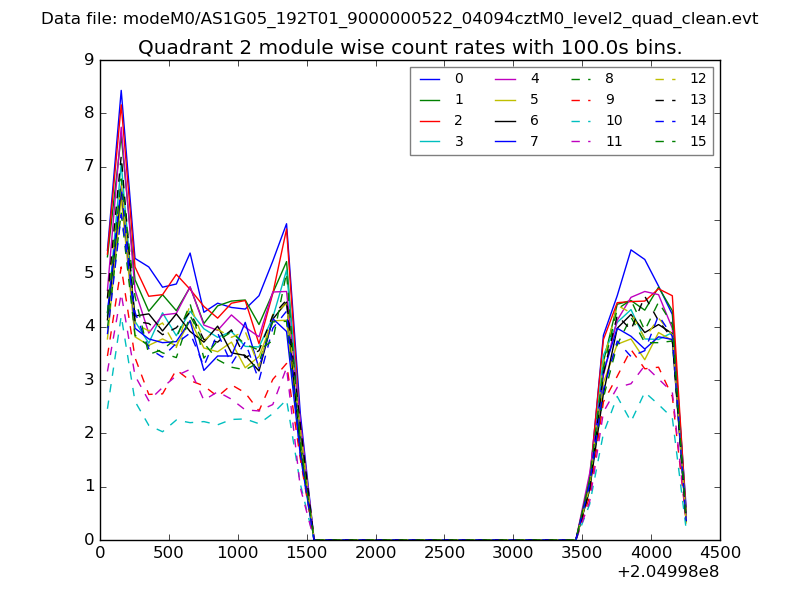
| Module-wise count rates for Quadrant B Data is divided into 100 sec bins |
 |
 |
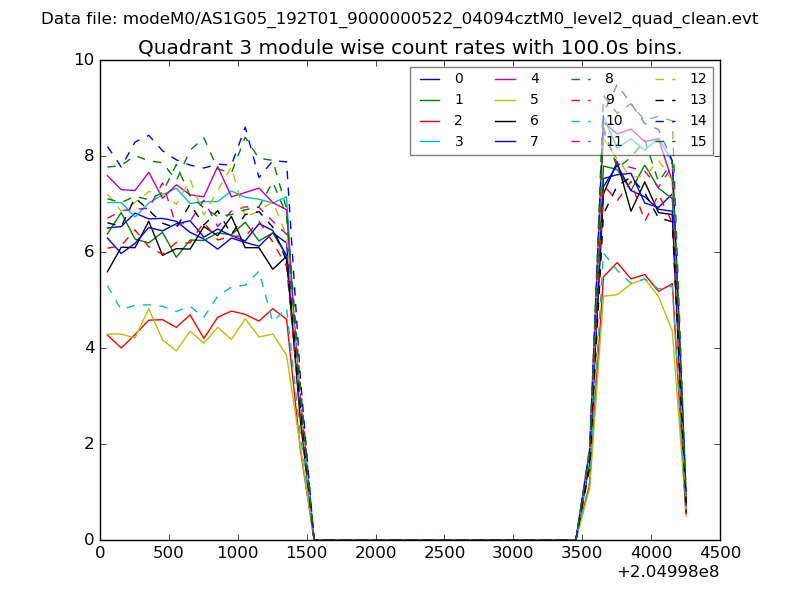
| Module-wise count rates for Quadrant C Data is divided into 100 sec bins |
 |
 |
| Module-wise count rates for Quadrant D Data is divided into 100 sec bins |
 |
 |
| Parameter | Plot |
|---|---|
| CZT HV Monitor | 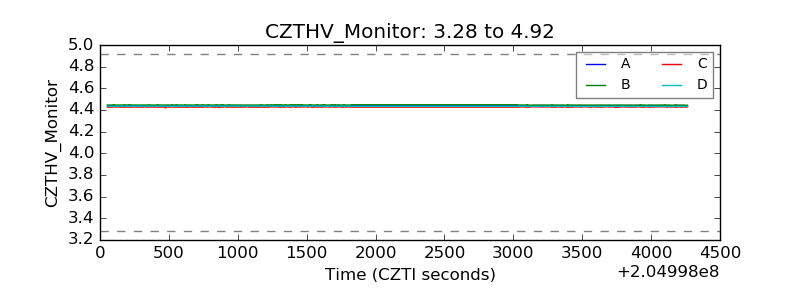 |
| D_VDD | 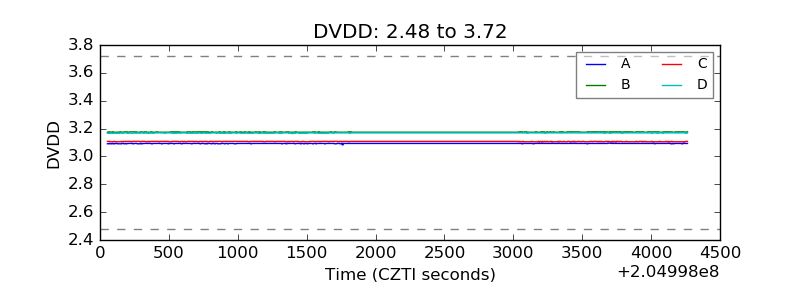 |
| Temperature 1 | 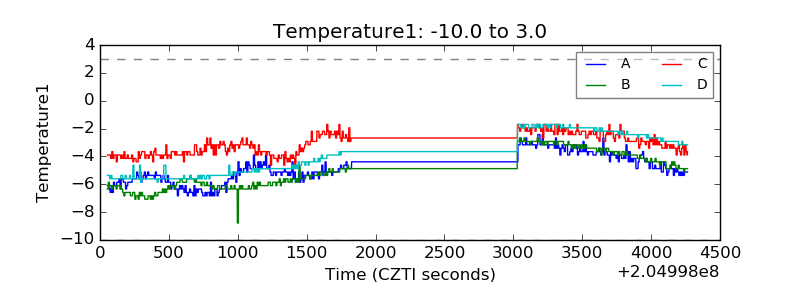 |
| Veto HV Monitor | 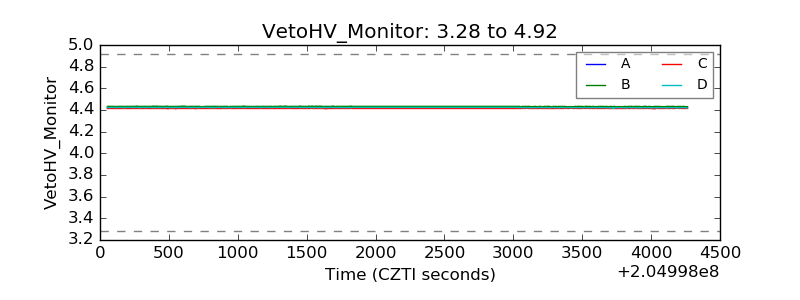 |
| Veto LLD | 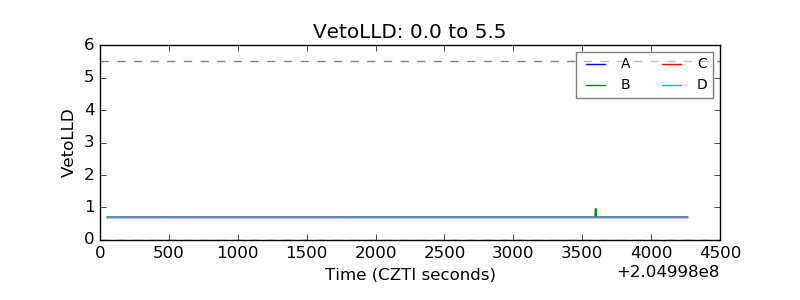 |
| Alpha Counter |  |
| _CPM_Rate | 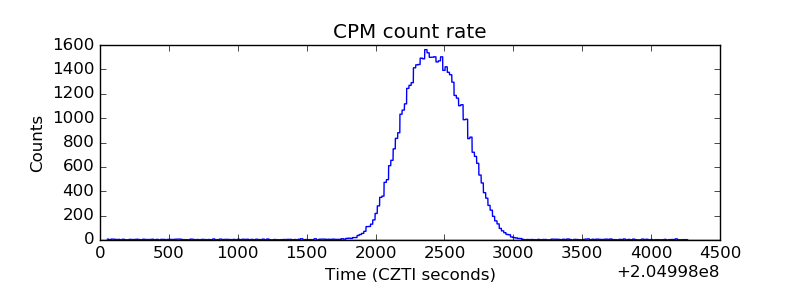 |
| CZT Counter | 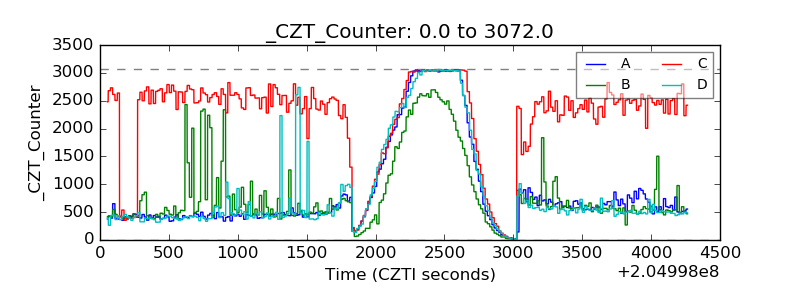 |
| +2.5 Volts monitor |  |
| +5 Volts monitor |  |
| _ROLL_ROT | 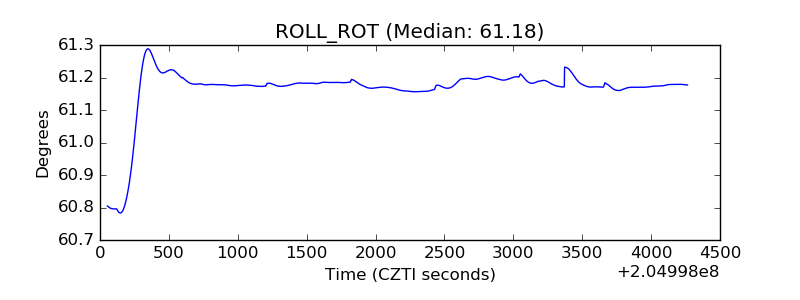 |
| _Roll_DEC | 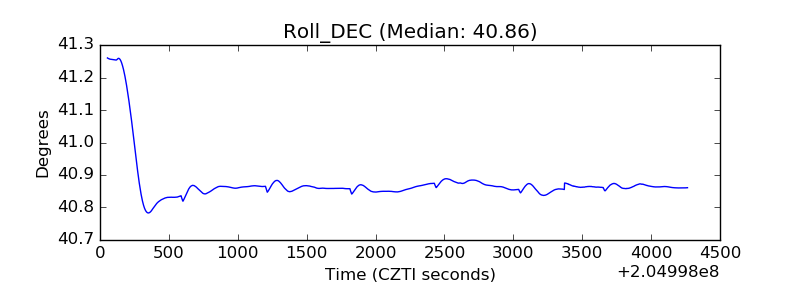 |
| _Roll_RA | 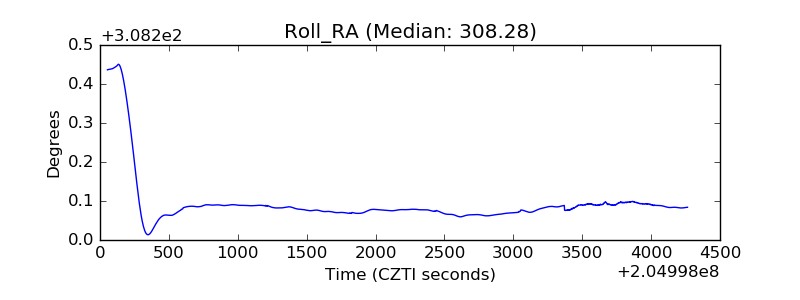 |
| Veto Counter | 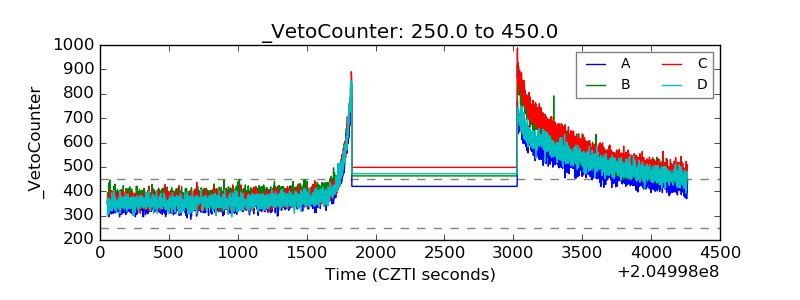 |