| Param | Original file | Final file |
|---|---|---|
| Filename | modeM0/AS1G05_192T01_9000000522_04095cztM0_level2.evt | modeM0/AS1G05_192T01_9000000522_04095cztM0_level2_quad_clean.evt |
| Size (bytes) | 730,157,760 | 80,208,000 |
| Size | 696.3 MB | 76.5 MB |
| Events in quadrant A | 3,034,112 | 556,686 |
| Events in quadrant B | 3,548,165 | 560,097 |
| Events in quadrant C | 12,181,084 | 360,053 |
| Events in quadrant D | 2,947,085 | 535,535 |
| Mode SS | |||
|---|---|---|---|
| Quadrant | BADHDUFLAG | Total packets | Discarded packets |
| A | 0 | 120 | 0 |
| B | 0 | 120 | 0 |
| C | 0 | 120 | 0 |
| D | 0 | 120 | 0 |
| Mode M0 | |||
|---|---|---|---|
| Quadrant | BADHDUFLAG | Total packets | Discarded packets |
| A | 0 | 13078 | 2 |
| B | 0 | 14374 | 1 |
| C | 0 | 40225 | 1 |
| D | 0 | 12779 | 1 |
| Mode M9 | |||
|---|---|---|---|
| Quadrant | BADHDUFLAG | Total packets | Discarded packets |
| A | 0 | 13 | 0 |
| B | 0 | 13 | 0 |
| C | 0 | 13 | 0 |
| D | 0 | 13 | 0 |
| Quadrant | Total seconds | Saturated seconds | Saturation percentage |
|---|---|---|---|
| A | 5939 | 70 | 1.178650% |
| B | 5939 | 197 | 3.317057% |
| C | 5939 | 4637 | 78.077117% |
| D | 5939 | 50 | 0.841893% |
Noise dominated data is calculated using 1-second bins in cleaned event files. If a bin has >2000 counts, and if more than 50% of those come from <1% of pixels, then it is considered to be noise-dominated and hence unusable.
| Quadrant | # 1 sec bins | Bins with >0 counts | Bins with >2000 counts | High rate bins dominated by noise | Noise dominated (total time) | Noise dominated (detector-on time) | Marked lightcurve |
|---|---|---|---|---|---|---|---|
| A | 7204 | 5939 | 12 | 12 | 0.17% | 0.20% | 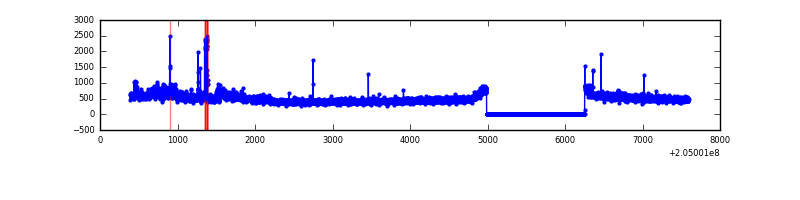 |
| B | 7204 | 5939 | 70 | 70 | 0.97% | 1.18% | 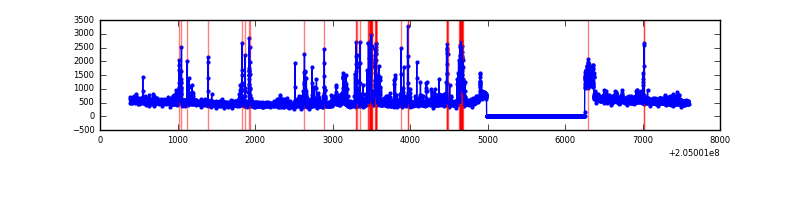 |
| C | 7203 | 5938 | 4517 | 4517 | 62.71% | 76.07% | 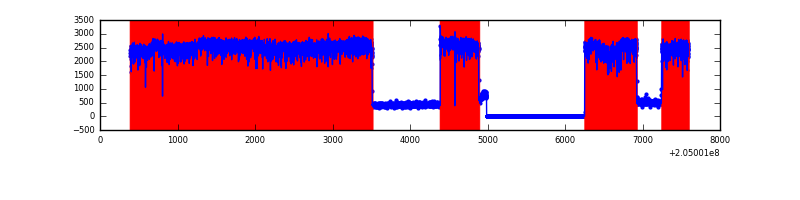 |
| D | 7204 | 5939 | 10 | 10 | 0.14% | 0.17% | 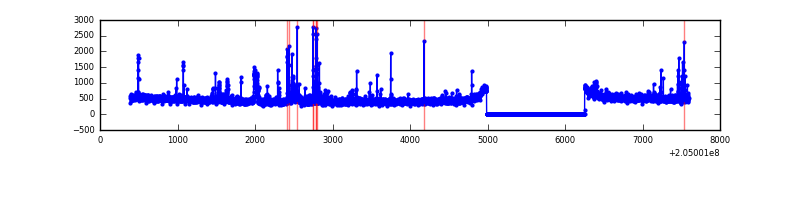 |
Top three noisy pixels from each quadrant. If the there are fewer than three noisy pixels in the level2.evt file, extra rows are filled as -1
| Pixel properties | Quadrant properties | ||||||
|---|---|---|---|---|---|---|---|
| Quadrant | DetID | PixID | Counts | Sigma | Mean | Median | Sigma |
| A | 0 | 199 | 168450 | 1121.35 | 726 | 711 | 149.6 |
| A | 0 | 50 | 44221 | 290.87 | 726 | 711 | 149.6 |
| A | 0 | 226 | 23305 | 151.04 | 726 | 711 | 149.6 |
| B | 10 | 16 | 397661 | 2875.72 | 732 | 716 | 138.0 |
| B | 14 | 167 | 112371 | 808.9 | 732 | 716 | 138.0 |
| B | 3 | 0 | 109905 | 791.03 | 732 | 716 | 138.0 |
| C | 12 | 204 | 10209494 | 90213.69 | 492 | 494 | 113.2 |
| C | 14 | 234 | 39944 | 348.6 | 492 | 494 | 113.2 |
| C | 12 | 4 | 5154 | 41.17 | 492 | 494 | 113.2 |
| D | 10 | 172 | 98091 | 572.63 | 711 | 691 | 170.1 |
| D | 13 | 53 | 48384 | 280.39 | 711 | 691 | 170.1 |
| D | 2 | 37 | 30546 | 175.52 | 711 | 691 | 170.1 |
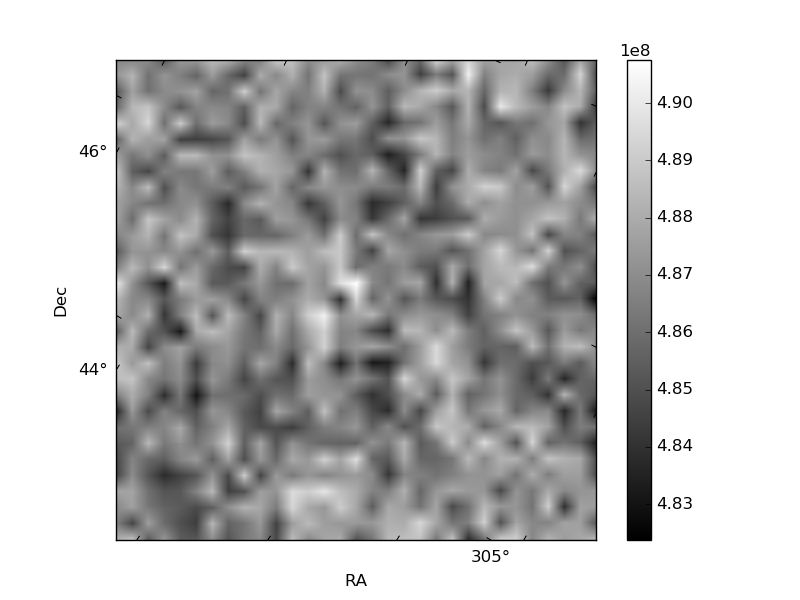
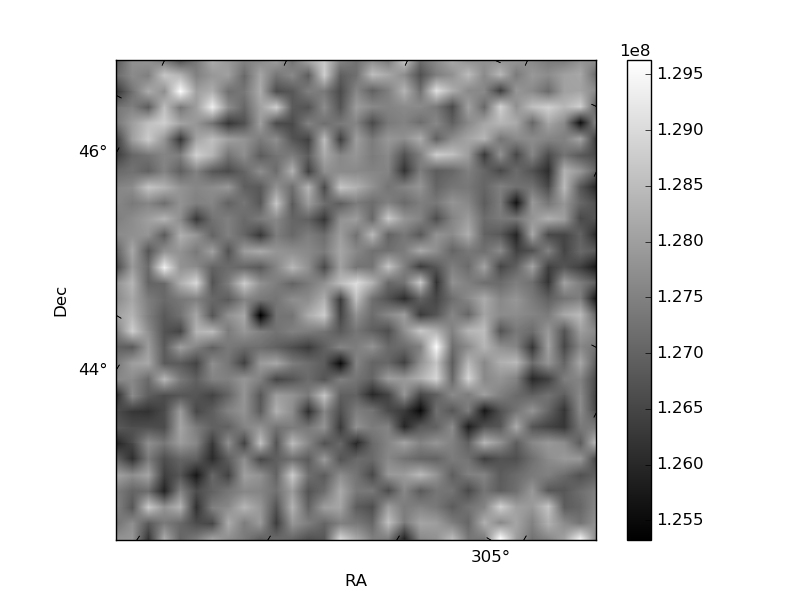
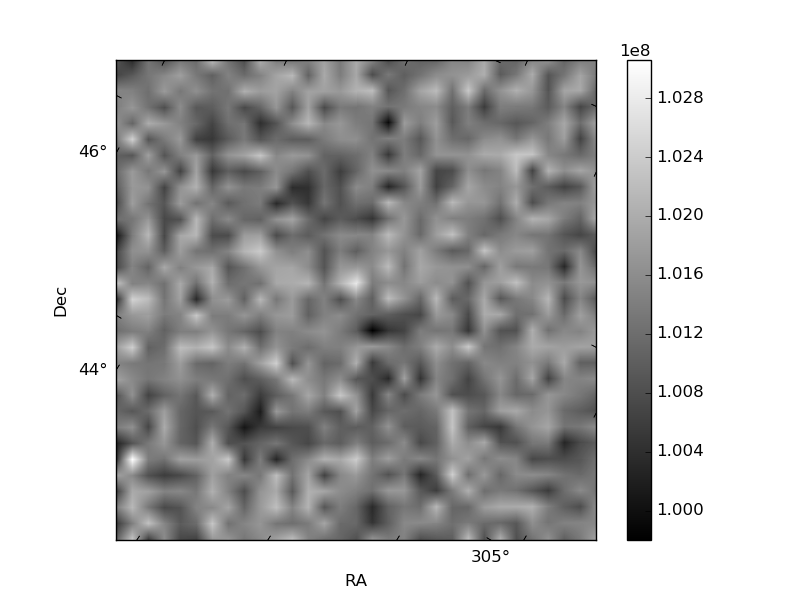
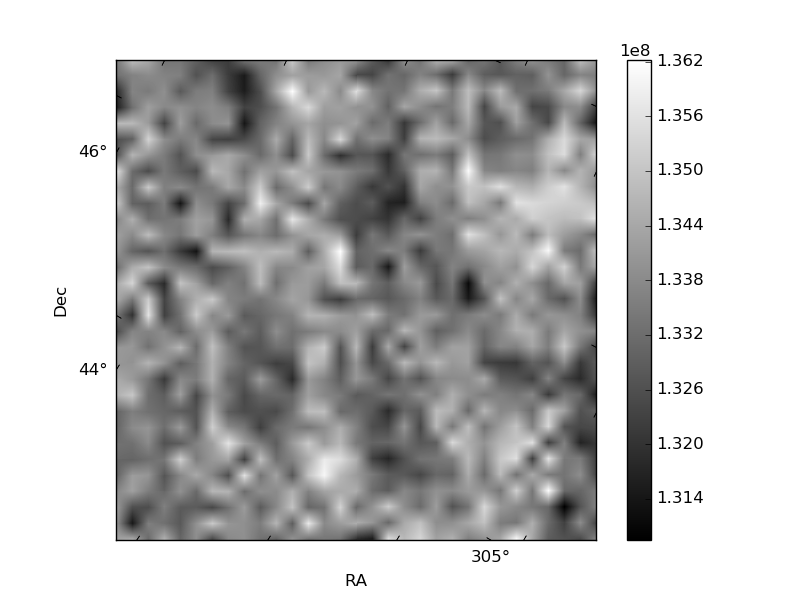
Histogram calculated using DETX and DETY for each event in the final _common_clean file
| Quadrant A | 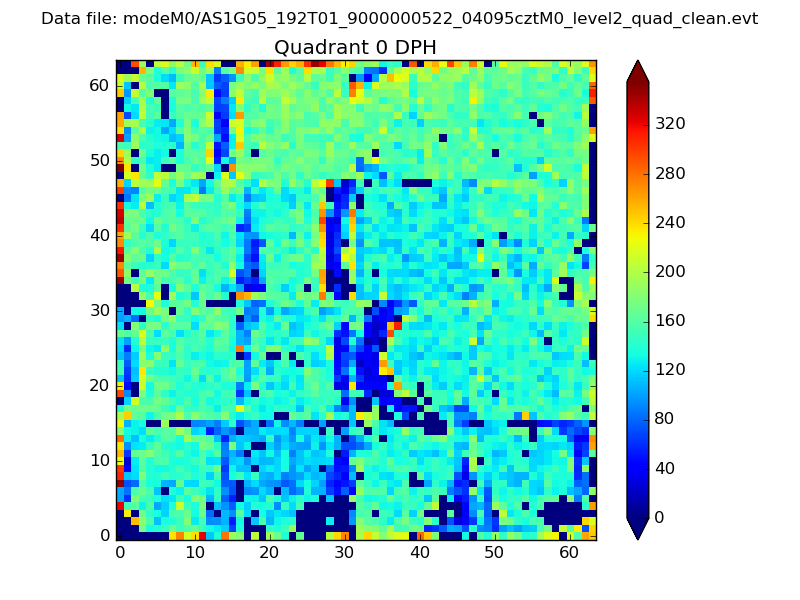 |
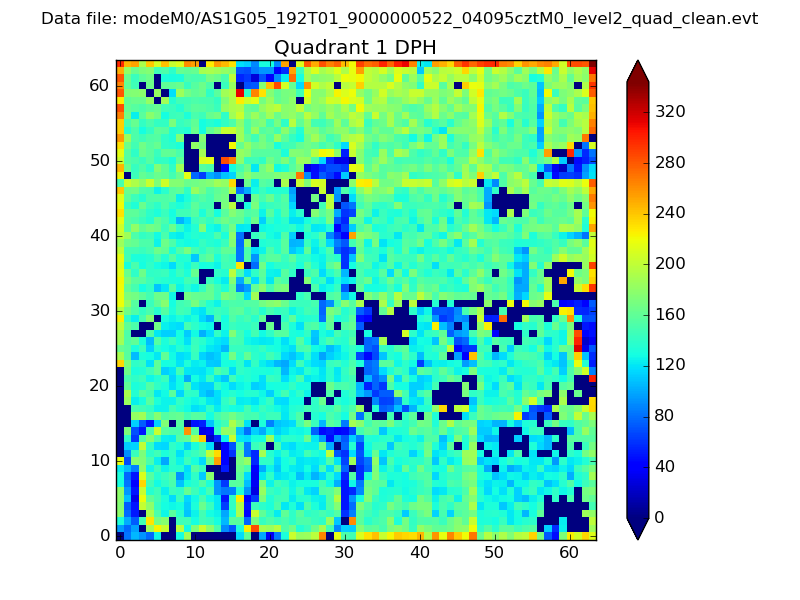 |
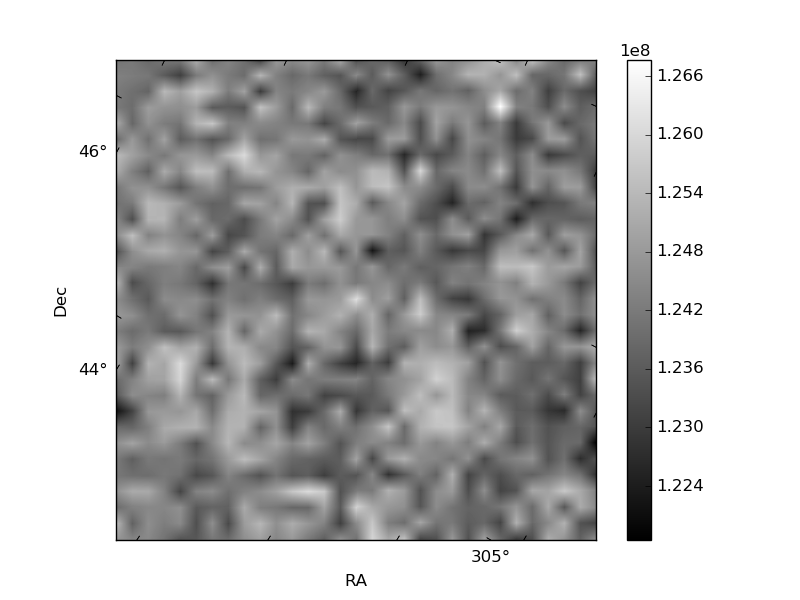
Quadrant B |
|---|---|---|---|
| Quadrant D | 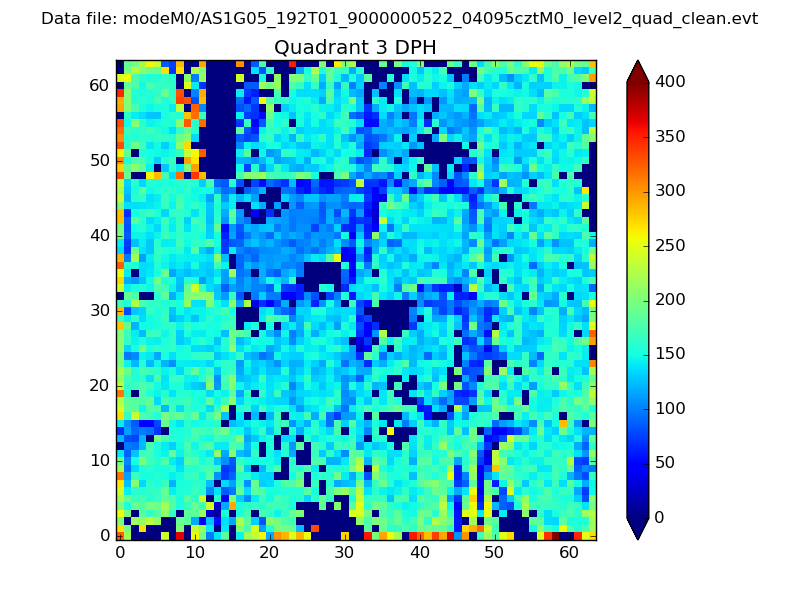 |
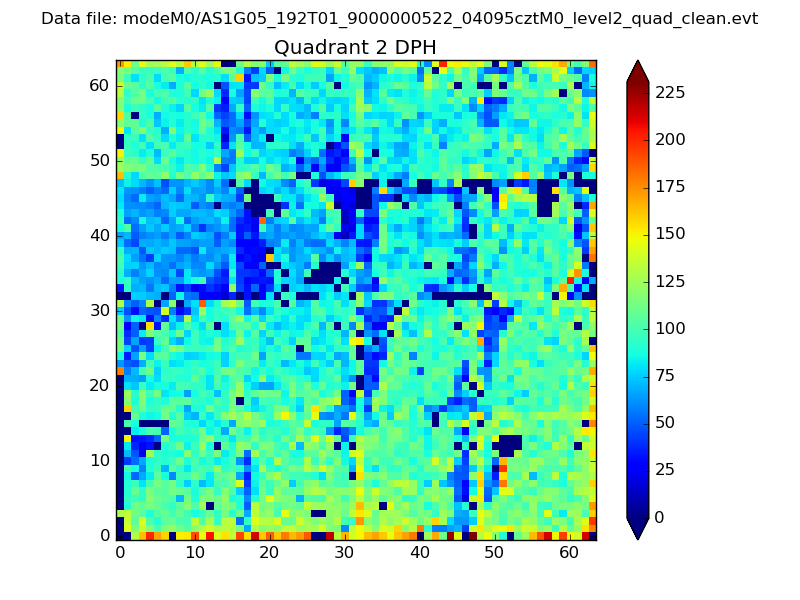 |
Quadrant C |
| Plot type | Count rate plots | Images |
|---|---|---|
| Comparison with Poisson distribution Blue bars denote a histogram of data divided into 1 sec bins. Red curve is a Poisson curve with rate = median count rate of data. |
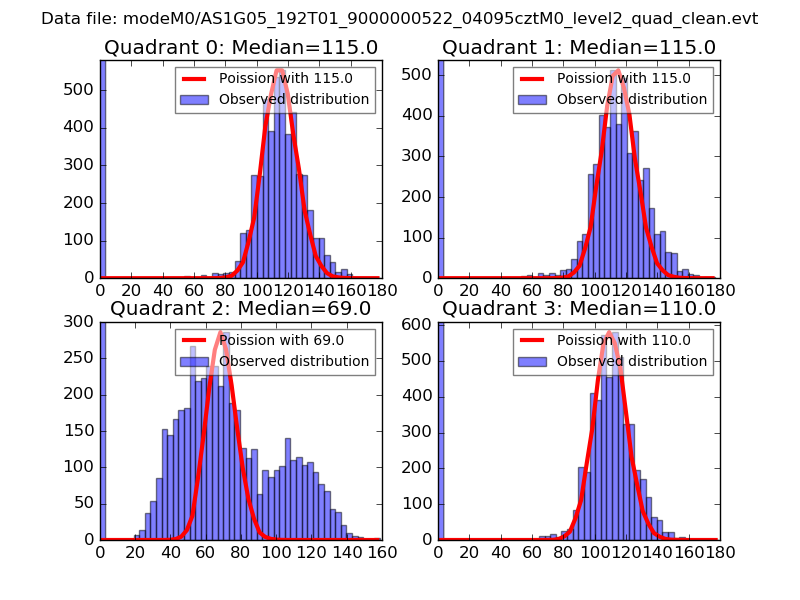 |
 |
| Quadrant-wise count rates Data is divided into 100 sec bins |
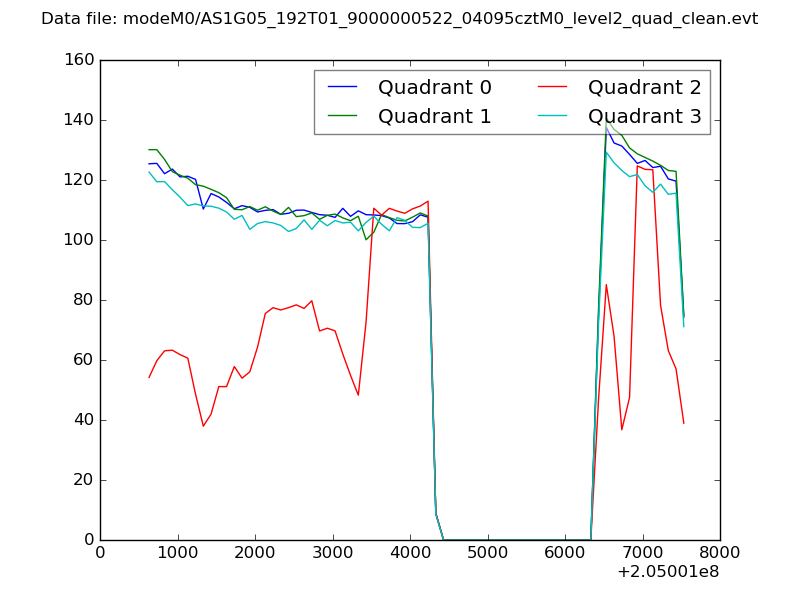 |
|
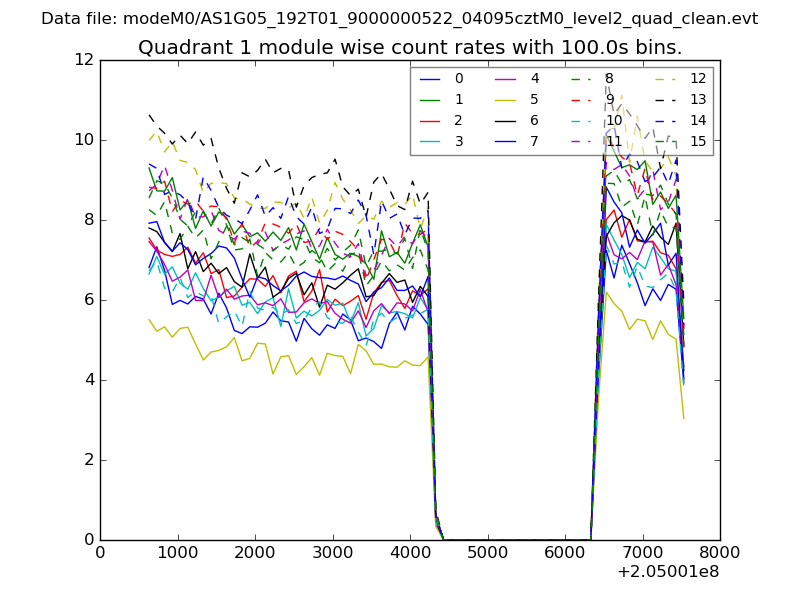
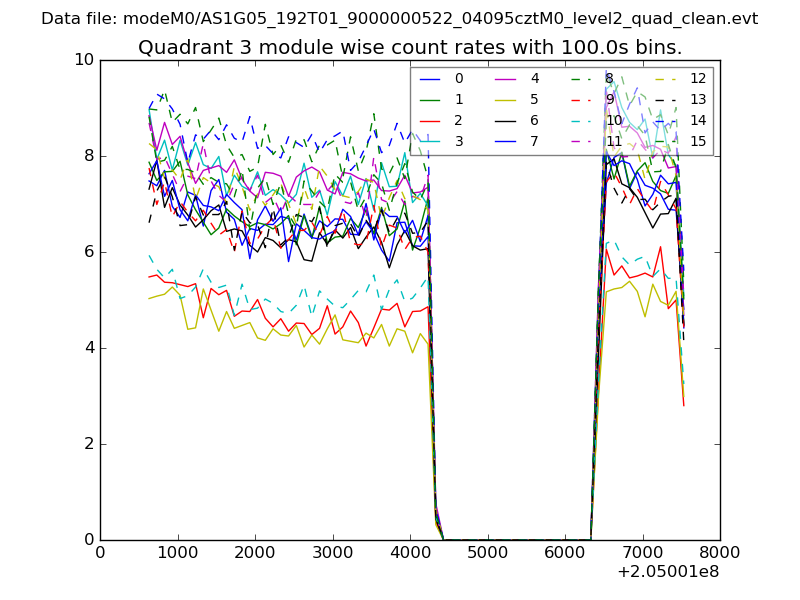
| Module-wise count rates for Quadrant A Data is divided into 100 sec bins |
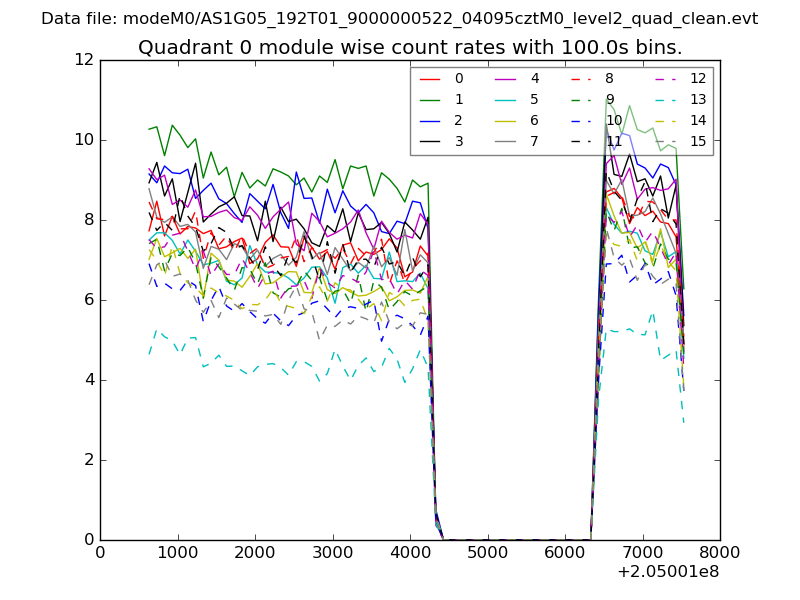 |
 |
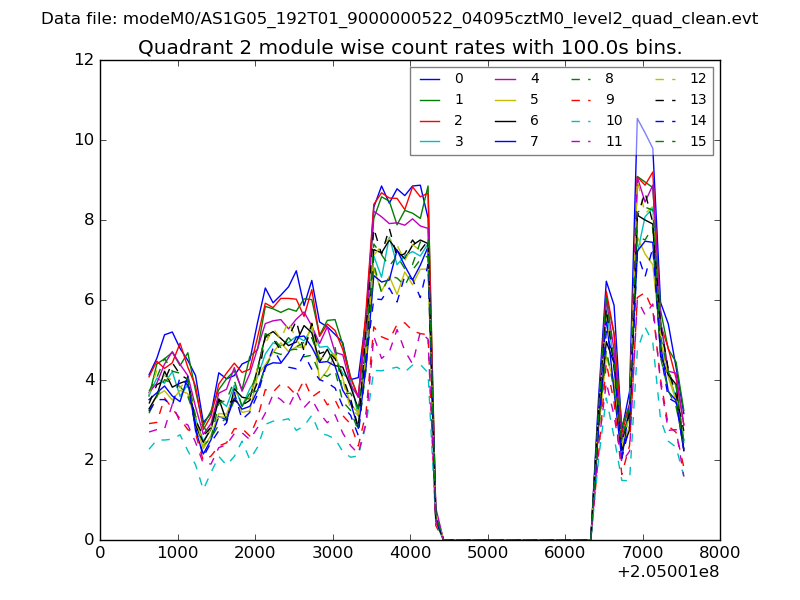
| Module-wise count rates for Quadrant B Data is divided into 100 sec bins |
 |
 |
| Module-wise count rates for Quadrant C Data is divided into 100 sec bins |
 |
 |
| Module-wise count rates for Quadrant D Data is divided into 100 sec bins |
 |
 |
| Parameter | Plot |
|---|---|
| CZT HV Monitor | 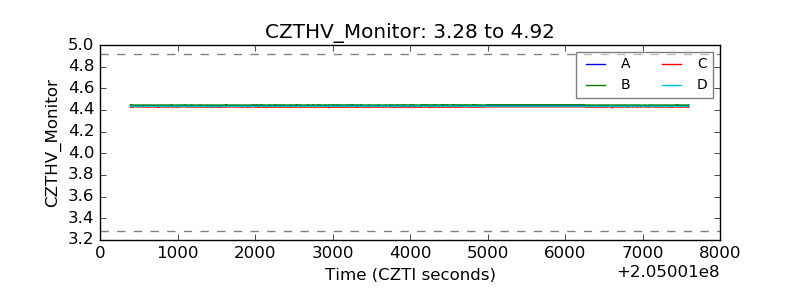 |
| D_VDD | 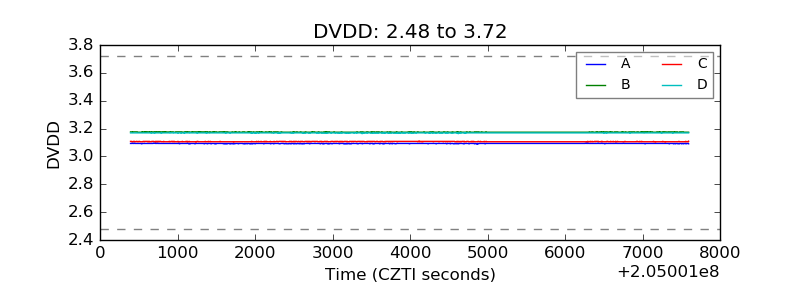 |
| Temperature 1 | 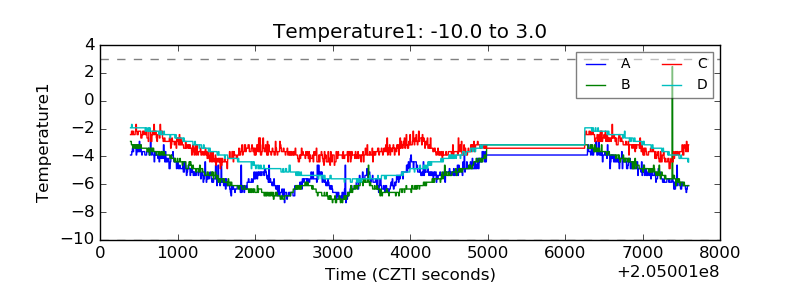 |
| Veto HV Monitor | 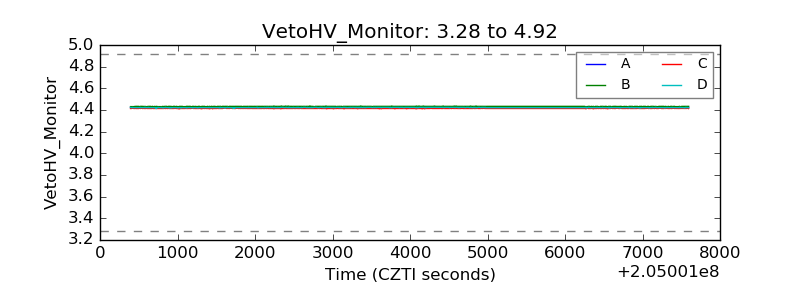 |
| Veto LLD | 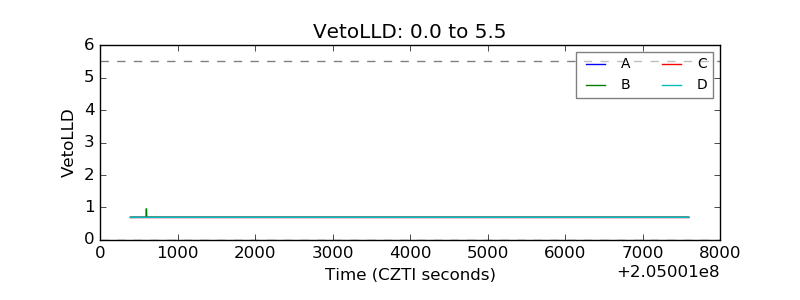 |
| Alpha Counter | 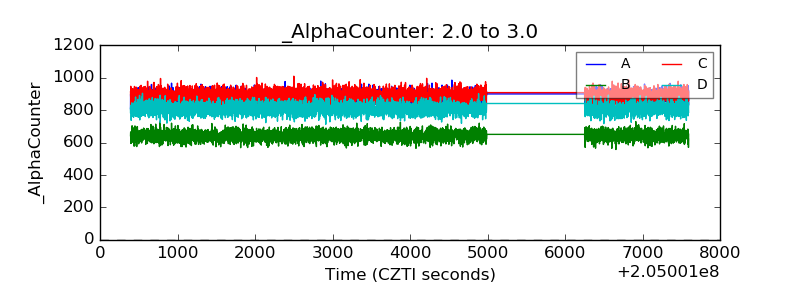 |
| _CPM_Rate | 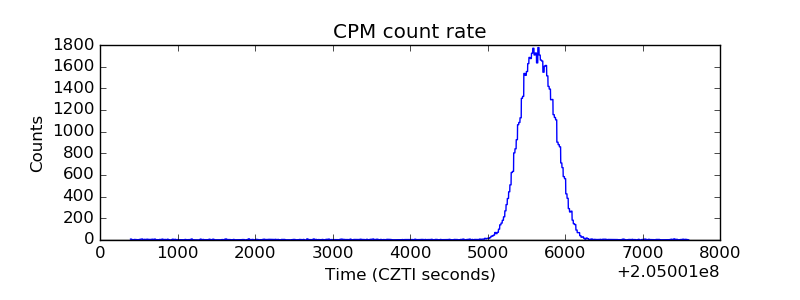 |
| CZT Counter | 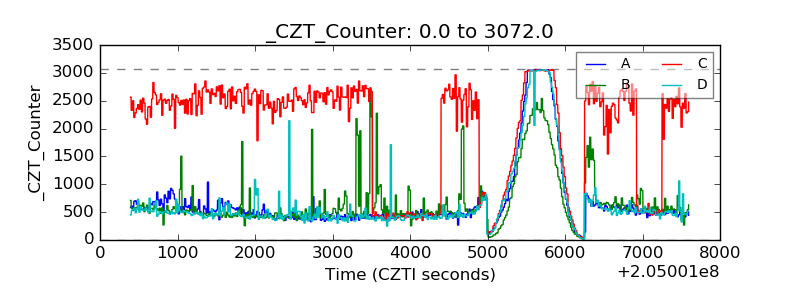 |
| +2.5 Volts monitor |  |
| +5 Volts monitor |  |
| _ROLL_ROT | 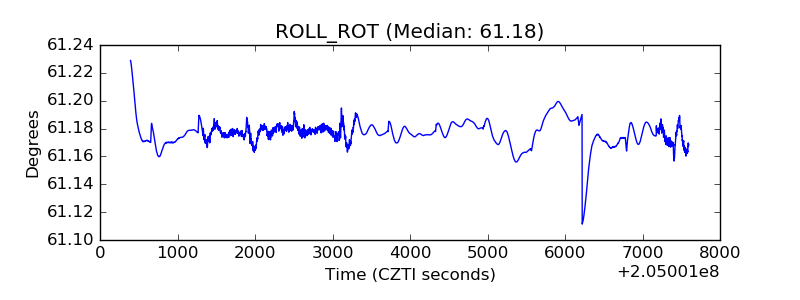 |
| _Roll_DEC | 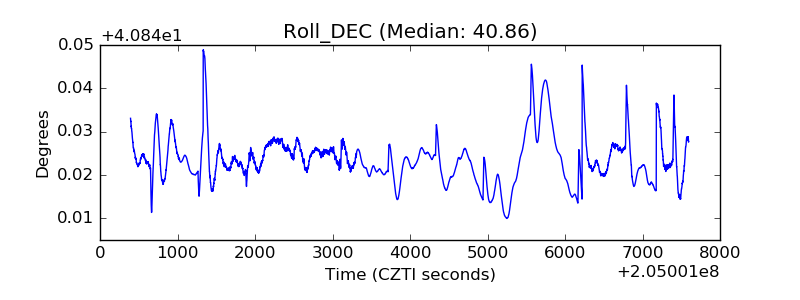 |
| _Roll_RA | 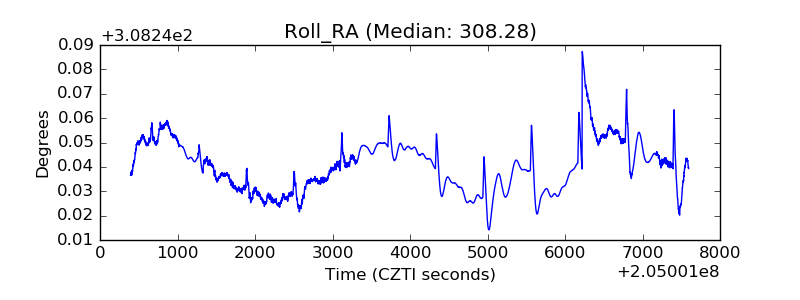 |
| Veto Counter | 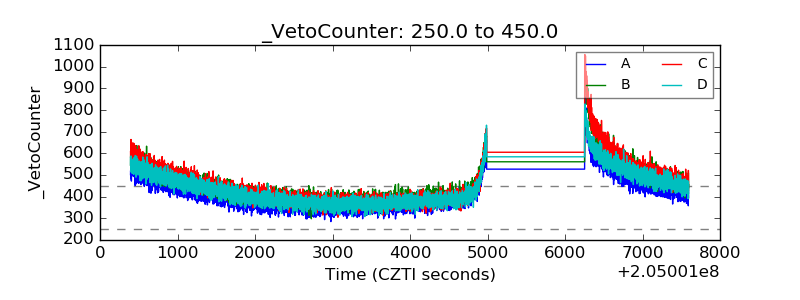 |