| Param | Original file | Final file |
|---|---|---|
| Filename | modeM0/AS1G05_192T01_9000000522_04096cztM0_level2.evt | modeM0/AS1G05_192T01_9000000522_04096cztM0_level2_quad_clean.evt |
| Size (bytes) | 668,076,480 | 85,150,080 |
| Size | 637.1 MB | 81.2 MB |
| Events in quadrant A | 3,149,031 | 580,709 |
| Events in quadrant B | 4,756,032 | 576,680 |
| Events in quadrant C | 8,730,635 | 429,601 |
| Events in quadrant D | 3,177,549 | 557,961 |
| Mode SS | |||
|---|---|---|---|
| Quadrant | BADHDUFLAG | Total packets | Discarded packets |
| A | 0 | 124 | 0 |
| B | 0 | 124 | 0 |
| C | 0 | 124 | 0 |
| D | 0 | 124 | 0 |
| Mode M0 | |||
|---|---|---|---|
| Quadrant | BADHDUFLAG | Total packets | Discarded packets |
| A | 0 | 13731 | 3 |
| B | 0 | 18428 | 5 |
| C | 0 | 29997 | 2 |
| D | 0 | 13727 | 2 |
| Mode M9 | |||
|---|---|---|---|
| Quadrant | BADHDUFLAG | Total packets | Discarded packets |
| A | 0 | 14 | 0 |
| B | 0 | 14 | 0 |
| C | 0 | 14 | 0 |
| D | 0 | 15 | 0 |
| Quadrant | Total seconds | Saturated seconds | Saturation percentage |
|---|---|---|---|
| A | 6200 | 49 | 0.790323% |
| B | 6199 | 276 | 4.452331% |
| C | 6200 | 2763 | 44.564516% |
| D | 6200 | 67 | 1.080645% |
Noise dominated data is calculated using 1-second bins in cleaned event files. If a bin has >2000 counts, and if more than 50% of those come from <1% of pixels, then it is considered to be noise-dominated and hence unusable.
| Quadrant | # 1 sec bins | Bins with >0 counts | Bins with >2000 counts | High rate bins dominated by noise | Noise dominated (total time) | Noise dominated (detector-on time) | Marked lightcurve |
|---|---|---|---|---|---|---|---|
| A | 7525 | 6201 | 12 | 12 | 0.16% | 0.19% | 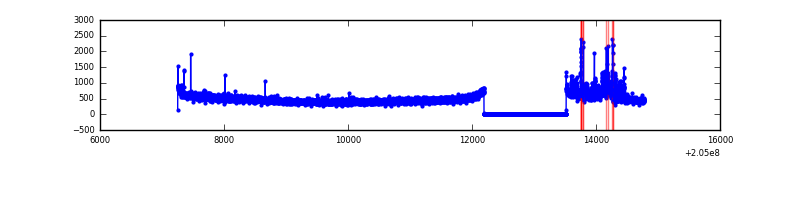 |
| B | 7525 | 6200 | 83 | 83 | 1.10% | 1.34% | 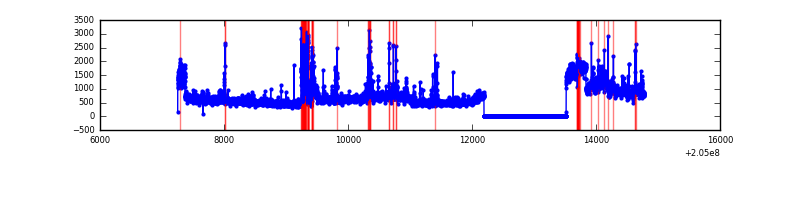 |
| C | 7525 | 6200 | 2699 | 2699 | 35.87% | 43.53% | 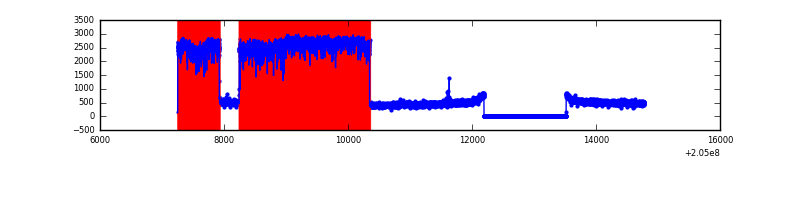 |
| D | 7525 | 6200 | 31 | 31 | 0.41% | 0.50% | 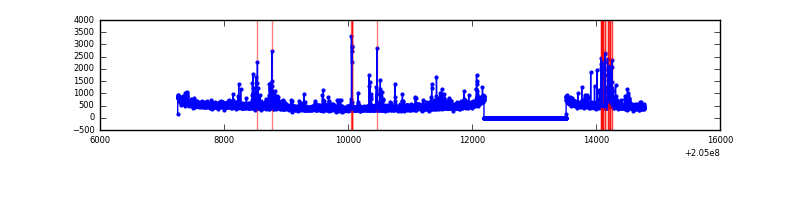 |
Top three noisy pixels from each quadrant. If the there are fewer than three noisy pixels in the level2.evt file, extra rows are filled as -1
| Pixel properties | Quadrant properties | ||||||
|---|---|---|---|---|---|---|---|
| Quadrant | DetID | PixID | Counts | Sigma | Mean | Median | Sigma |
| A | 0 | 199 | 166899 | 1076.84 | 757 | 740 | 154.3 |
| A | 14 | 111 | 35285 | 223.88 | 757 | 740 | 154.3 |
| A | 0 | 226 | 22144 | 138.71 | 757 | 740 | 154.3 |
| B | 3 | 0 | 1258731 | 8732.8 | 765 | 748 | 144.1 |
| B | 10 | 16 | 267128 | 1849.18 | 765 | 748 | 144.1 |
| B | 14 | 167 | 113935 | 785.73 | 765 | 748 | 144.1 |
| C | 12 | 204 | 6323125 | 45259.62 | 607 | 610 | 139.7 |
| C | 14 | 234 | 27225 | 190.52 | 607 | 610 | 139.7 |
| C | 13 | 61 | 4908 | 30.77 | 607 | 610 | 139.7 |
| D | 10 | 172 | 201903 | 1128.26 | 740 | 719 | 178.3 |
| D | 2 | 37 | 74986 | 416.5 | 740 | 719 | 178.3 |
| D | 13 | 239 | 53150 | 294.04 | 740 | 719 | 178.3 |
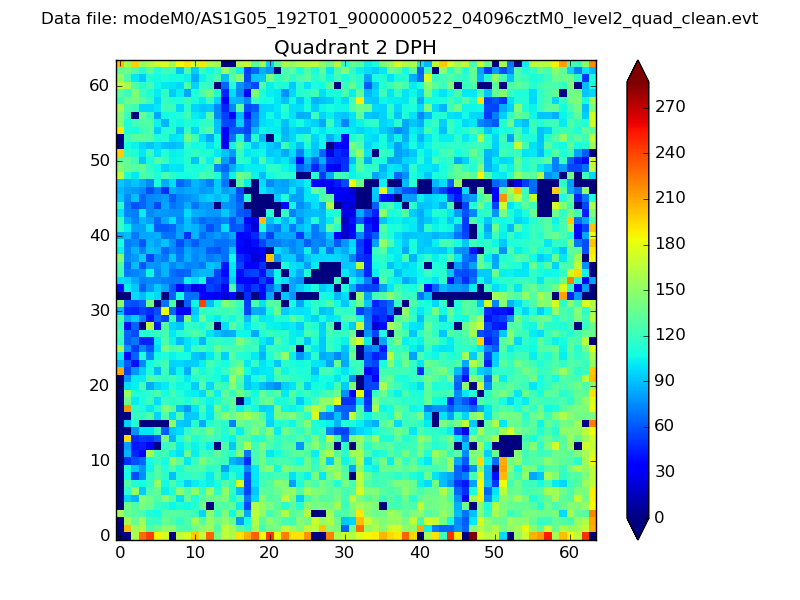
Histogram calculated using DETX and DETY for each event in the final _common_clean file
| Quadrant A | 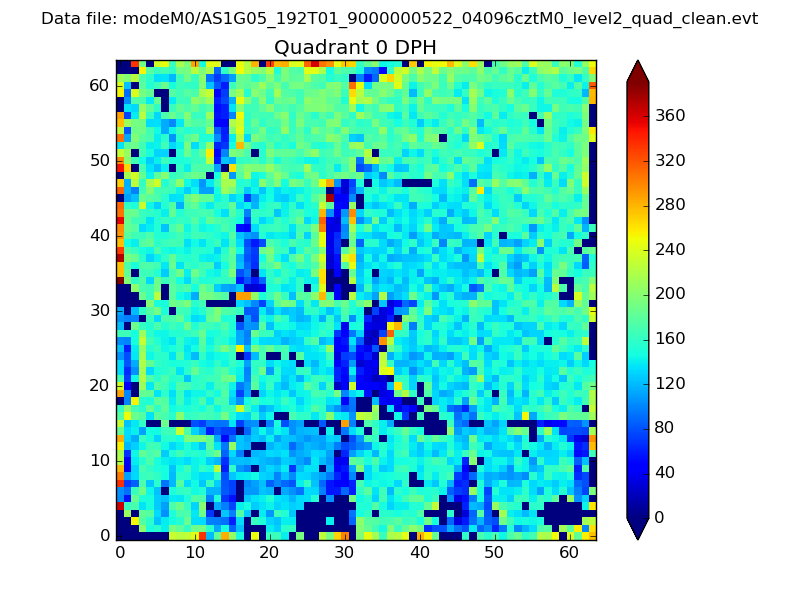 |
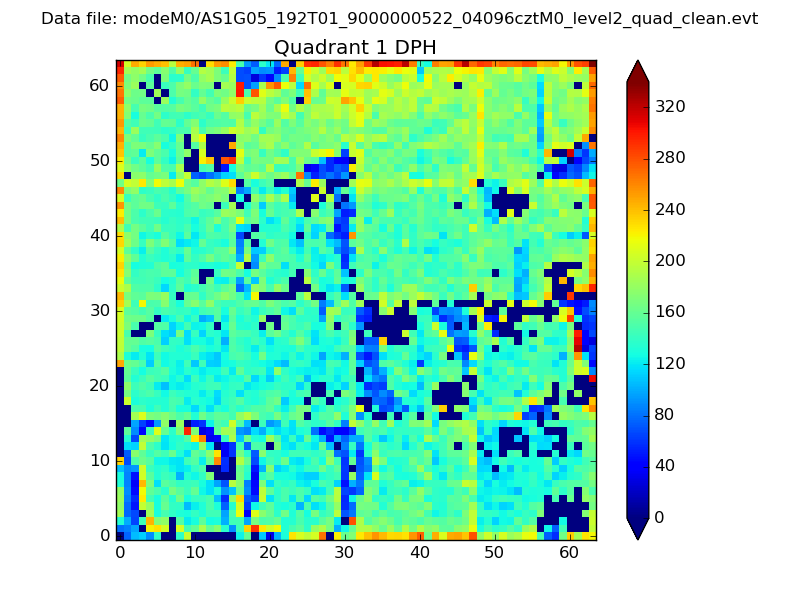 |
Quadrant B |
|---|---|---|---|
| Quadrant D | 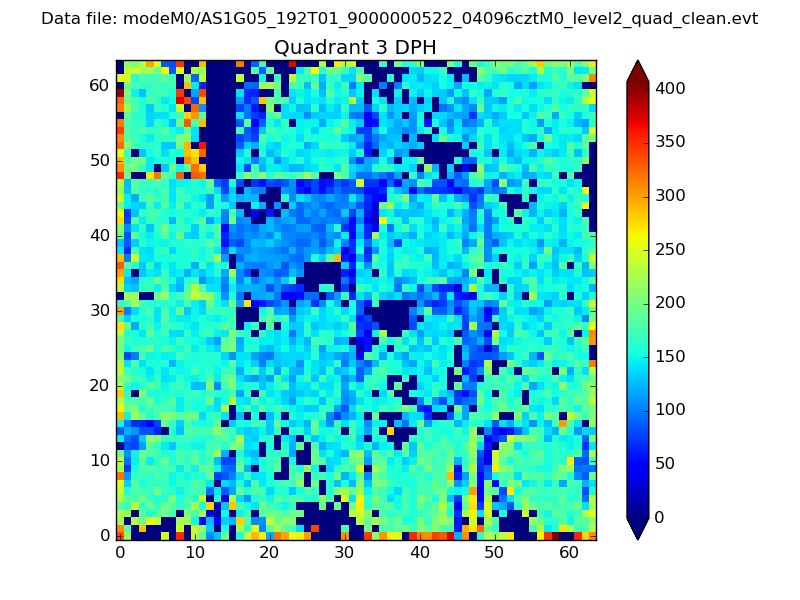 |
 |
Quadrant C |
| Plot type | Count rate plots | Images |
|---|---|---|
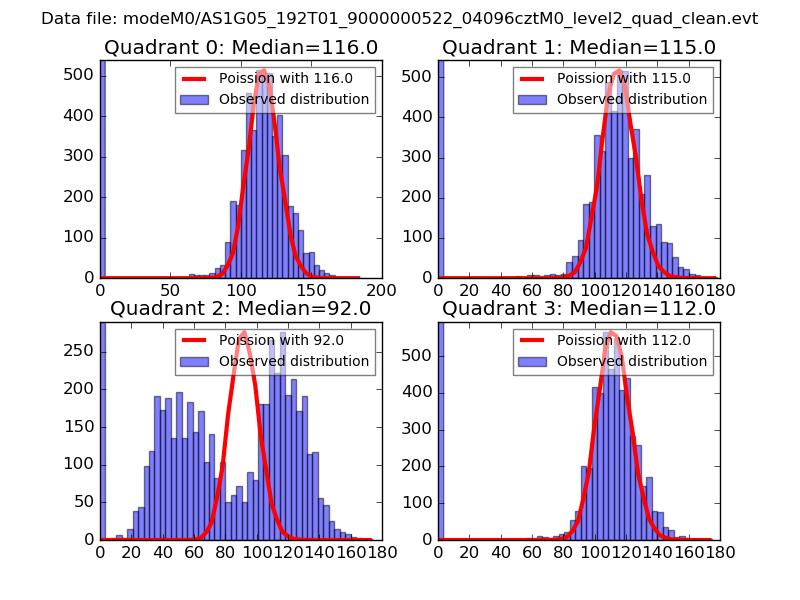
| Comparison with Poisson distribution Blue bars denote a histogram of data divided into 1 sec bins. Red curve is a Poisson curve with rate = median count rate of data. |
 |
 |
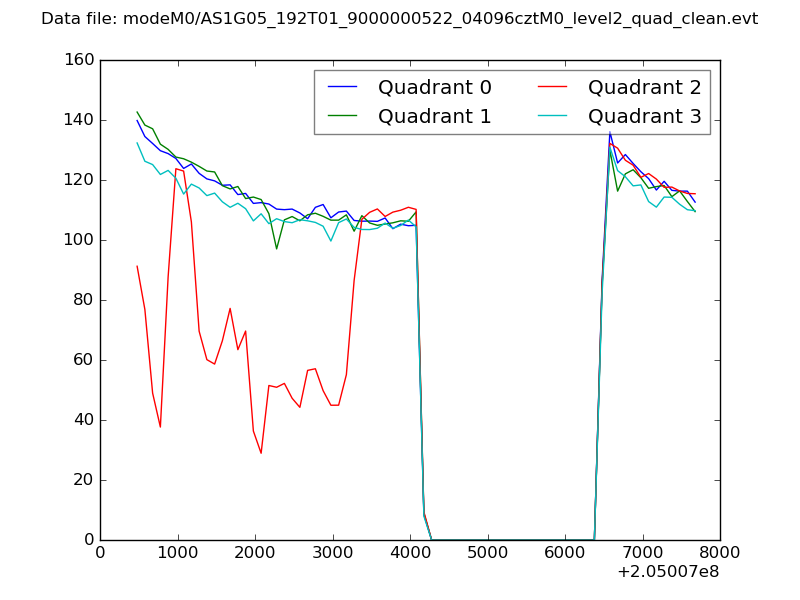
| Quadrant-wise count rates Data is divided into 100 sec bins |
 |
|
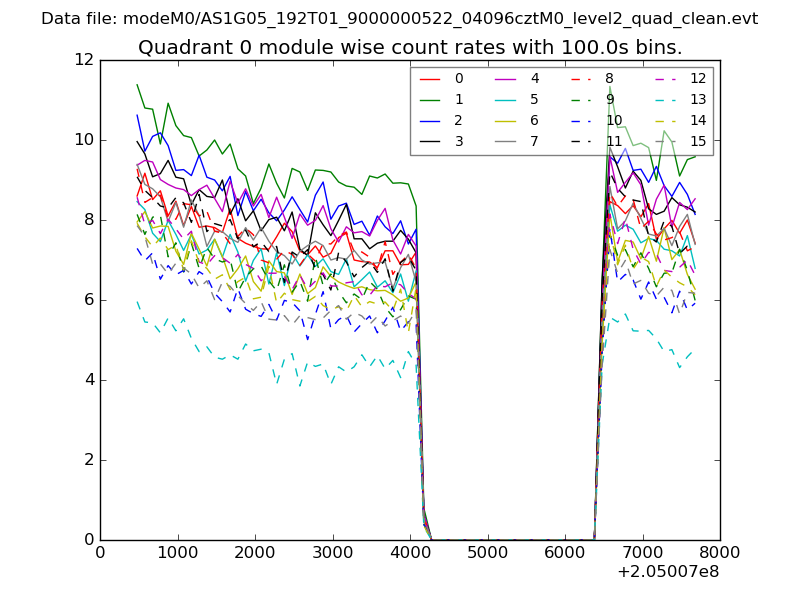
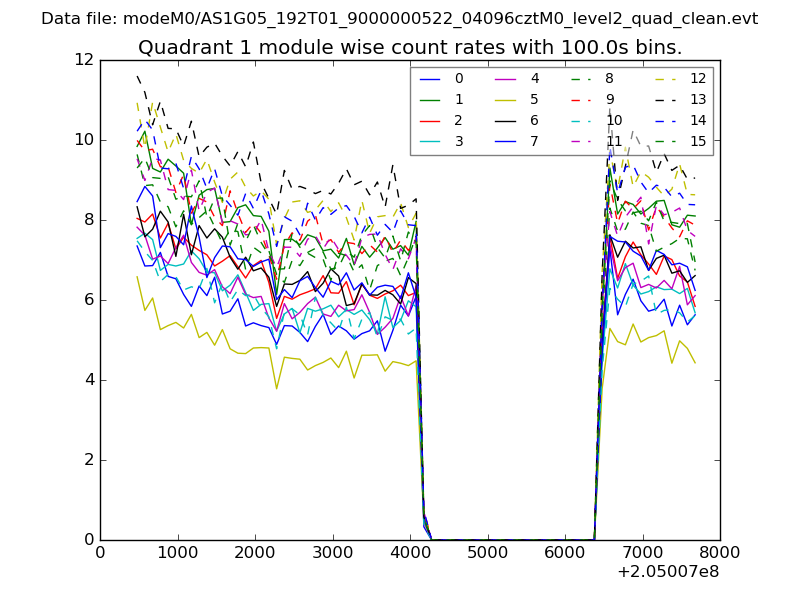
| Module-wise count rates for Quadrant A Data is divided into 100 sec bins |
 |
 |
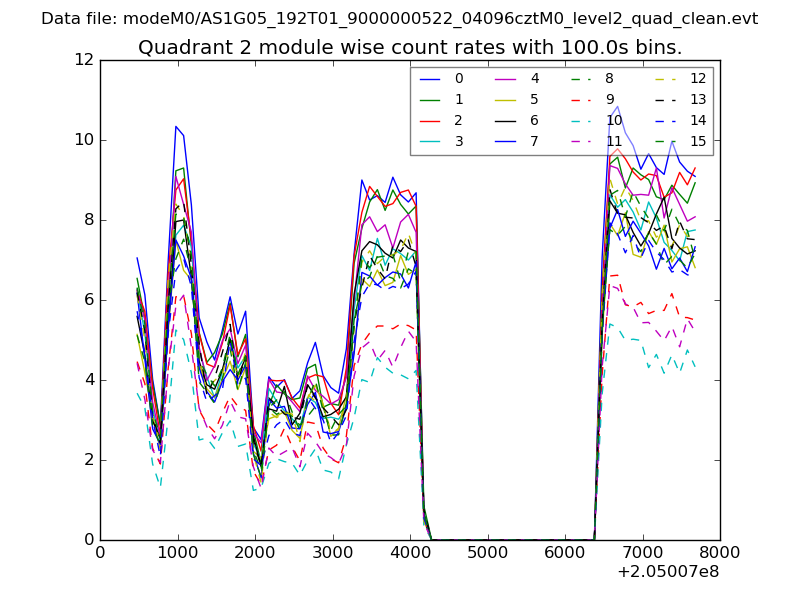
| Module-wise count rates for Quadrant B Data is divided into 100 sec bins |
 |
 |
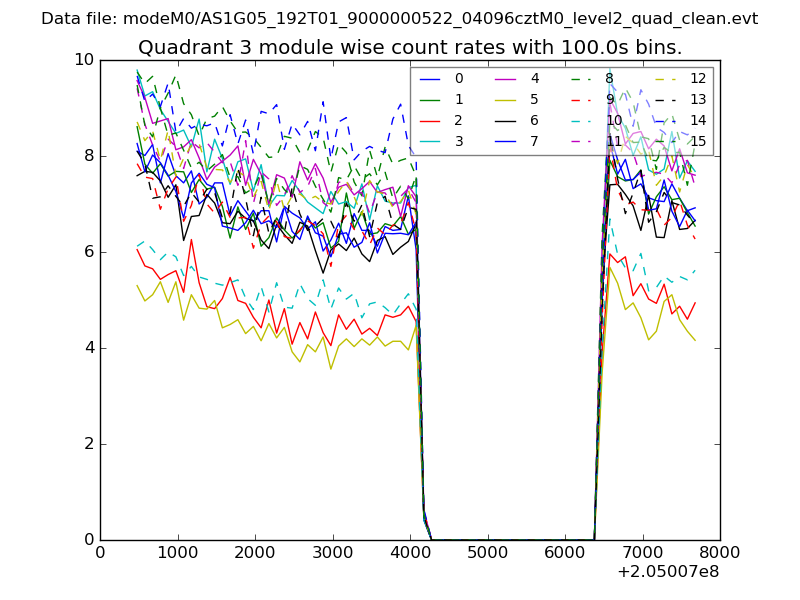
| Module-wise count rates for Quadrant C Data is divided into 100 sec bins |
 |
 |
| Module-wise count rates for Quadrant D Data is divided into 100 sec bins |
 |
 |
| Parameter | Plot |
|---|---|
| CZT HV Monitor | 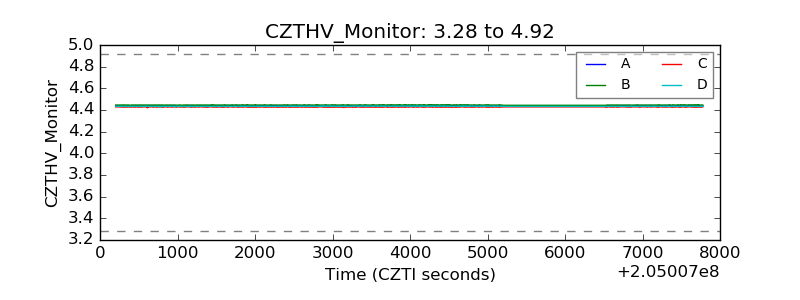 |
| D_VDD | 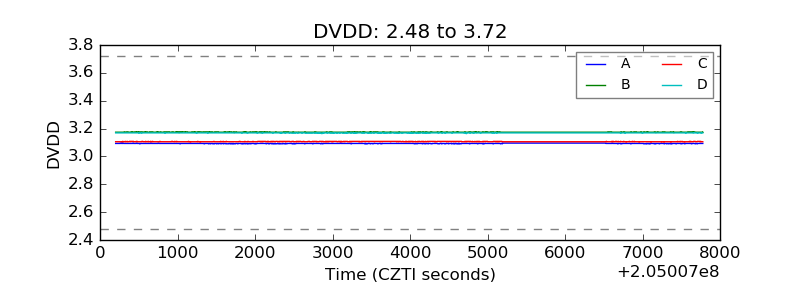 |
| Temperature 1 | 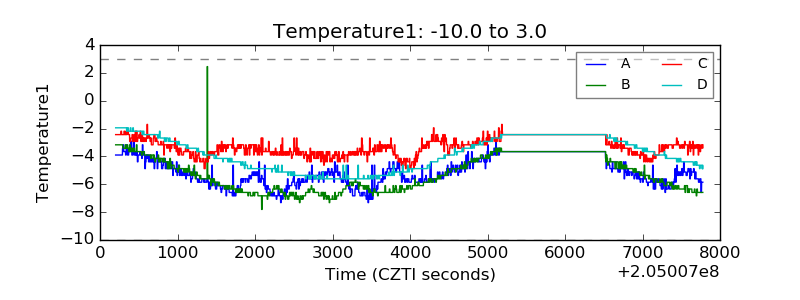 |
| Veto HV Monitor | 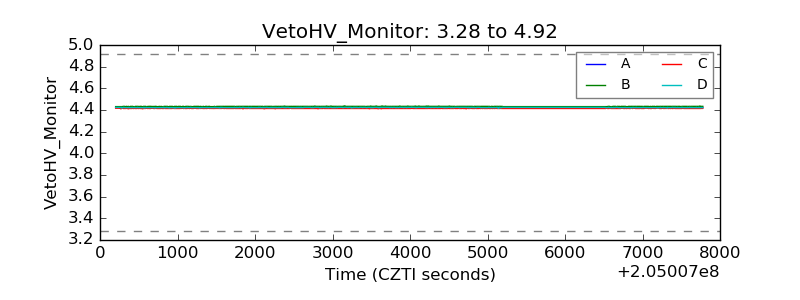 |
| Veto LLD | 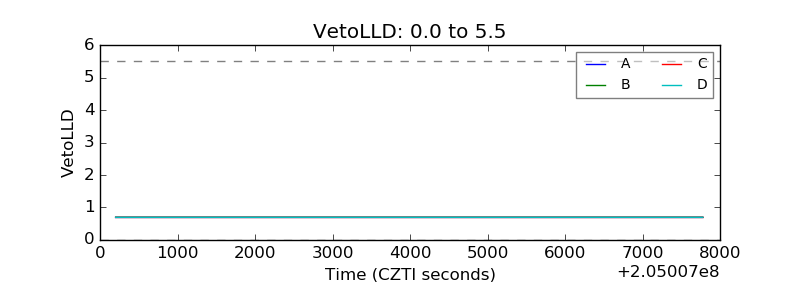 |
| Alpha Counter | 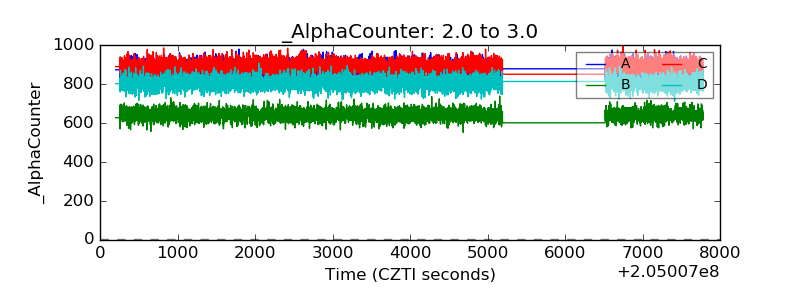 |
| _CPM_Rate | 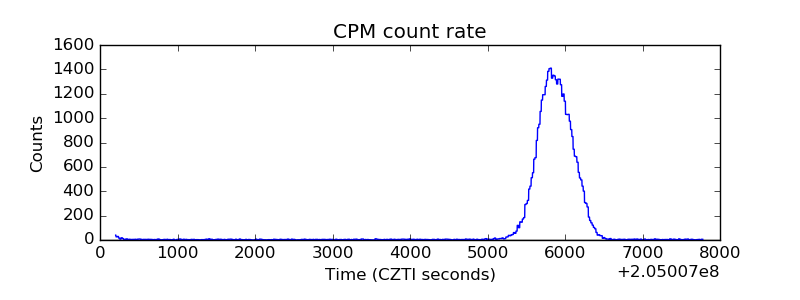 |
| CZT Counter | 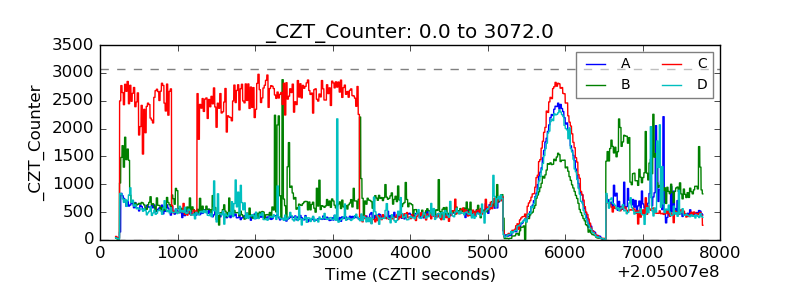 |
| +2.5 Volts monitor | 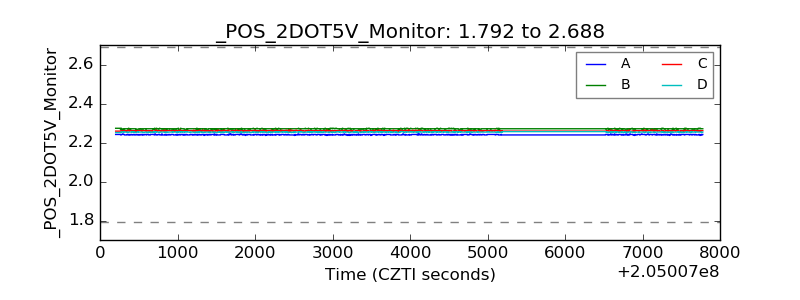 |
| +5 Volts monitor | 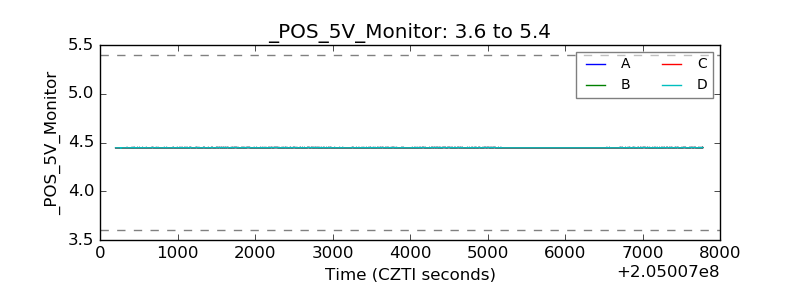 |
| _ROLL_ROT | 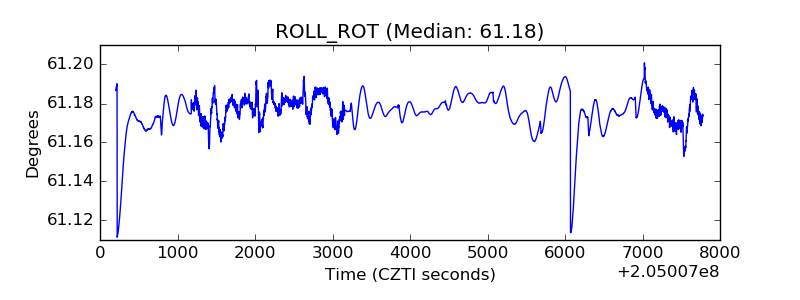 |
| _Roll_DEC | 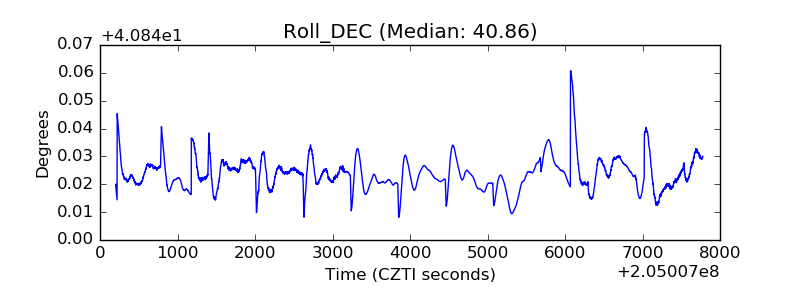 |
| _Roll_RA | 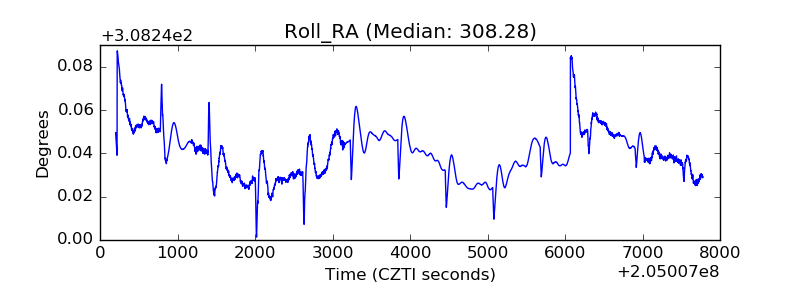 |
| Veto Counter | 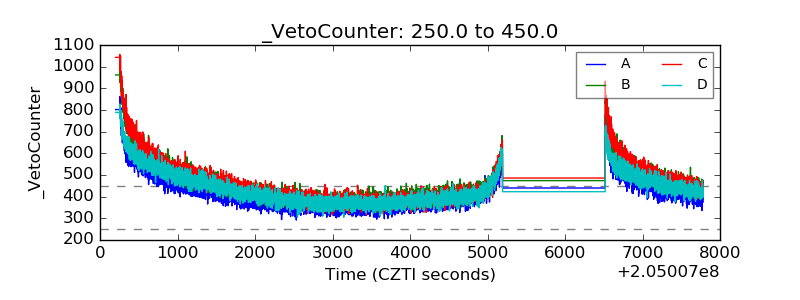 |