| Param | Original file | Final file |
|---|---|---|
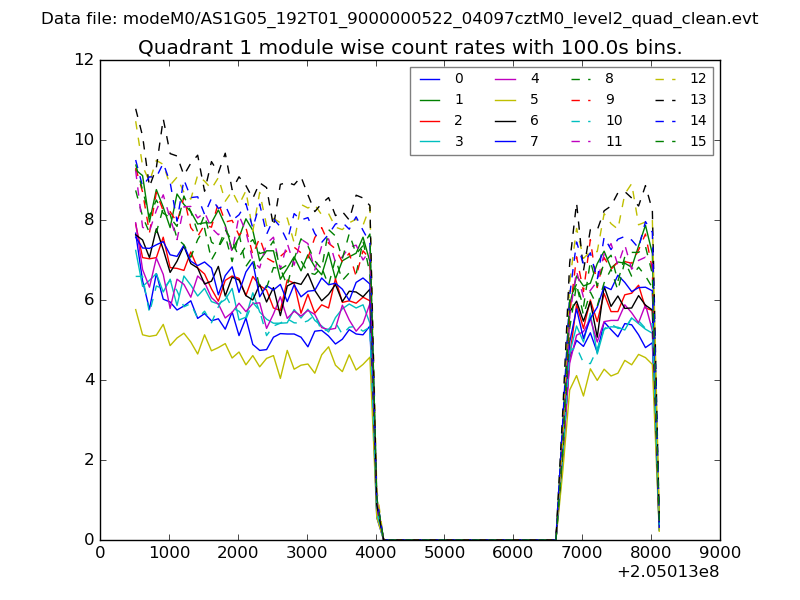
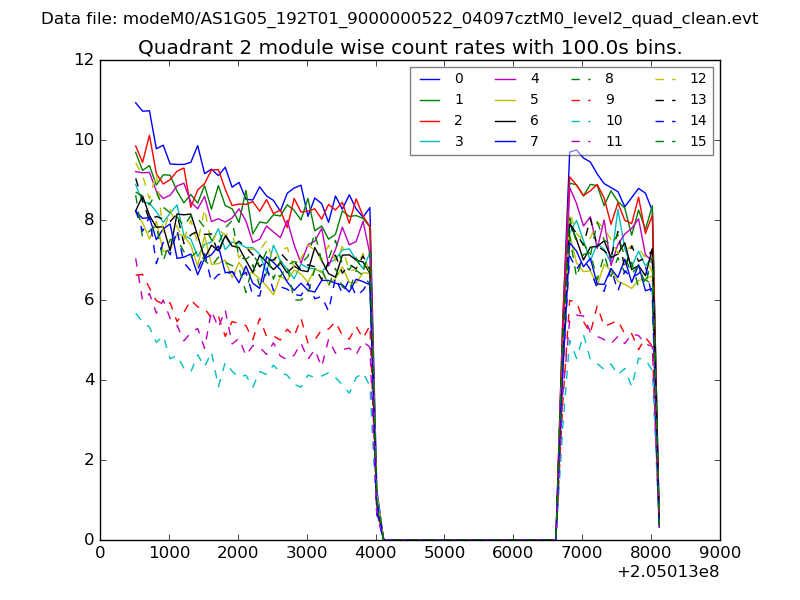
| Filename | modeM0/AS1G05_192T01_9000000522_04097cztM0_level2.evt | modeM0/AS1G05_192T01_9000000522_04097cztM0_level2_quad_clean.evt |
| Size (bytes) | 517,055,040 | 85,512,960 |
| Size | 493.1 MB | 81.6 MB |
| Events in quadrant A | 3,198,881 | 545,615 |
| Events in quadrant B | 6,039,368 | 522,002 |
| Events in quadrant C | 2,913,589 | 551,002 |
| Events in quadrant D | 3,076,429 | 527,589 |
| Mode SS | |||
|---|---|---|---|
| Quadrant | BADHDUFLAG | Total packets | Discarded packets |
| A | 0 | 130 | 0 |
| B | 0 | 130 | 0 |
| C | 0 | 130 | 0 |
| D | 0 | 130 | 0 |
| Mode M0 | |||
|---|---|---|---|
| Quadrant | BADHDUFLAG | Total packets | Discarded packets |
| A | 0 | 14050 | 3 |
| B | 0 | 22378 | 2 |
| C | 0 | 13042 | 2 |
| D | 0 | 13827 | 2 |
| Mode M9 | |||
|---|---|---|---|
| Quadrant | BADHDUFLAG | Total packets | Discarded packets |
| A | 0 | 23 | 0 |
| B | 0 | 23 | 0 |
| C | 0 | 23 | 0 |
| D | 0 | 24 | 0 |
| Quadrant | Total seconds | Saturated seconds | Saturation percentage |
|---|---|---|---|
| A | 6346 | 57 | 0.898204% |
| B | 6346 | 691 | 10.888749% |
| C | 6346 | 16 | 0.252127% |
| D | 6346 | 59 | 0.929720% |
Noise dominated data is calculated using 1-second bins in cleaned event files. If a bin has >2000 counts, and if more than 50% of those come from <1% of pixels, then it is considered to be noise-dominated and hence unusable.
| Quadrant | # 1 sec bins | Bins with >0 counts | Bins with >2000 counts | High rate bins dominated by noise | Noise dominated (total time) | Noise dominated (detector-on time) | Marked lightcurve |
|---|---|---|---|---|---|---|---|
| A | 7606 | 6347 | 20 | 20 | 0.26% | 0.32% | 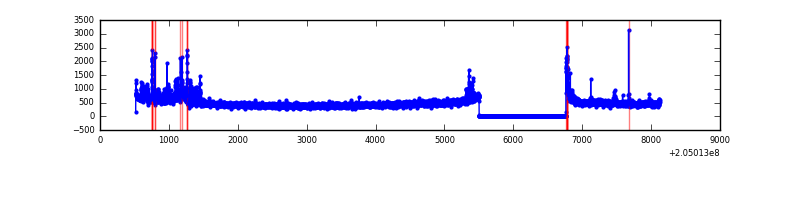 |
| B | 7606 | 6347 | 448 | 448 | 5.89% | 7.06% | 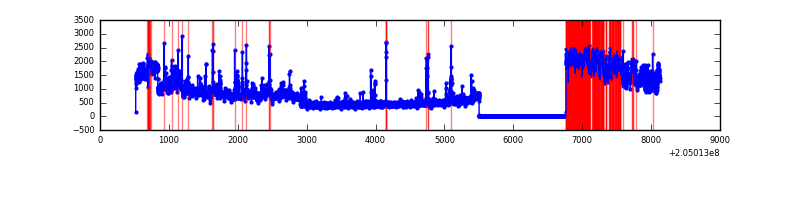 |
| C | 7606 | 6347 | 0 | 0 | 0.00% | 0.00% | 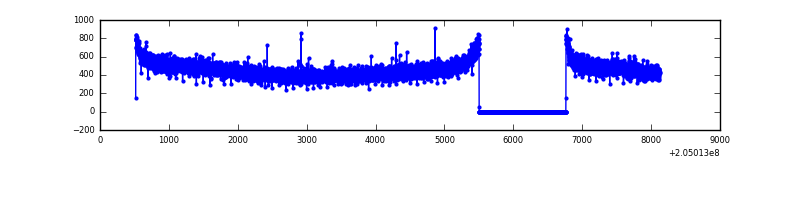 |
| D | 7606 | 6347 | 46 | 46 | 0.60% | 0.72% | 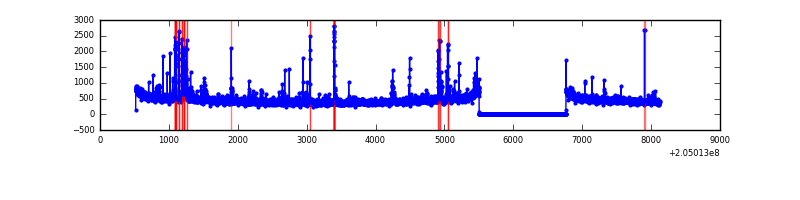 |
Top three noisy pixels from each quadrant. If the there are fewer than three noisy pixels in the level2.evt file, extra rows are filled as -1
| Pixel properties | Quadrant properties | ||||||
|---|---|---|---|---|---|---|---|
| Quadrant | DetID | PixID | Counts | Sigma | Mean | Median | Sigma |
| A | 0 | 199 | 240848 | 1579.97 | 745 | 729 | 152.0 |
| A | 14 | 111 | 32841 | 211.29 | 745 | 729 | 152.0 |
| A | 0 | 50 | 30449 | 195.55 | 745 | 729 | 152.0 |
| B | 3 | 0 | 2902915 | 20729.92 | 741 | 725 | 140.0 |
| B | 10 | 16 | 136122 | 967.12 | 741 | 725 | 140.0 |
| B | 14 | 167 | 53364 | 375.99 | 741 | 725 | 140.0 |
| C | 14 | 67 | 12013 | 65.21 | 741 | 744 | 172.8 |
| C | 13 | 61 | 6144 | 31.25 | 741 | 744 | 172.8 |
| C | 9 | 144 | 4905 | 24.08 | 741 | 744 | 172.8 |
| D | 10 | 172 | 193761 | 1089.86 | 726 | 703 | 177.1 |
| D | 13 | 239 | 64831 | 362.02 | 726 | 703 | 177.1 |
| D | 2 | 14 | 32772 | 181.03 | 726 | 703 | 177.1 |
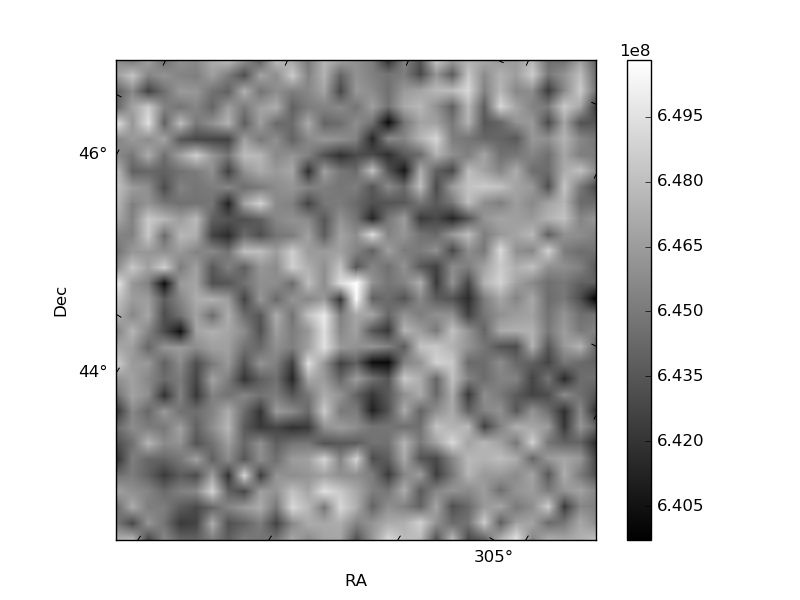
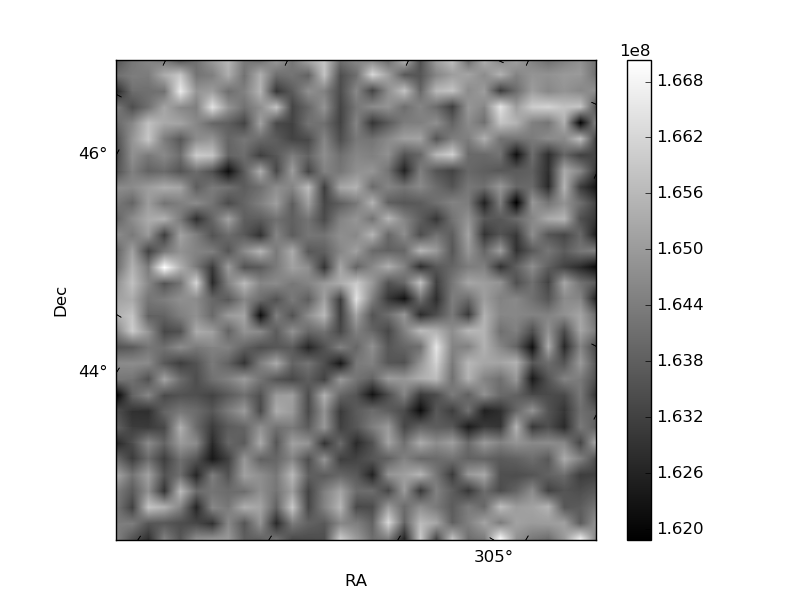
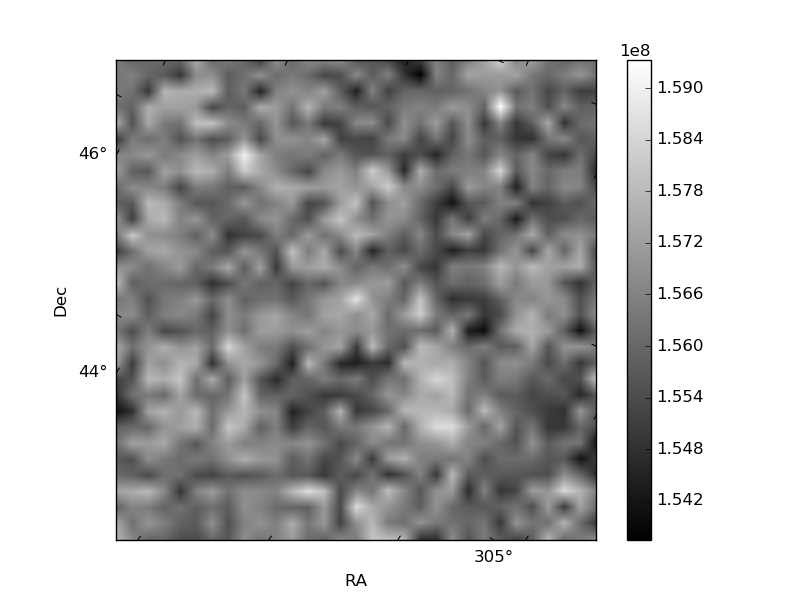
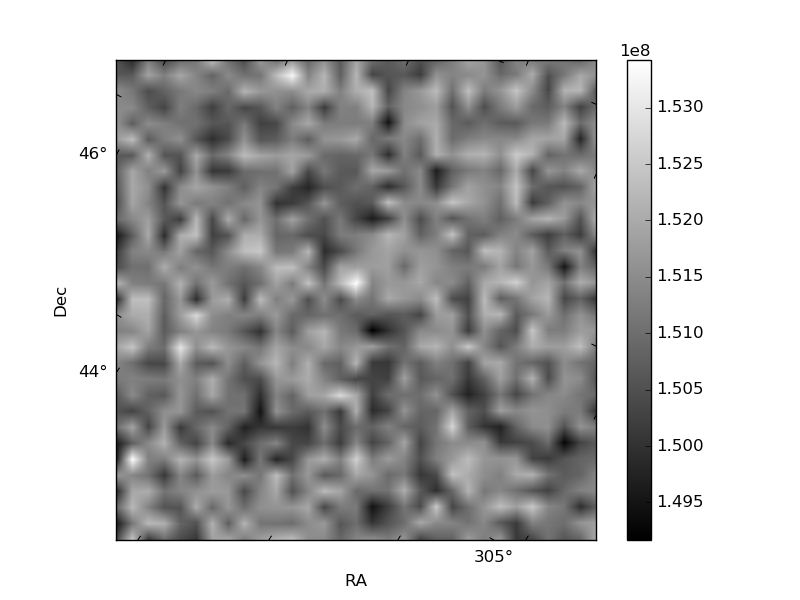
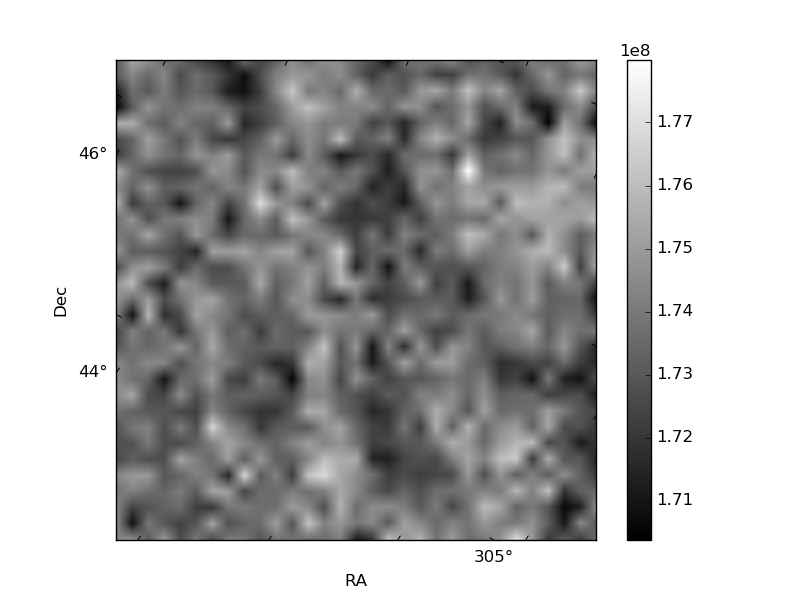
Histogram calculated using DETX and DETY for each event in the final _common_clean file
| Quadrant A | 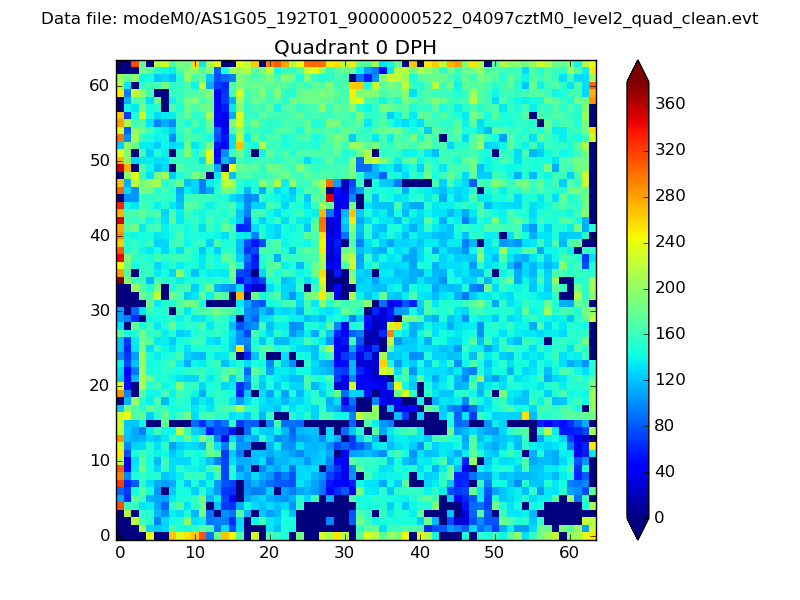 |
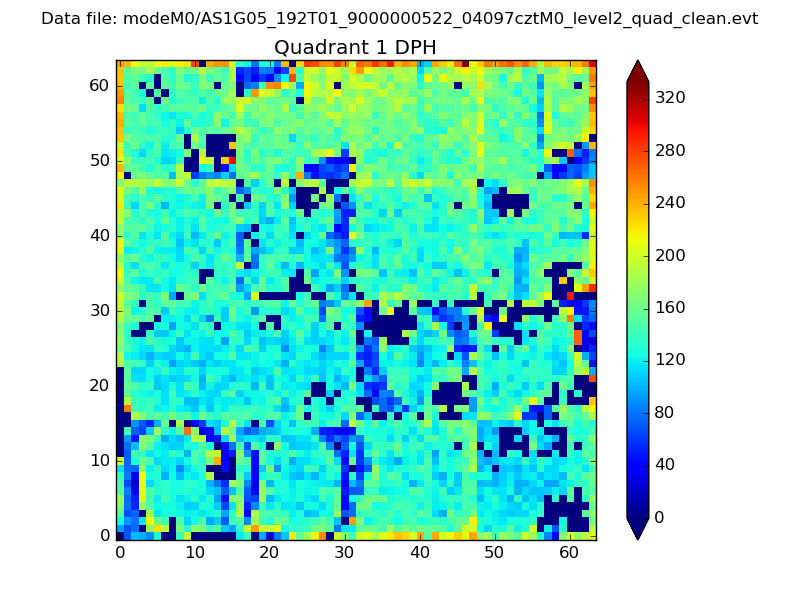 |
Quadrant B |
|---|---|---|---|
| Quadrant D | 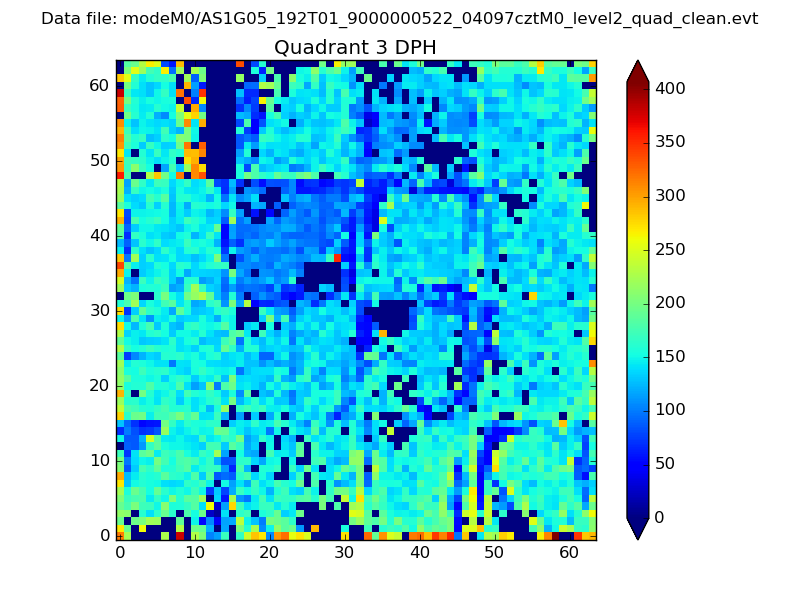 |
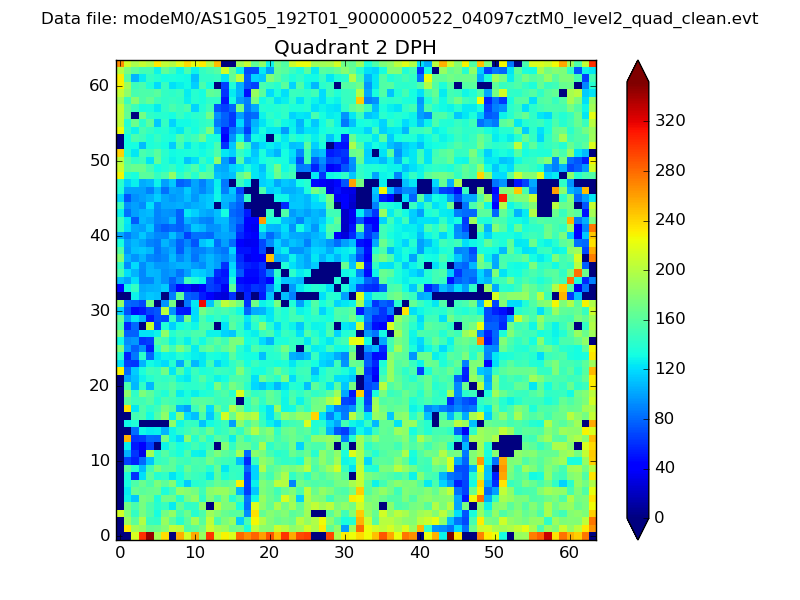 |
Quadrant C |
| Plot type | Count rate plots | Images |
|---|---|---|
| Comparison with Poisson distribution Blue bars denote a histogram of data divided into 1 sec bins. Red curve is a Poisson curve with rate = median count rate of data. |
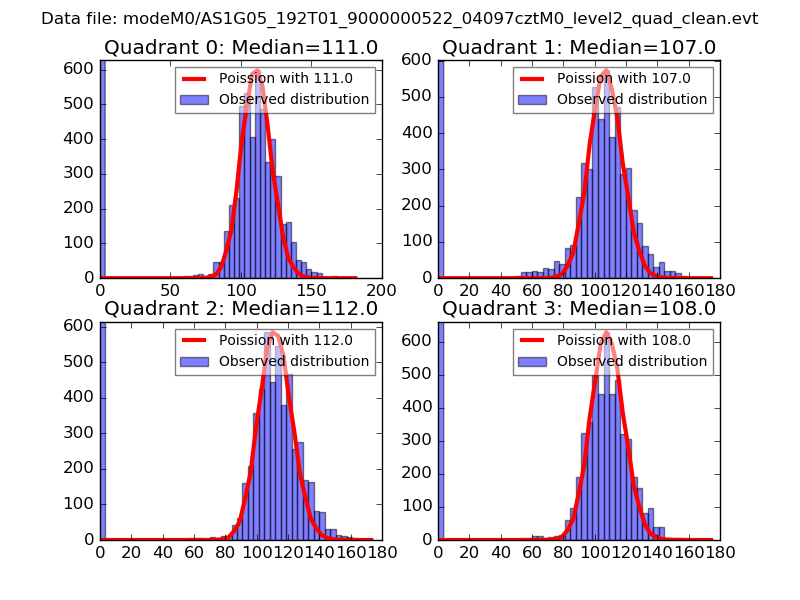 |
 |
| Quadrant-wise count rates Data is divided into 100 sec bins |
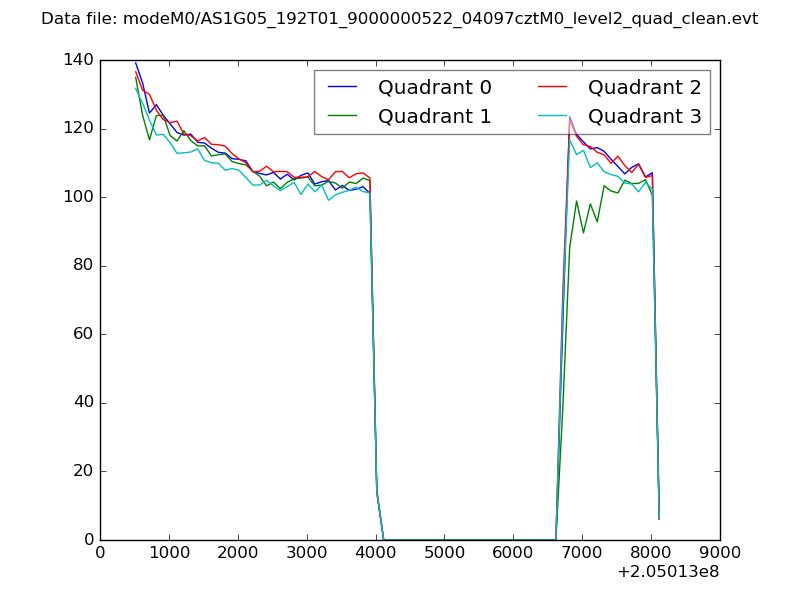 |
|
| Module-wise count rates for Quadrant A Data is divided into 100 sec bins |
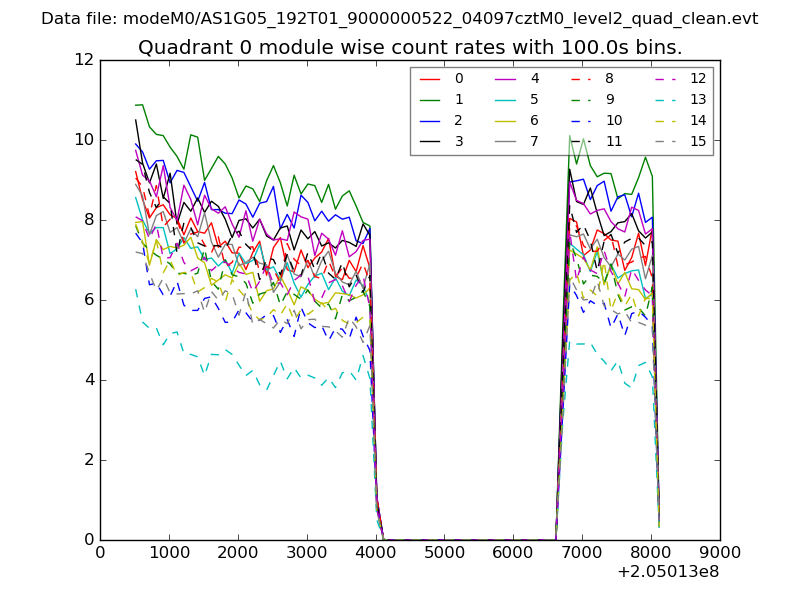 |
 |
| Module-wise count rates for Quadrant B Data is divided into 100 sec bins |
 |
 |
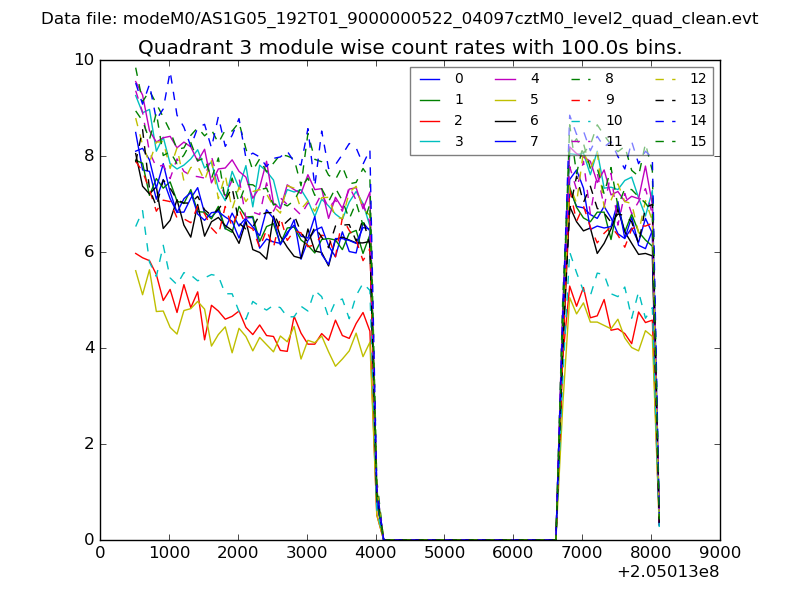
| Module-wise count rates for Quadrant C Data is divided into 100 sec bins |
 |
 |
| Module-wise count rates for Quadrant D Data is divided into 100 sec bins |
 |
 |
| Parameter | Plot |
|---|---|
| CZT HV Monitor | 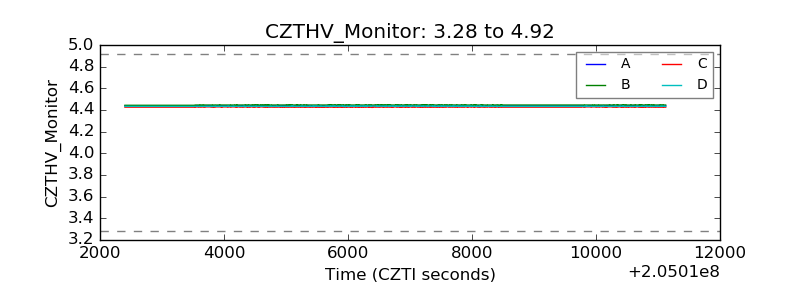 |
| D_VDD | 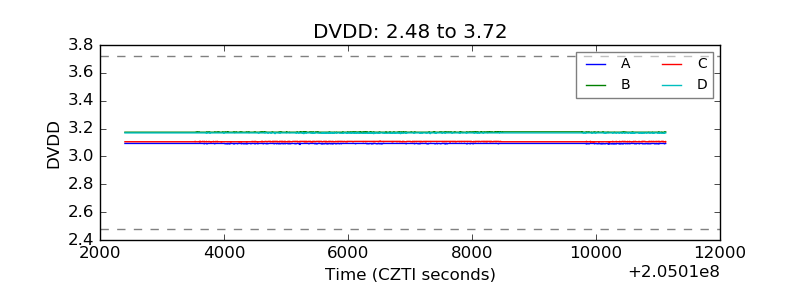 |
| Temperature 1 | 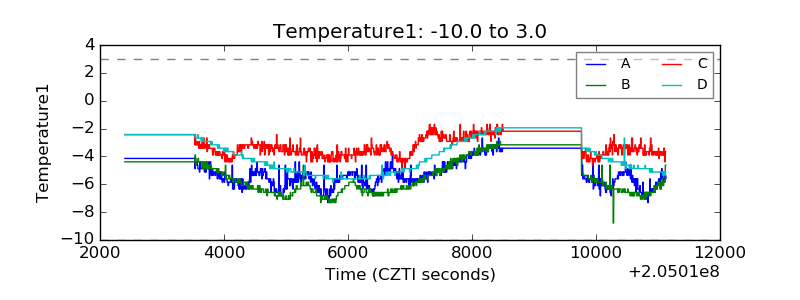 |
| Veto HV Monitor | 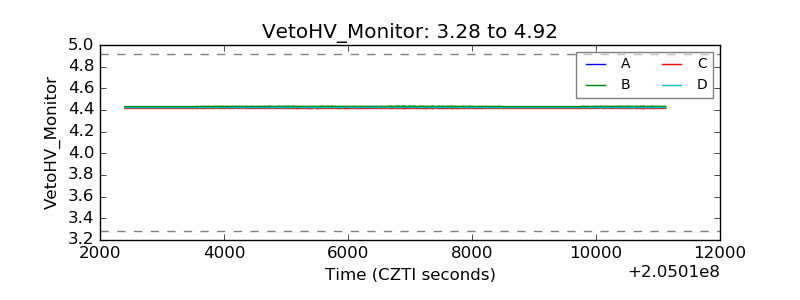 |
| Veto LLD | 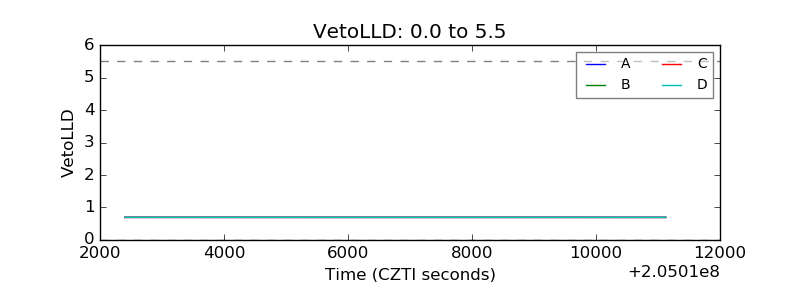 |
| Alpha Counter | 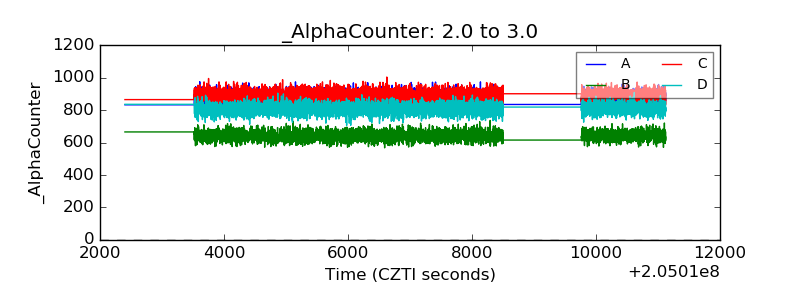 |
| _CPM_Rate | 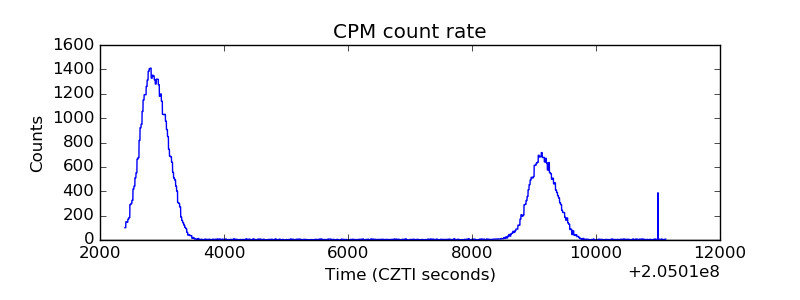 |
| CZT Counter | 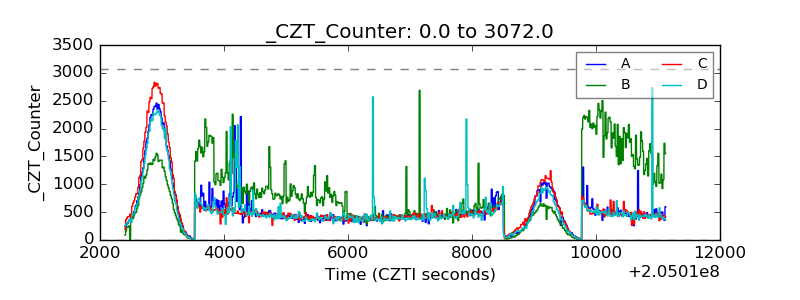 |
| +2.5 Volts monitor | 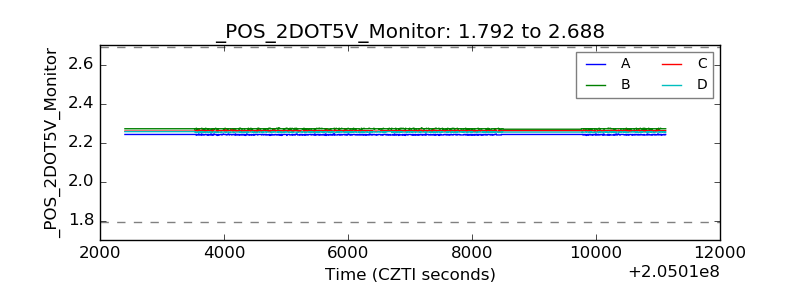 |
| +5 Volts monitor | 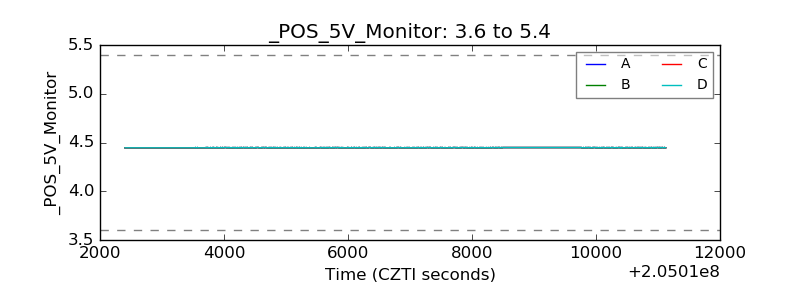 |
| _ROLL_ROT | 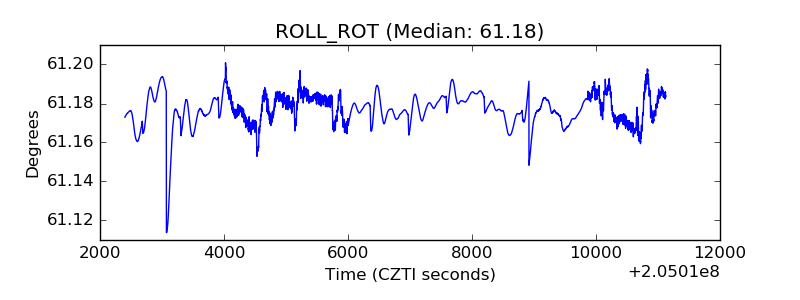 |
| _Roll_DEC | 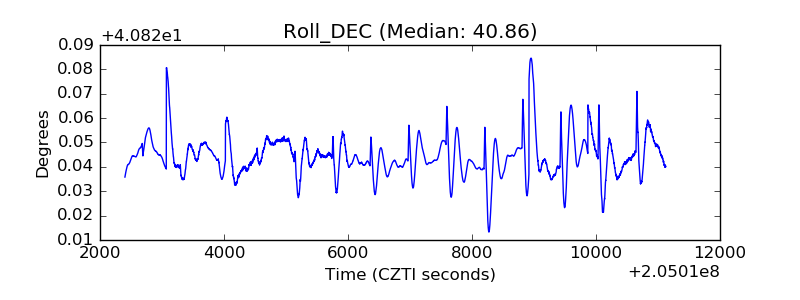 |
| _Roll_RA | 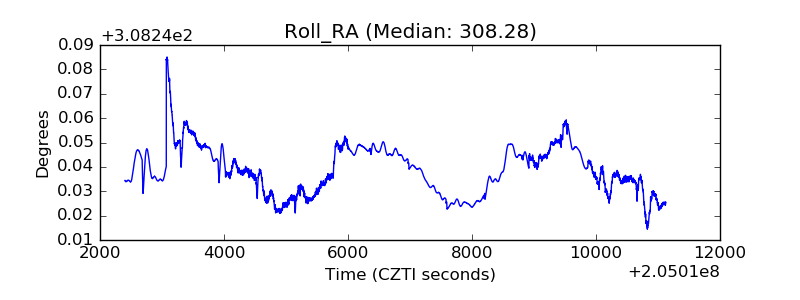 |
| Veto Counter | 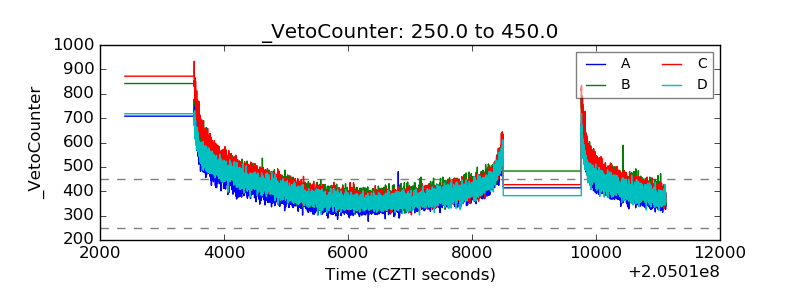 |