| Param | Original file | Final file |
|---|---|---|
| Filename | modeM0/AS1G05_192T01_9000000522_04098cztM0_level2.evt | modeM0/AS1G05_192T01_9000000522_04098cztM0_level2_quad_clean.evt |
| Size (bytes) | 491,495,040 | 69,816,960 |
| Size | 468.7 MB | 66.6 MB |
| Events in quadrant A | 3,104,103 | 428,894 |
| Events in quadrant B | 5,746,447 | 408,287 |
| Events in quadrant C | 2,762,154 | 433,501 |
| Events in quadrant D | 2,857,606 | 416,329 |
| Mode SS | |||
|---|---|---|---|
| Quadrant | BADHDUFLAG | Total packets | Discarded packets |
| A | 0 | 124 | 0 |
| B | 0 | 124 | 0 |
| C | 0 | 124 | 0 |
| D | 0 | 124 | 0 |
| Mode M0 | |||
|---|---|---|---|
| Quadrant | BADHDUFLAG | Total packets | Discarded packets |
| A | 0 | 13363 | 2 |
| B | 0 | 21479 | 2 |
| C | 0 | 12634 | 2 |
| D | 0 | 13117 | 2 |
| Mode M9 | |||
|---|---|---|---|
| Quadrant | BADHDUFLAG | Total packets | Discarded packets |
| A | 0 | 15 | 0 |
| B | 0 | 15 | 0 |
| C | 0 | 15 | 0 |
| D | 0 | 16 | 0 |
| Quadrant | Total seconds | Saturated seconds | Saturation percentage |
|---|---|---|---|
| A | 6111 | 74 | 1.210931% |
| B | 6111 | 593 | 9.703813% |
| C | 6111 | 20 | 0.327279% |
| D | 6111 | 47 | 0.769105% |
Noise dominated data is calculated using 1-second bins in cleaned event files. If a bin has >2000 counts, and if more than 50% of those come from <1% of pixels, then it is considered to be noise-dominated and hence unusable.
| Quadrant | # 1 sec bins | Bins with >0 counts | Bins with >2000 counts | High rate bins dominated by noise | Noise dominated (total time) | Noise dominated (detector-on time) | Marked lightcurve |
|---|---|---|---|---|---|---|---|
| A | 7136 | 6112 | 23 | 23 | 0.32% | 0.38% | 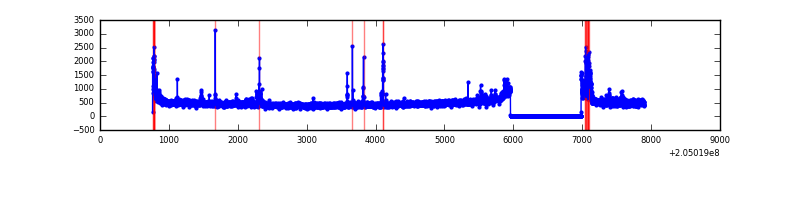 |
| B | 7136 | 6111 | 420 | 420 | 5.89% | 6.87% | 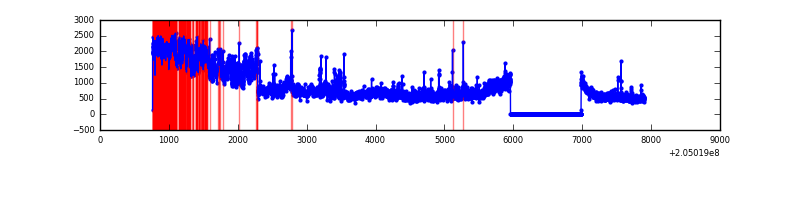 |
| C | 7136 | 6112 | 1 | 1 | 0.01% | 0.02% | 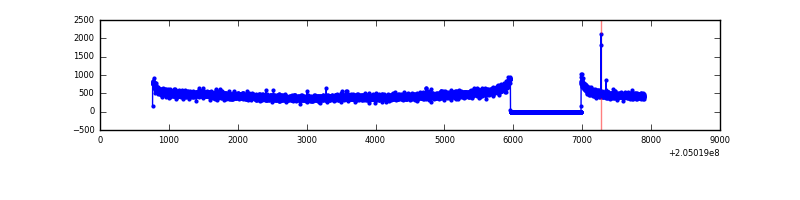 |
| D | 7136 | 6112 | 34 | 34 | 0.48% | 0.56% | 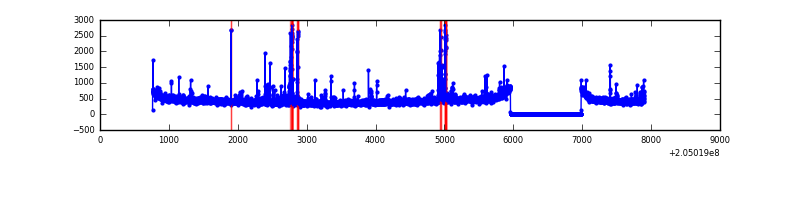 |
Top three noisy pixels from each quadrant. If the there are fewer than three noisy pixels in the level2.evt file, extra rows are filled as -1
| Pixel properties | Quadrant properties | ||||||
|---|---|---|---|---|---|---|---|
| Quadrant | DetID | PixID | Counts | Sigma | Mean | Median | Sigma |
| A | 0 | 199 | 278336 | 1923.92 | 706 | 692 | 144.3 |
| A | 0 | 50 | 36892 | 250.85 | 706 | 692 | 144.3 |
| A | 13 | 14 | 33330 | 226.16 | 706 | 692 | 144.3 |
| B | 3 | 0 | 2849121 | 21129.5 | 703 | 688 | 134.8 |
| B | 10 | 16 | 110314 | 813.2 | 703 | 688 | 134.8 |
| B | 15 | 204 | 15308 | 108.45 | 703 | 688 | 134.8 |
| C | 10 | 65 | 23053 | 137.29 | 696 | 700 | 162.8 |
| C | 14 | 67 | 11324 | 65.25 | 696 | 700 | 162.8 |
| C | 9 | 144 | 6006 | 32.59 | 696 | 700 | 162.8 |
| D | 13 | 239 | 76543 | 455.21 | 688 | 669 | 166.7 |
| D | 12 | 233 | 60932 | 361.55 | 688 | 669 | 166.7 |
| D | 13 | 223 | 35034 | 206.18 | 688 | 669 | 166.7 |
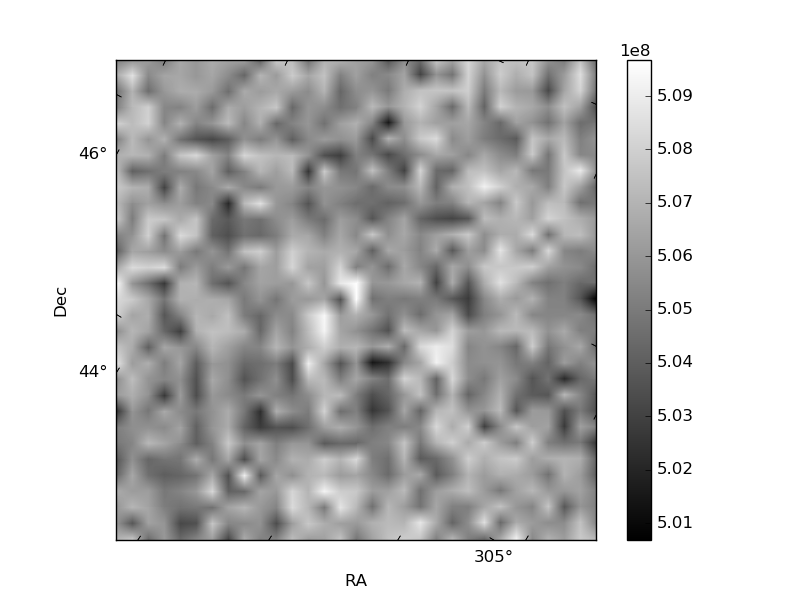
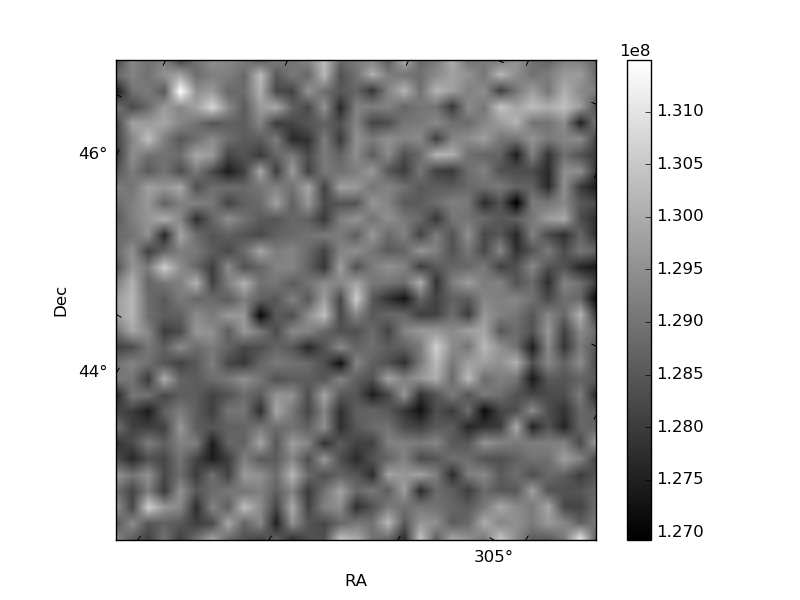
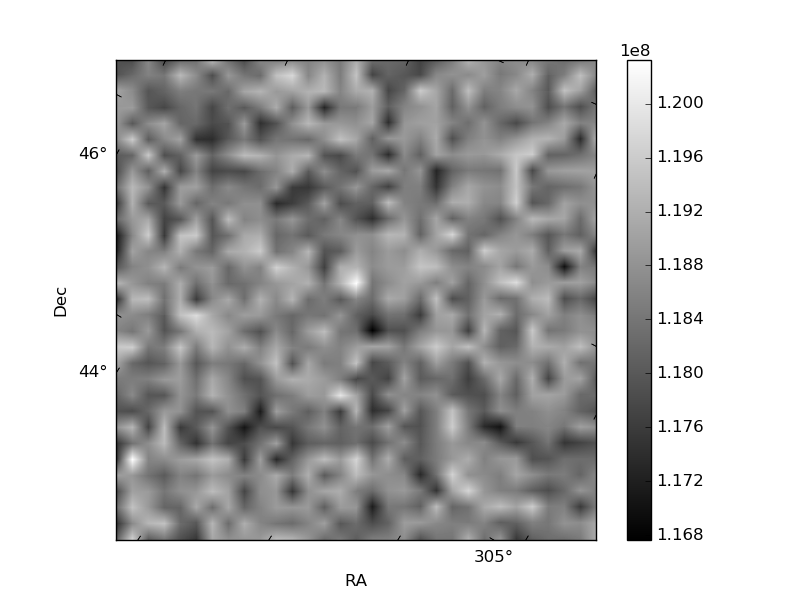
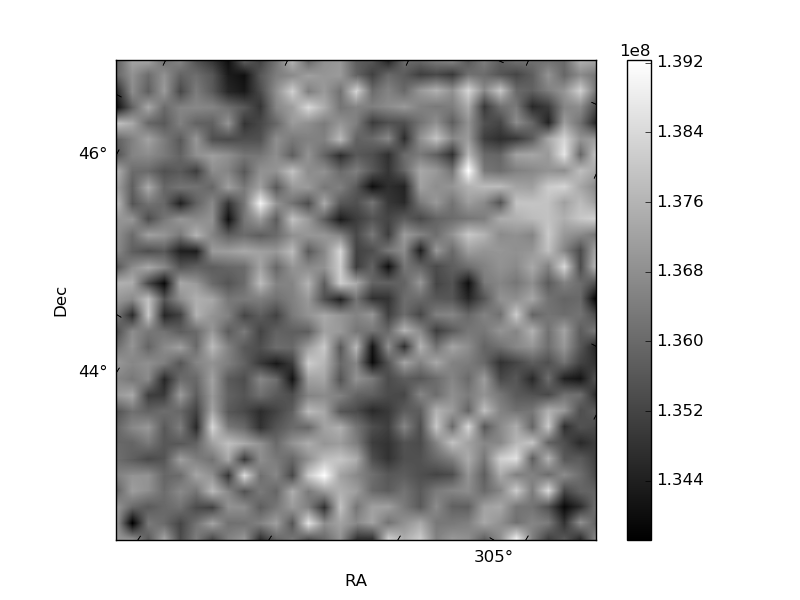
Histogram calculated using DETX and DETY for each event in the final _common_clean file
| Quadrant A | 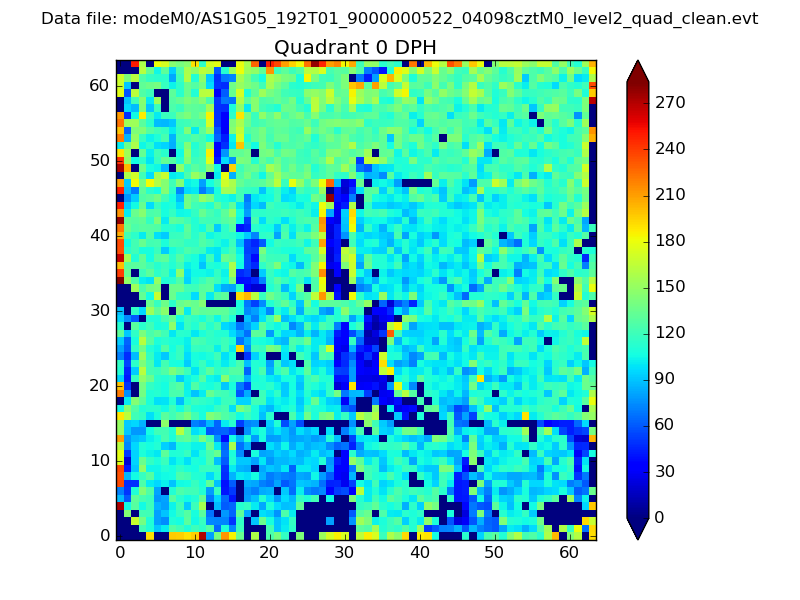 |
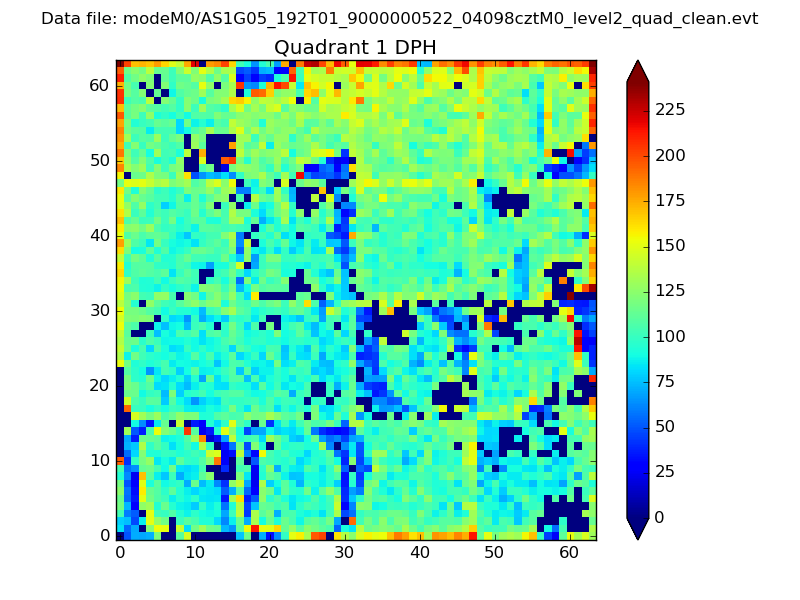 |
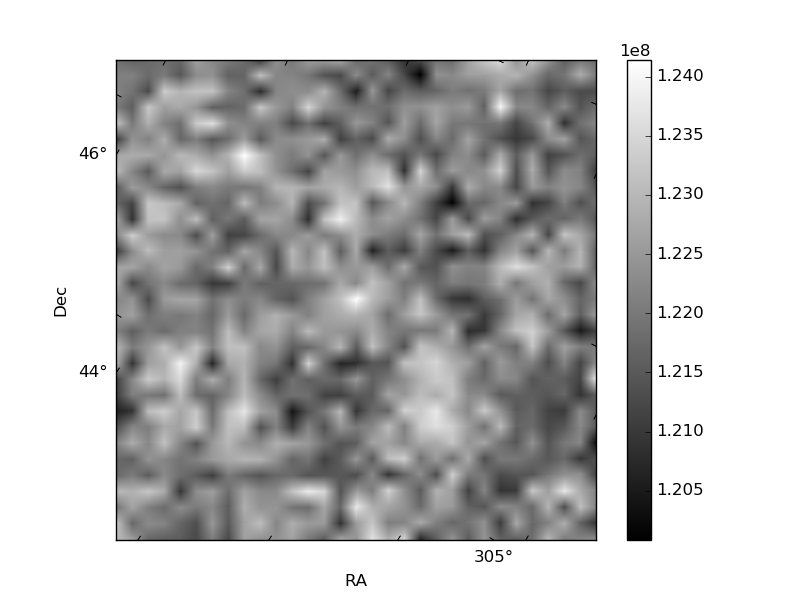
Quadrant B |
|---|---|---|---|
| Quadrant D | 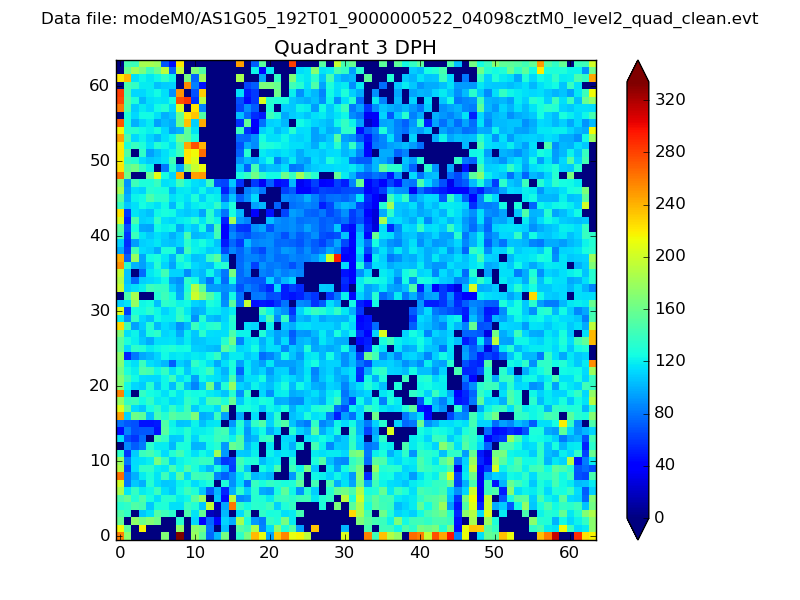 |
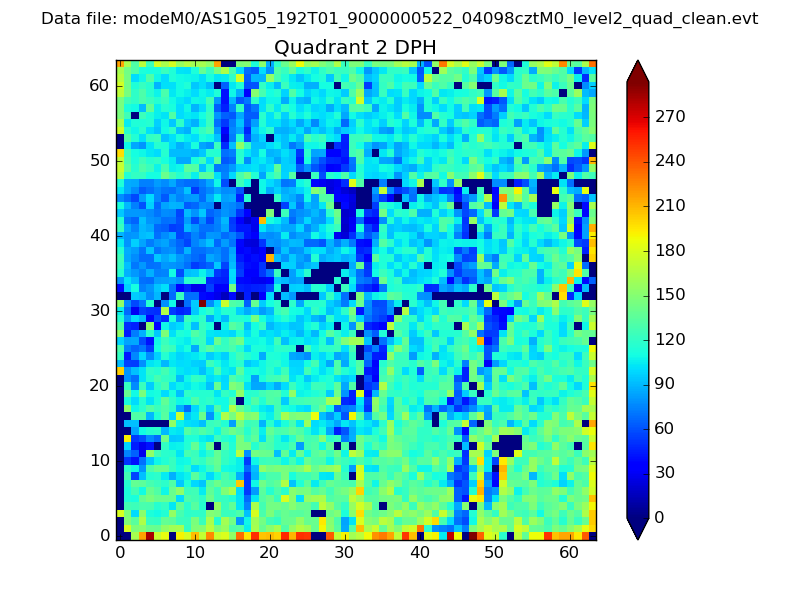 |
Quadrant C |
| Plot type | Count rate plots | Images |
|---|---|---|
| Comparison with Poisson distribution Blue bars denote a histogram of data divided into 1 sec bins. Red curve is a Poisson curve with rate = median count rate of data. |
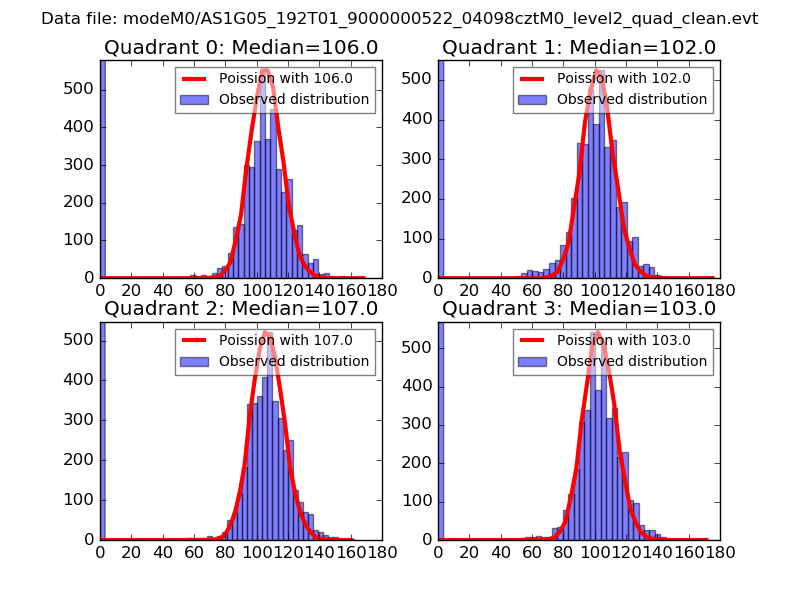 |
 |
| Quadrant-wise count rates Data is divided into 100 sec bins |
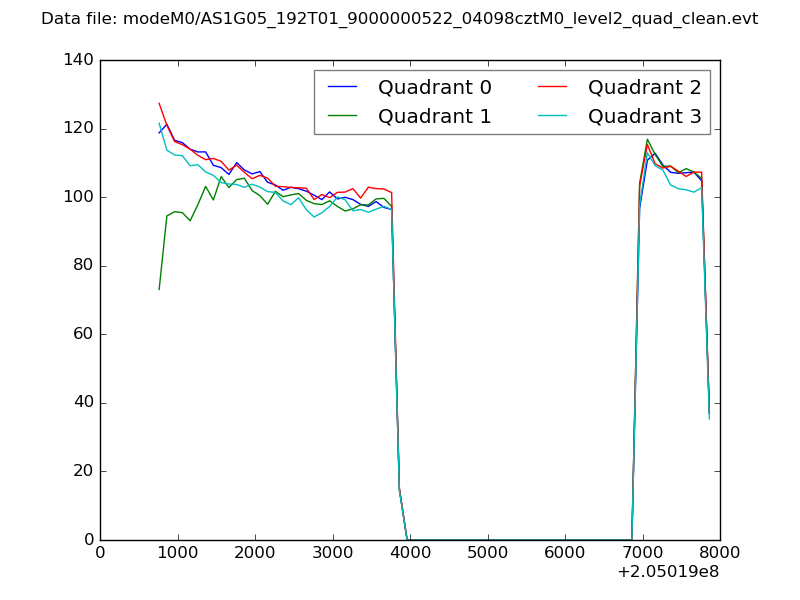 |
|
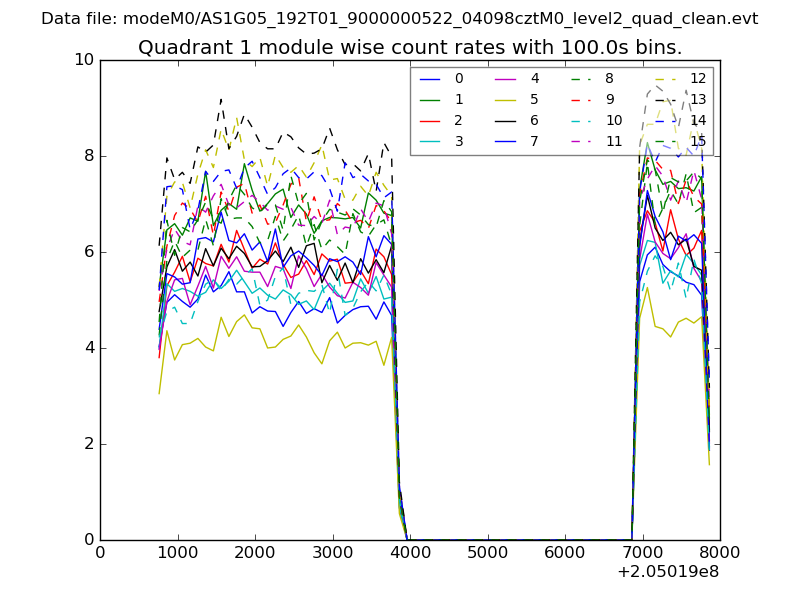
| Module-wise count rates for Quadrant A Data is divided into 100 sec bins |
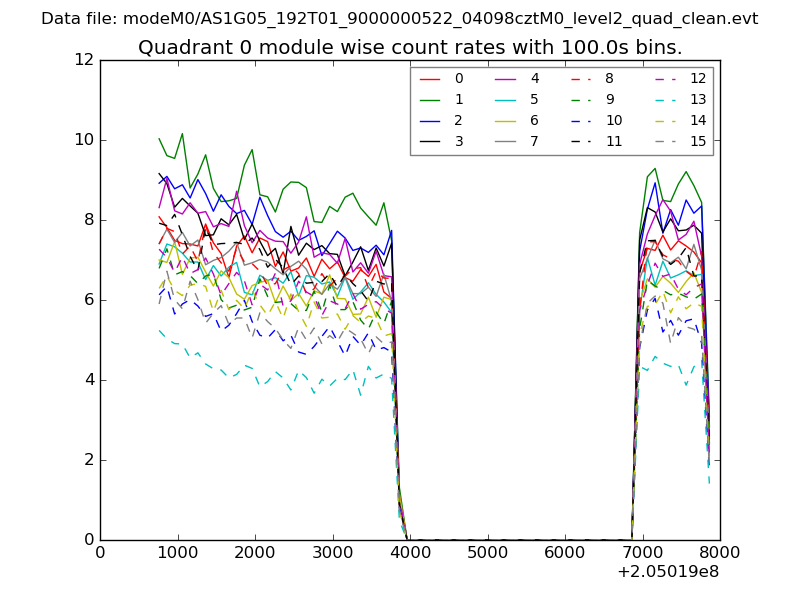 |
 |
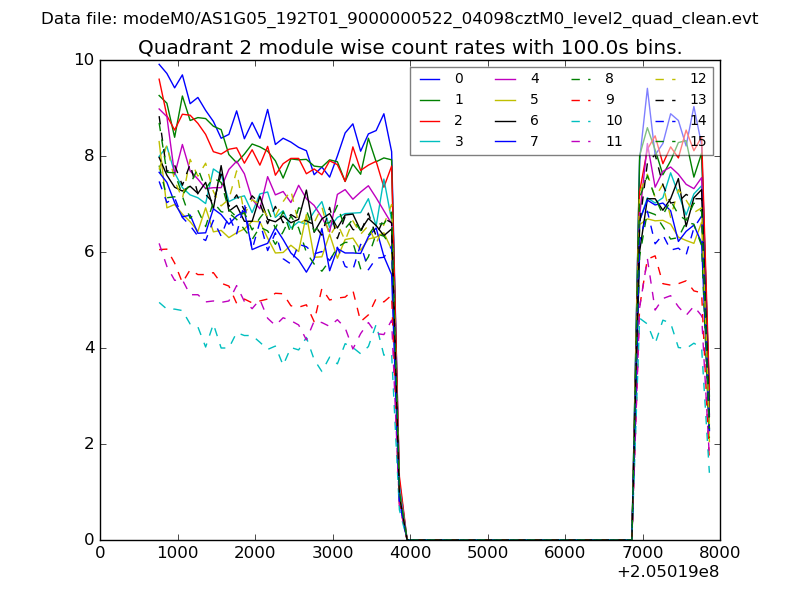
| Module-wise count rates for Quadrant B Data is divided into 100 sec bins |
 |
 |
| Module-wise count rates for Quadrant C Data is divided into 100 sec bins |
 |
 |
| Module-wise count rates for Quadrant D Data is divided into 100 sec bins |
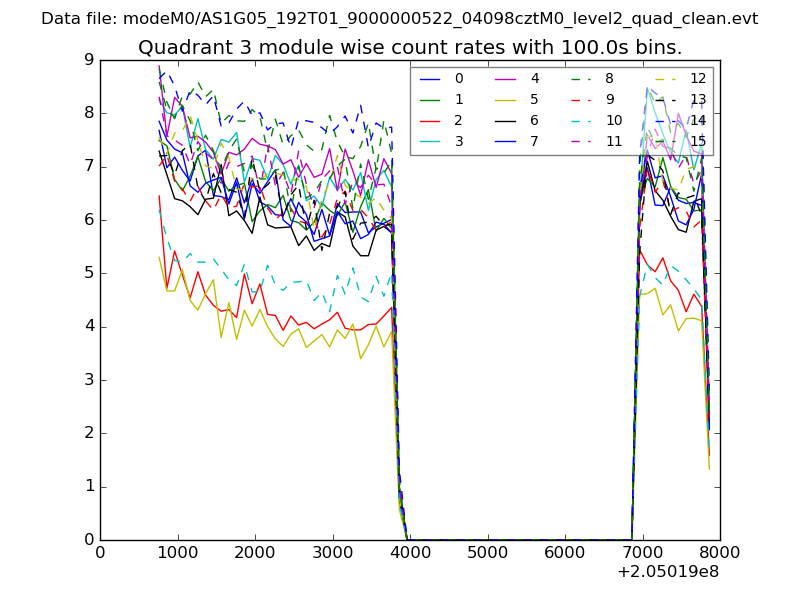 |
 |
| Parameter | Plot |
|---|---|
| CZT HV Monitor | 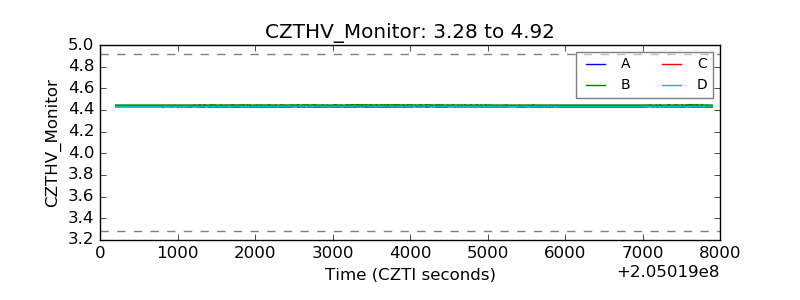 |
| D_VDD | 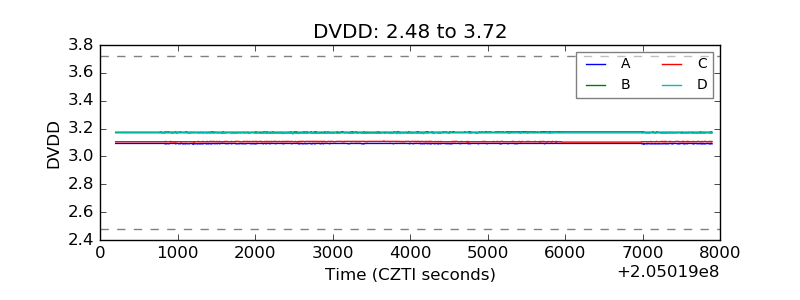 |
| Temperature 1 | 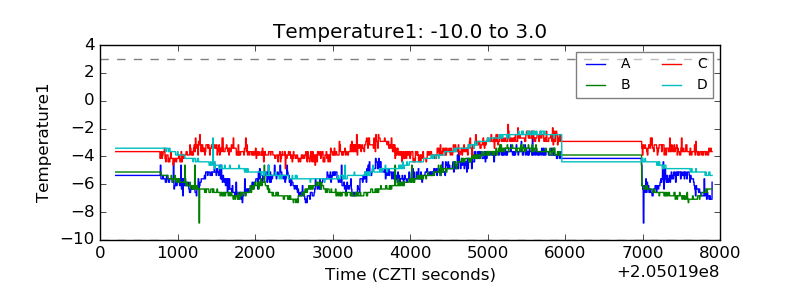 |
| Veto HV Monitor | 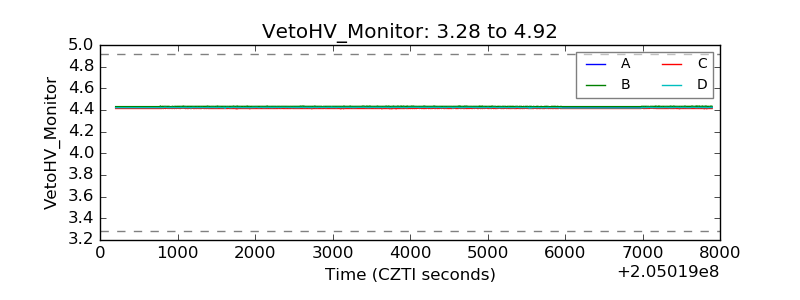 |
| Veto LLD | 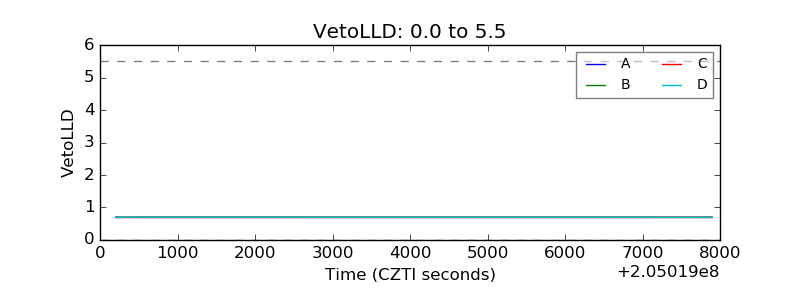 |
| Alpha Counter | 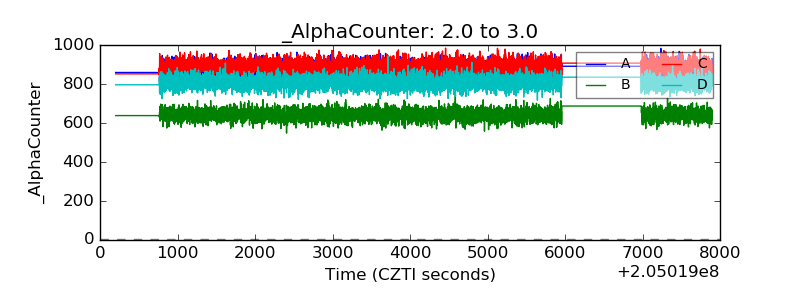 |
| _CPM_Rate | 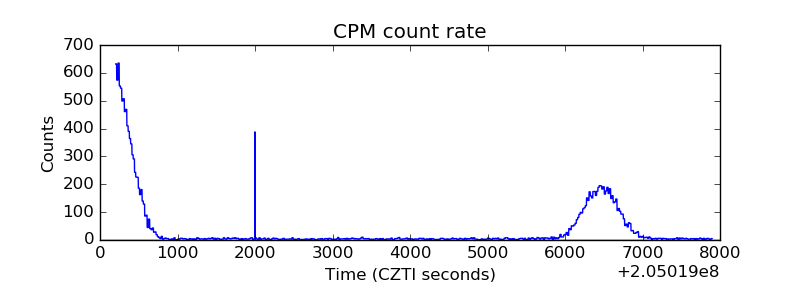 |
| CZT Counter | 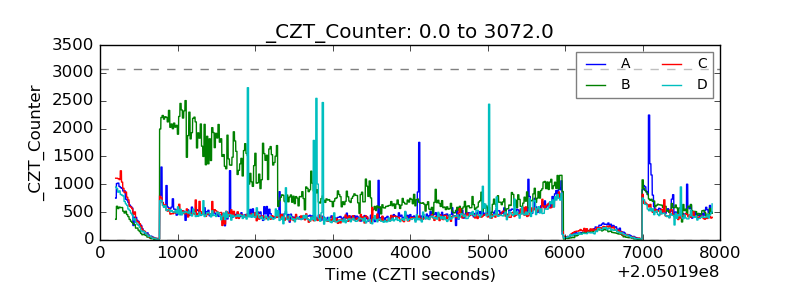 |
| +2.5 Volts monitor |  |
| +5 Volts monitor |  |
| _ROLL_ROT | 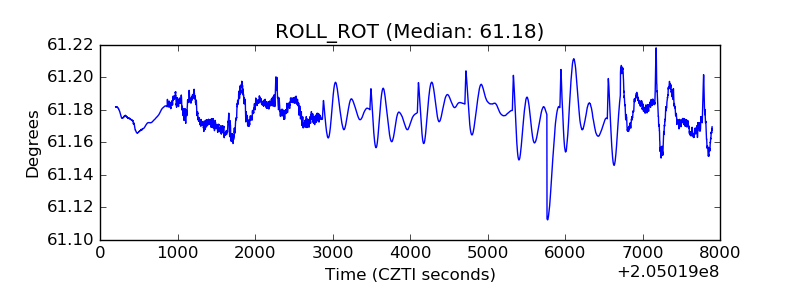 |
| _Roll_DEC |  |
| _Roll_RA | 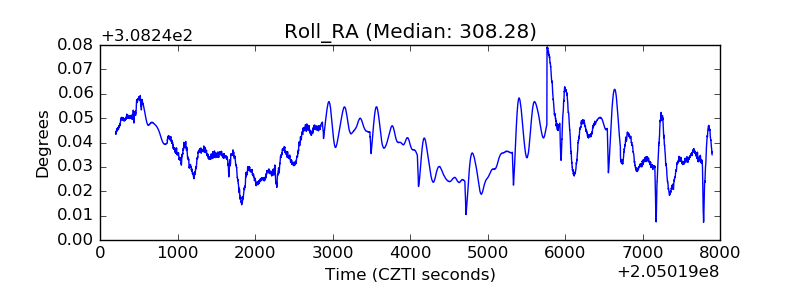 |
| Veto Counter | 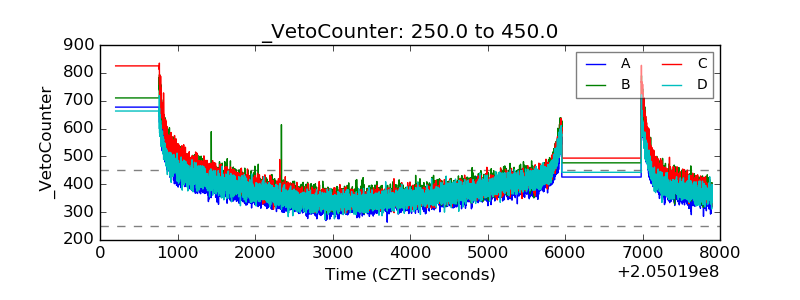 |