| Param | Original file | Final file |
|---|---|---|
| Filename | modeM0/AS1G05_192T01_9000000522_04099cztM0_level2.evt | modeM0/AS1G05_192T01_9000000522_04099cztM0_level2_quad_clean.evt |
| Size (bytes) | 68,103,360 | 15,618,240 |
| Size | 64.9 MB | 14.9 MB |
| Events in quadrant A | 565,373 | 100,241 |
| Events in quadrant B | 548,760 | 101,685 |
| Events in quadrant C | 445,689 | 100,979 |
| Events in quadrant D | 437,216 | 98,165 |
| Mode SS | |||
|---|---|---|---|
| Quadrant | BADHDUFLAG | Total packets | Discarded packets |
| A | 0 | 18 | 0 |
| B | 0 | 18 | 0 |
| C | 0 | 18 | 0 |
| D | 0 | 18 | 0 |
| Mode M0 | |||
|---|---|---|---|
| Quadrant | BADHDUFLAG | Total packets | Discarded packets |
| A | 0 | 2236 | 1 |
| B | 0 | 2190 | 1 |
| C | 0 | 1945 | 1 |
| D | 0 | 1957 | 1 |
| Mode M9 | |||
|---|---|---|---|
| Quadrant | BADHDUFLAG | Total packets | Discarded packets |
| A | 0 | 3 | 0 |
| B | 0 | 3 | 0 |
| C | 0 | 3 | 0 |
| D | 0 | 4 | 0 |
| Quadrant | Total seconds | Saturated seconds | Saturation percentage |
|---|---|---|---|
| A | 916 | 30 | 3.275109% |
| B | 916 | 18 | 1.965066% |
| C | 916 | 10 | 1.091703% |
| D | 916 | 3 | 0.327511% |
Noise dominated data is calculated using 1-second bins in cleaned event files. If a bin has >2000 counts, and if more than 50% of those come from <1% of pixels, then it is considered to be noise-dominated and hence unusable.
| Quadrant | # 1 sec bins | Bins with >0 counts | Bins with >2000 counts | High rate bins dominated by noise | Noise dominated (total time) | Noise dominated (detector-on time) | Marked lightcurve |
|---|---|---|---|---|---|---|---|
| A | 916 | 916 | 10 | 10 | 1.09% | 1.09% | 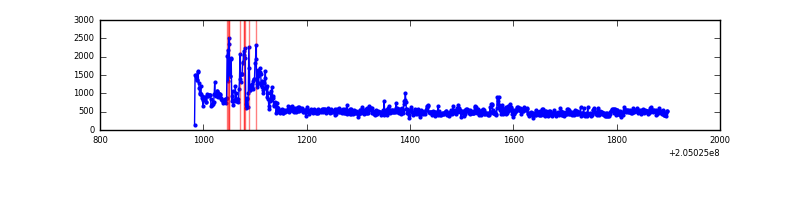 |
| B | 916 | 916 | 0 | 0 | 0.00% | 0.00% | 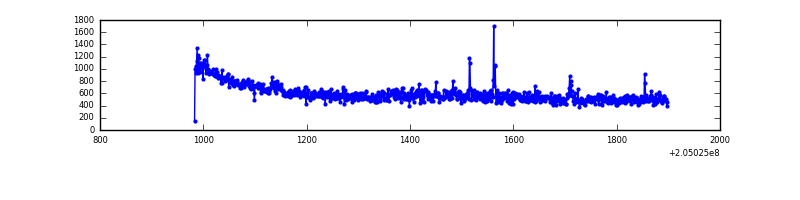 |
| C | 916 | 916 | 1 | 1 | 0.11% | 0.11% | 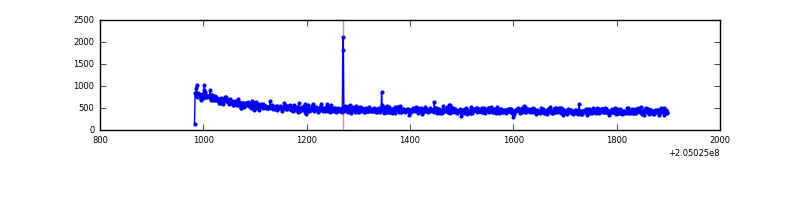 |
| D | 916 | 916 | 0 | 0 | 0.00% | 0.00% | 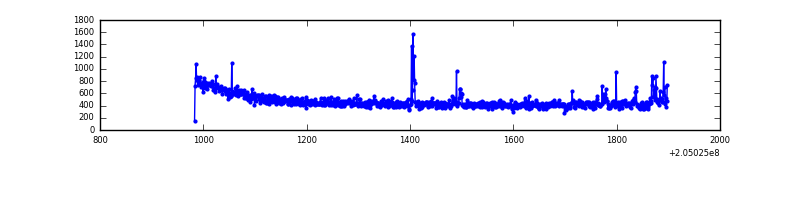 |
Top three noisy pixels from each quadrant. If the there are fewer than three noisy pixels in the level2.evt file, extra rows are filled as -1
| Pixel properties | Quadrant properties | ||||||
|---|---|---|---|---|---|---|---|
| Quadrant | DetID | PixID | Counts | Sigma | Mean | Median | Sigma |
| A | 0 | 199 | 127642 | 5099.68 | 110 | 107 | 25.0 |
| A | 0 | 226 | 12480 | 494.75 | 110 | 107 | 25.0 |
| A | 14 | 111 | 2235 | 85.09 | 110 | 107 | 25.0 |
| B | 3 | 0 | 90459 | 3730.96 | 114 | 111 | 24.2 |
| B | 10 | 16 | 8254 | 336.27 | 114 | 111 | 24.2 |
| B | 12 | 111 | 2029 | 79.2 | 114 | 111 | 24.2 |
| C | 9 | 144 | 3208 | 108.85 | 113 | 113 | 28.4 |
| C | 13 | 61 | 906 | 27.89 | 113 | 113 | 28.4 |
| C | 7 | 158 | 366 | 8.9 | 113 | 113 | 28.4 |
| D | 12 | 233 | 7156 | 248.3 | 110 | 106 | 28.4 |
| D | 13 | 72 | 4962 | 171.03 | 110 | 106 | 28.4 |
| D | 13 | 239 | 3769 | 129.01 | 110 | 106 | 28.4 |
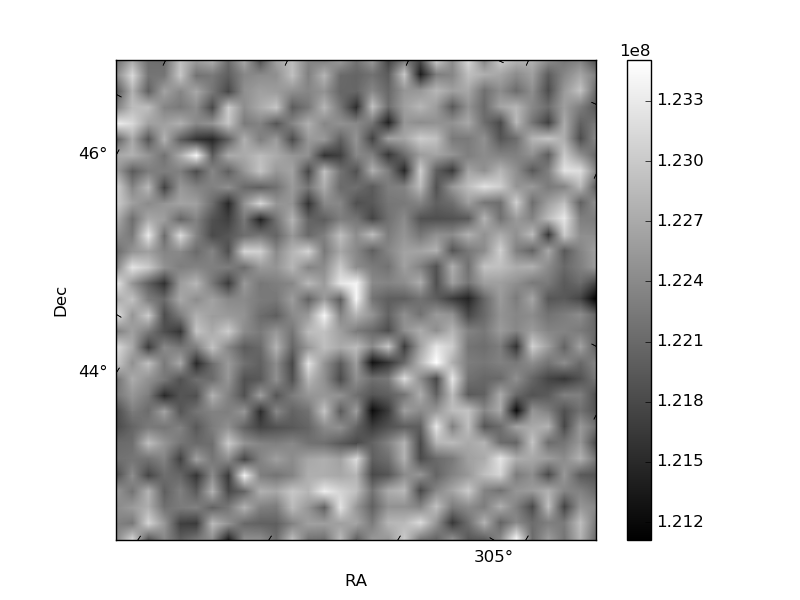
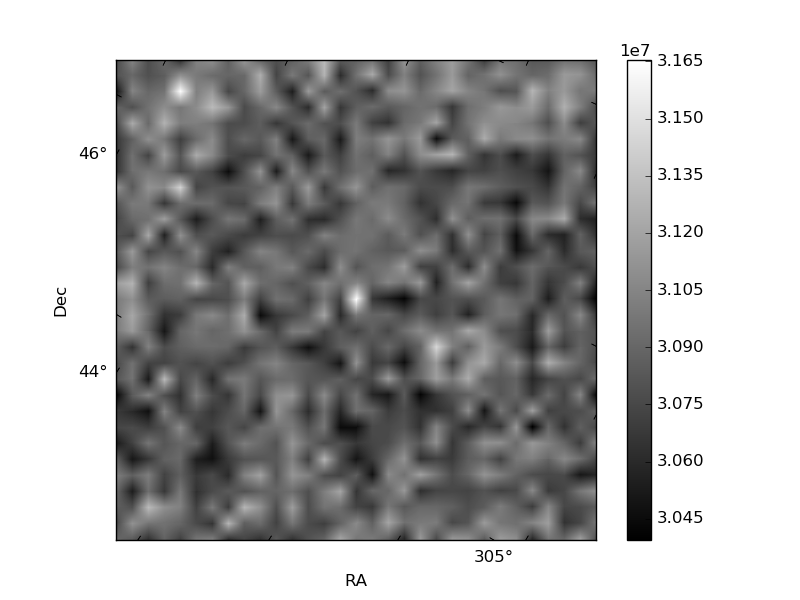
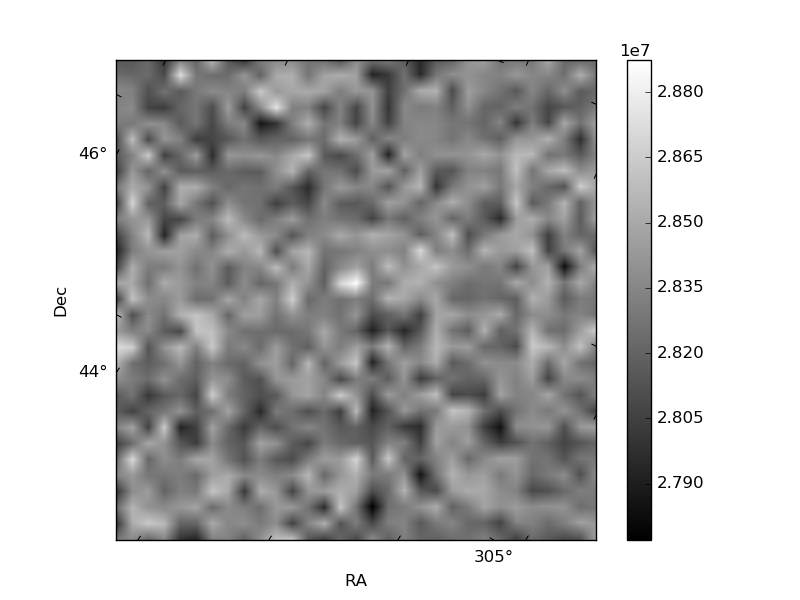
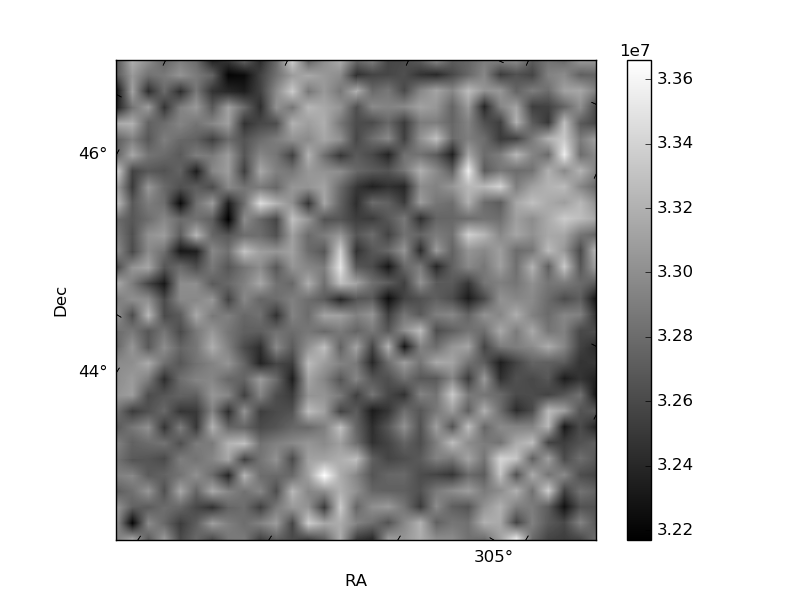
Histogram calculated using DETX and DETY for each event in the final _common_clean file
| Quadrant A | 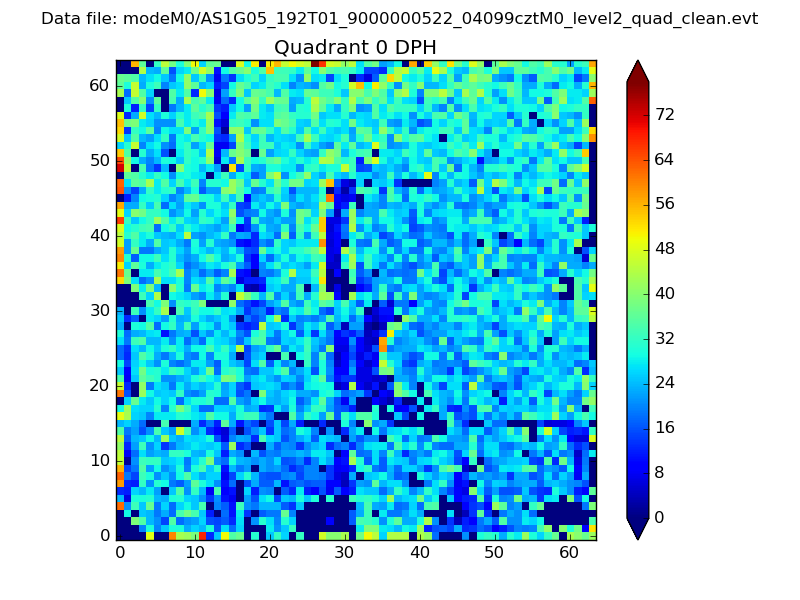 |
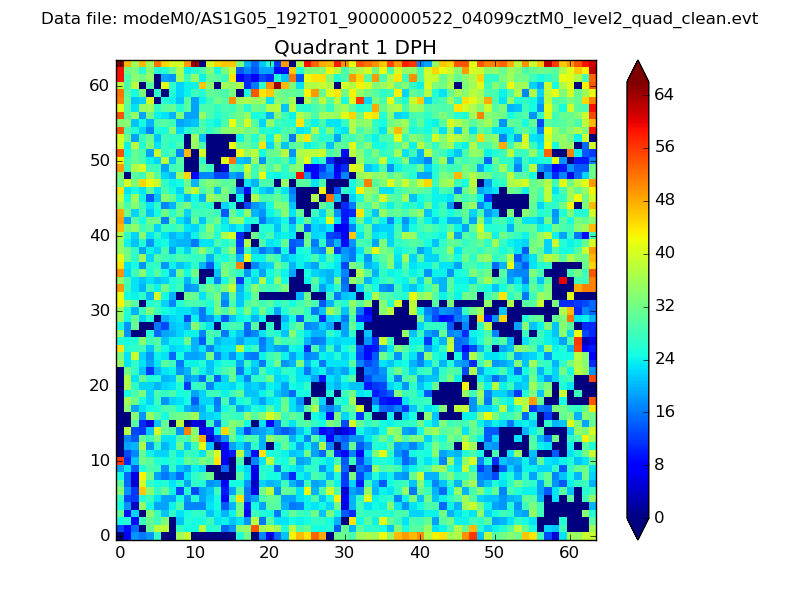 |
Quadrant B |
|---|---|---|---|
| Quadrant D | 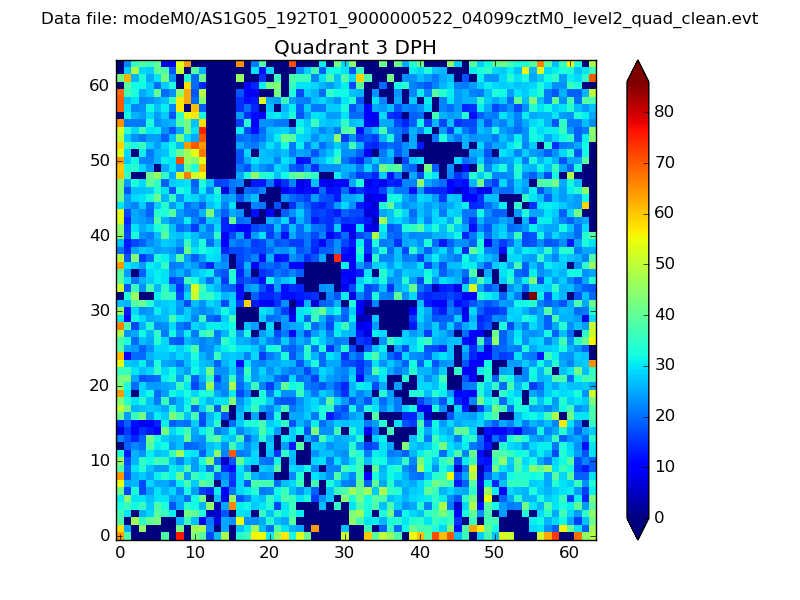 |
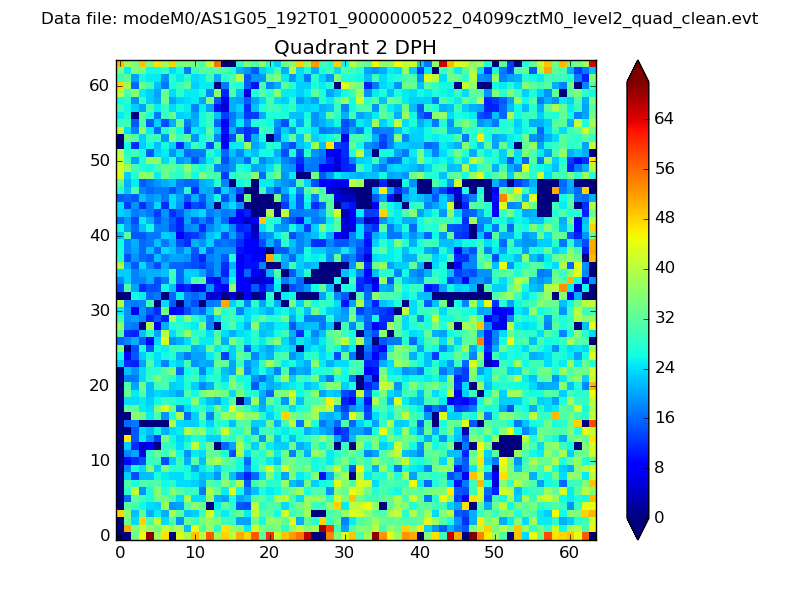 |
Quadrant C |
| Plot type | Count rate plots | Images |
|---|---|---|
| Comparison with Poisson distribution Blue bars denote a histogram of data divided into 1 sec bins. Red curve is a Poisson curve with rate = median count rate of data. |
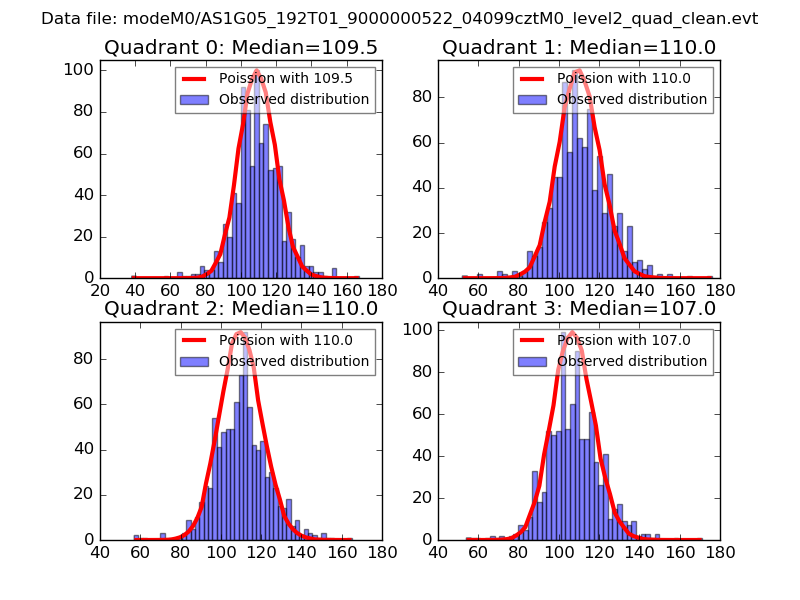 |
 |
| Quadrant-wise count rates Data is divided into 100 sec bins |
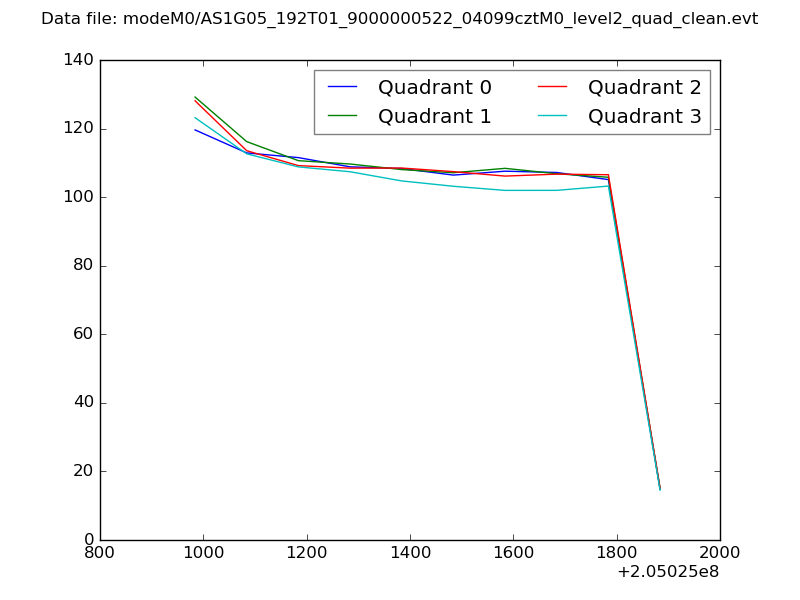 |
|
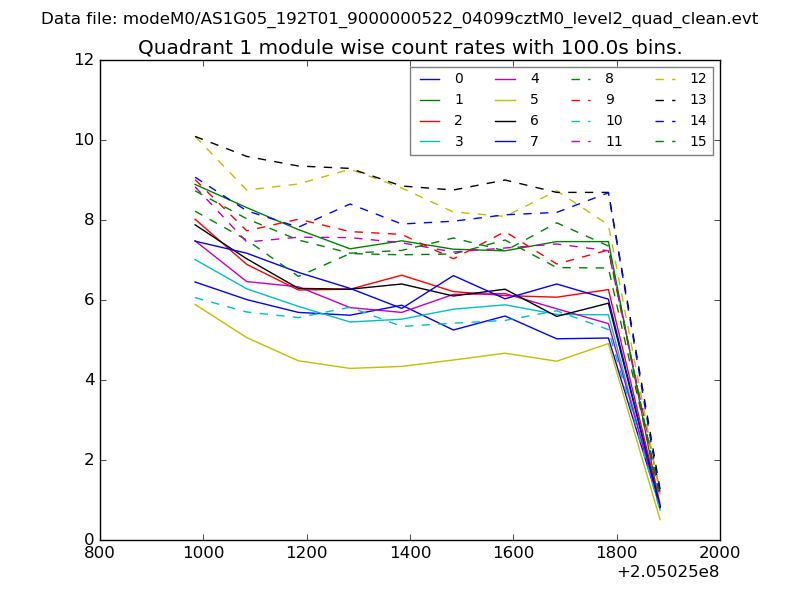
| Module-wise count rates for Quadrant A Data is divided into 100 sec bins |
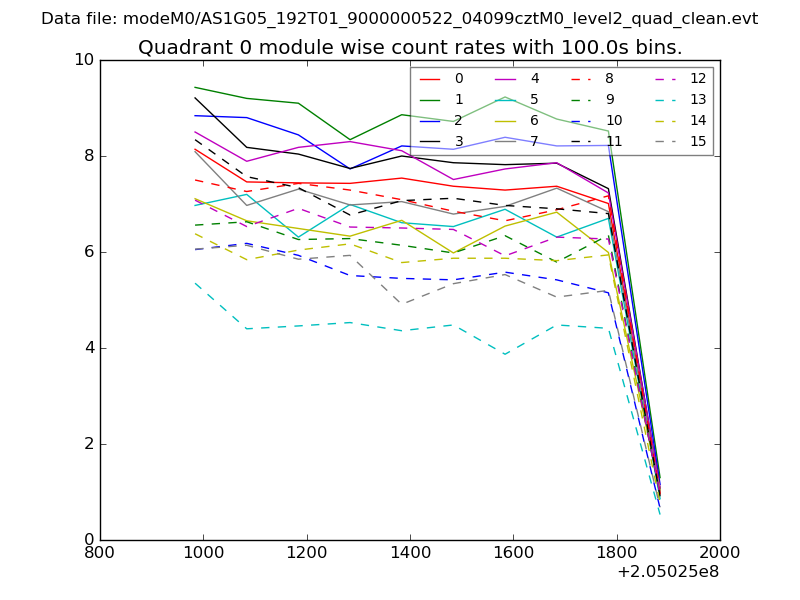 |
 |
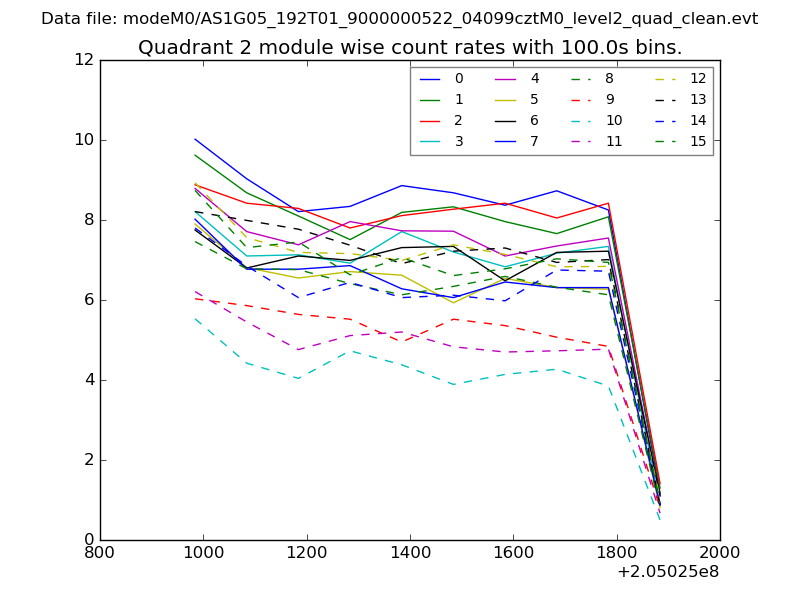
| Module-wise count rates for Quadrant B Data is divided into 100 sec bins |
 |
 |
| Module-wise count rates for Quadrant C Data is divided into 100 sec bins |
 |
 |
| Module-wise count rates for Quadrant D Data is divided into 100 sec bins |
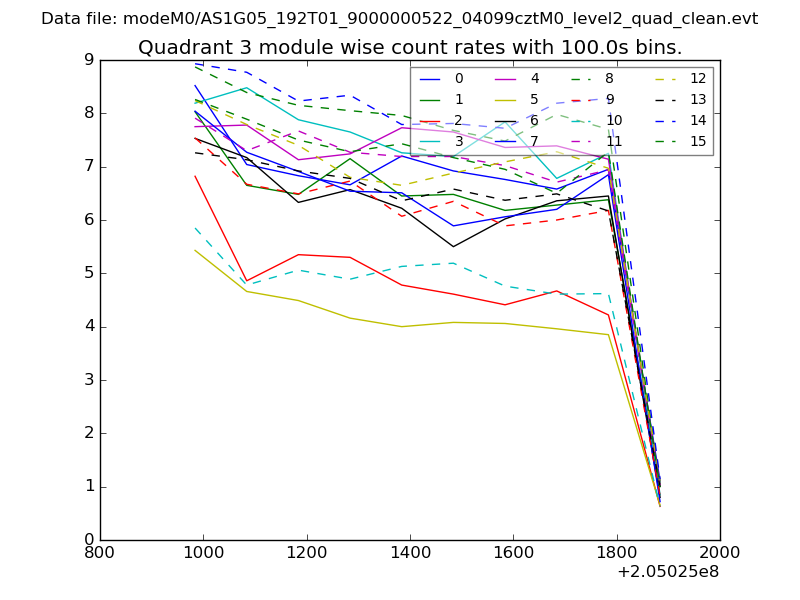 |
 |
| Parameter | Plot |
|---|---|
| CZT HV Monitor | 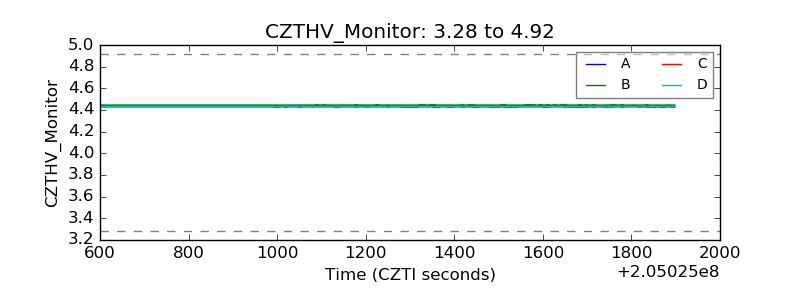 |
| D_VDD | 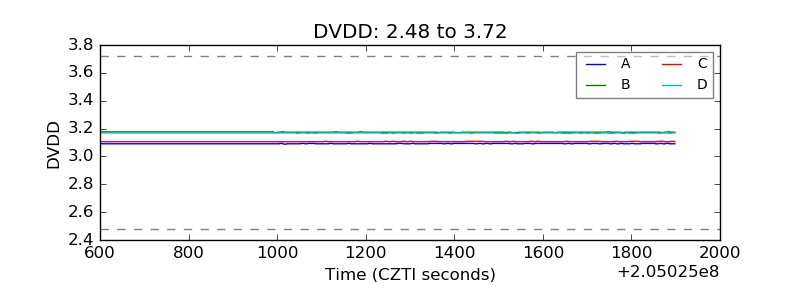 |
| Temperature 1 | 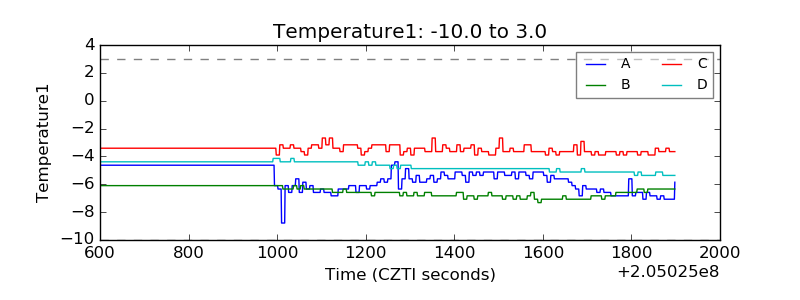 |
| Veto HV Monitor | 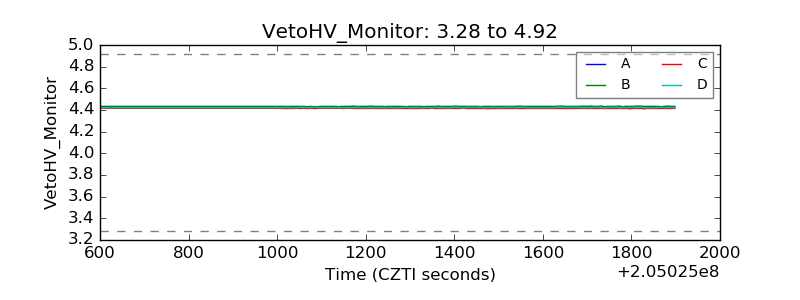 |
| Veto LLD | 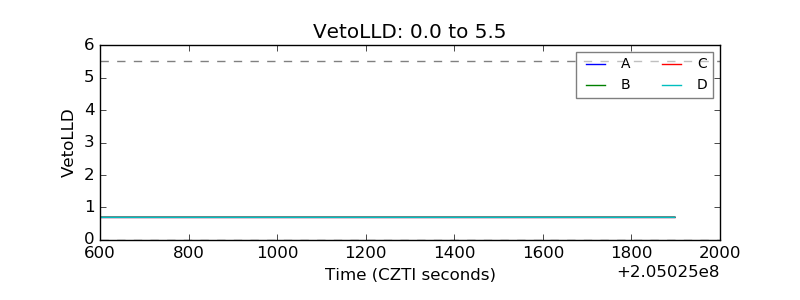 |
| Alpha Counter | 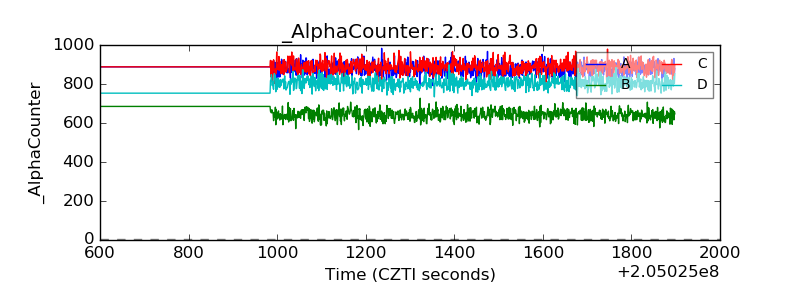 |
| _CPM_Rate | 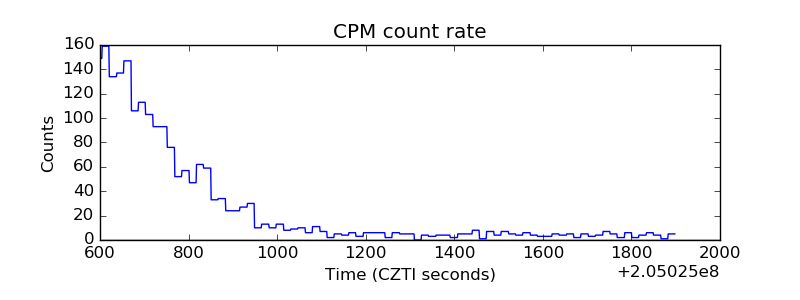 |
| CZT Counter | 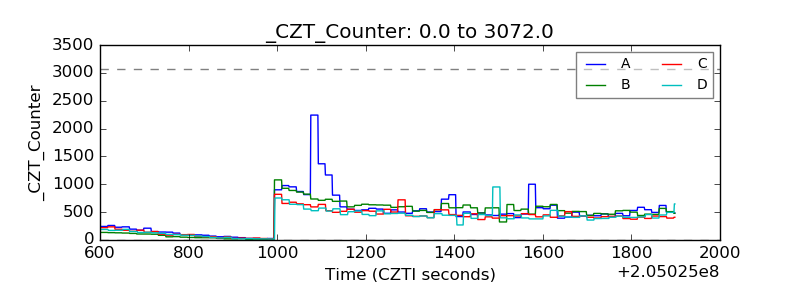 |
| +2.5 Volts monitor |  |
| +5 Volts monitor |  |
| _ROLL_ROT | 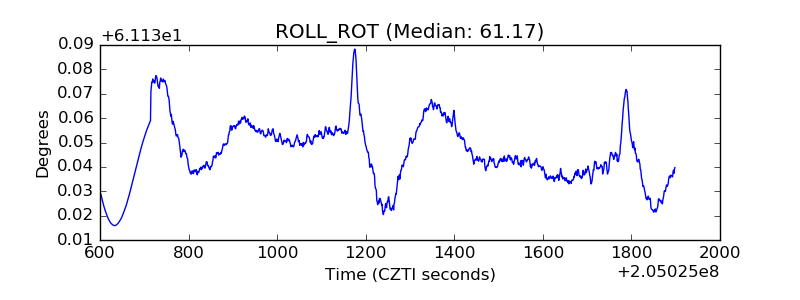 |
| _Roll_DEC | 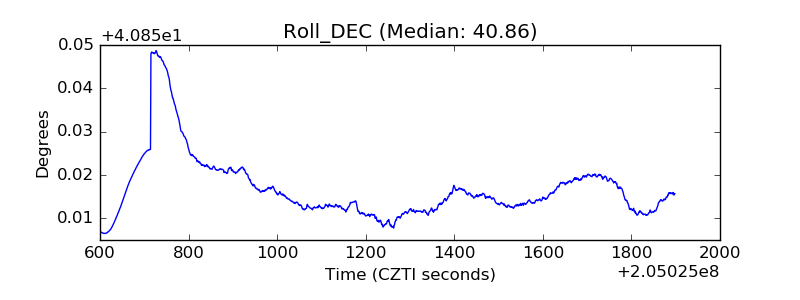 |
| _Roll_RA | 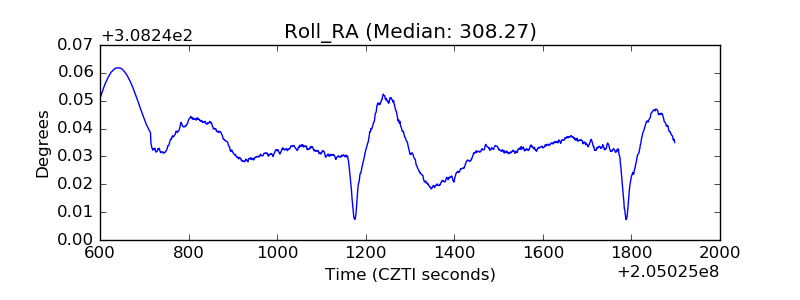 |
| Veto Counter | 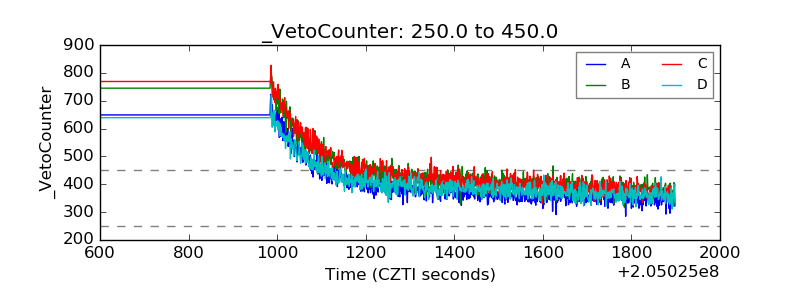 |