| Param | Original file | Final file |
|---|---|---|
| Filename | modeM0/AS1SLEW_01234_9000000521_04094cztM0_level2.evt | modeM0/AS1SLEW_01234_9000000521_04094cztM0_level2_quad_clean.evt |
| Size (bytes) | 106,182,720 | 13,417,920 |
| Size | 101.3 MB | 12.8 MB |
| Events in quadrant A | 369,086 | 94,551 |
| Events in quadrant B | 476,762 | 93,433 |
| Events in quadrant C | 1,916,213 | 59,790 |
| Events in quadrant D | 390,997 | 89,048 |
| Mode M0 | |||
|---|---|---|---|
| Quadrant | BADHDUFLAG | Total packets | Discarded packets |
| A | 0 | 1749 | 0 |
| B | 0 | 1989 | 0 |
| C | 0 | 6281 | 0 |
| D | 0 | 1834 | 0 |
| Mode SS | |||
|---|---|---|---|
| Quadrant | BADHDUFLAG | Total packets | Discarded packets |
| A | 0 | 18 | 0 |
| B | 0 | 18 | 0 |
| C | 0 | 18 | 0 |
| D | 0 | 18 | 0 |
| Quadrant | Total seconds | Saturated seconds | Saturation percentage |
|---|---|---|---|
| A | 874 | 0 | 0.000000% |
| B | 874 | 6 | 0.686499% |
| C | 874 | 681 | 77.917620% |
| D | 874 | 2 | 0.228833% |
Noise dominated data is calculated using 1-second bins in cleaned event files. If a bin has >2000 counts, and if more than 50% of those come from <1% of pixels, then it is considered to be noise-dominated and hence unusable.
| Quadrant | # 1 sec bins | Bins with >0 counts | Bins with >2000 counts | High rate bins dominated by noise | Noise dominated (total time) | Noise dominated (detector-on time) | Marked lightcurve |
|---|---|---|---|---|---|---|---|
| A | 874 | 874 | 0 | 0 | 0.00% | 0.00% | 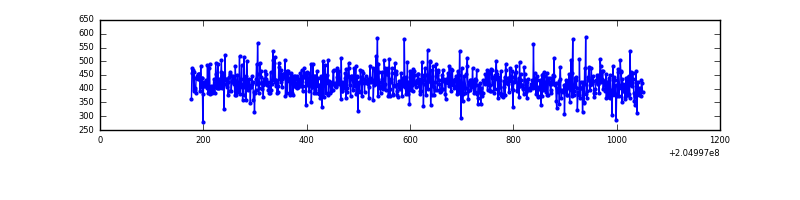 |
| B | 874 | 874 | 3 | 3 | 0.34% | 0.34% | 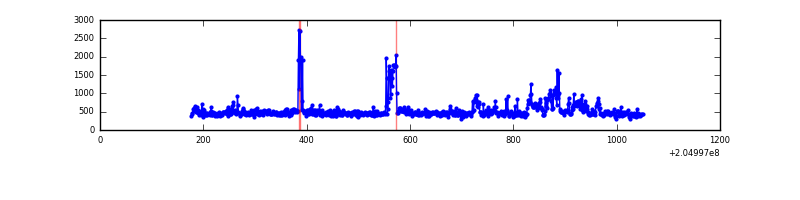 |
| C | 873 | 873 | 670 | 670 | 76.75% | 76.75% | 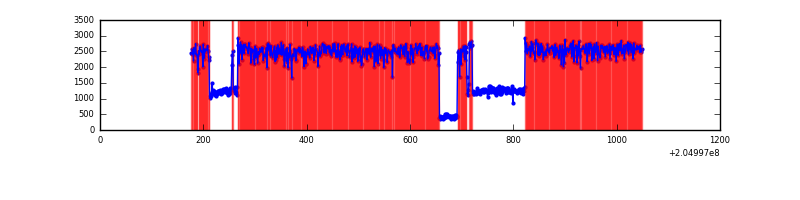 |
| D | 874 | 874 | 1 | 1 | 0.11% | 0.11% | 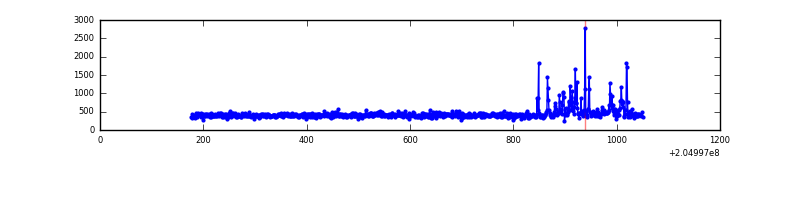 |
Top three noisy pixels from each quadrant. If the there are fewer than three noisy pixels in the level2.evt file, extra rows are filled as -1
| Pixel properties | Quadrant properties | ||||||
|---|---|---|---|---|---|---|---|
| Quadrant | DetID | PixID | Counts | Sigma | Mean | Median | Sigma |
| A | 0 | 199 | 1132 | 47.92 | 95 | 93 | 21.7 |
| A | 0 | 226 | 1019 | 42.71 | 95 | 93 | 21.7 |
| A | 12 | 194 | 968 | 40.36 | 95 | 93 | 21.7 |
| B | 10 | 16 | 73532 | 3469.36 | 97 | 94 | 21.2 |
| B | 14 | 167 | 23805 | 1120.16 | 97 | 94 | 21.2 |
| B | 4 | 48 | 2600 | 118.39 | 97 | 94 | 21.2 |
| C | 12 | 204 | 1641835 | 90771.34 | 69 | 69 | 18.1 |
| C | 9 | 144 | 894 | 45.61 | 69 | 69 | 18.1 |
| C | 13 | 61 | 588 | 28.69 | 69 | 69 | 18.1 |
| D | 2 | 232 | 18167 | 734.43 | 92 | 89 | 24.6 |
| D | 10 | 172 | 13263 | 535.2 | 92 | 89 | 24.6 |
| D | 13 | 223 | 7318 | 293.68 | 92 | 89 | 24.6 |
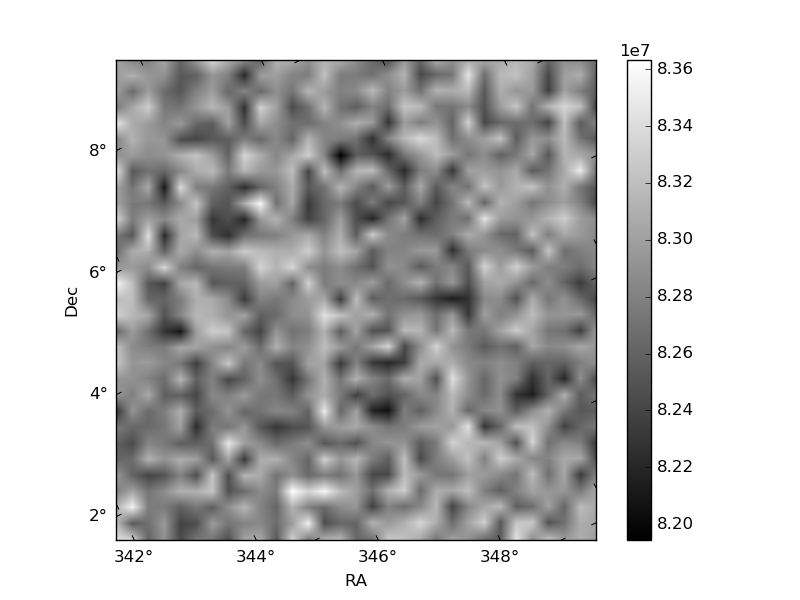
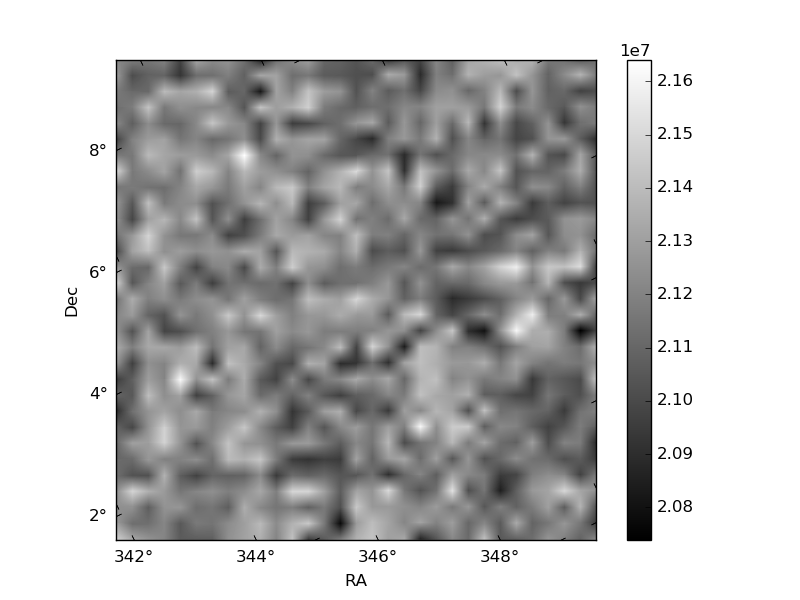
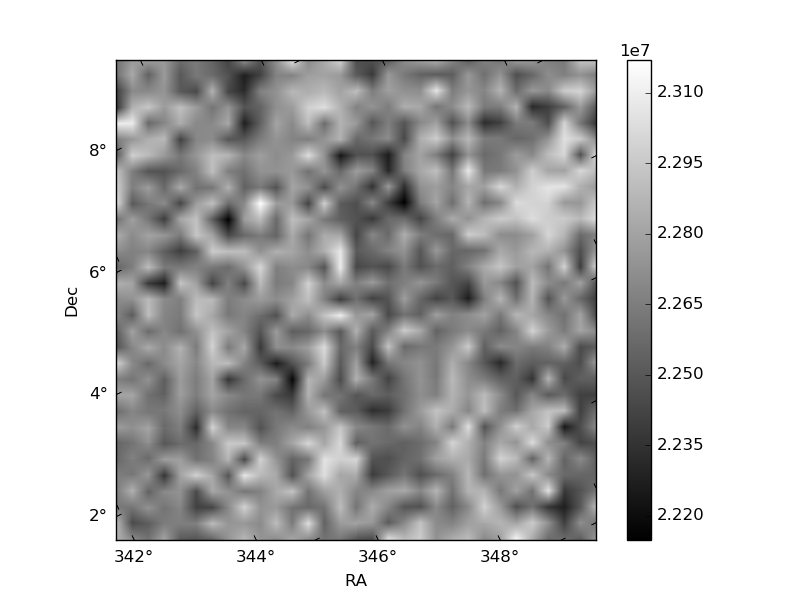
Histogram calculated using DETX and DETY for each event in the final _common_clean file
| Quadrant A | 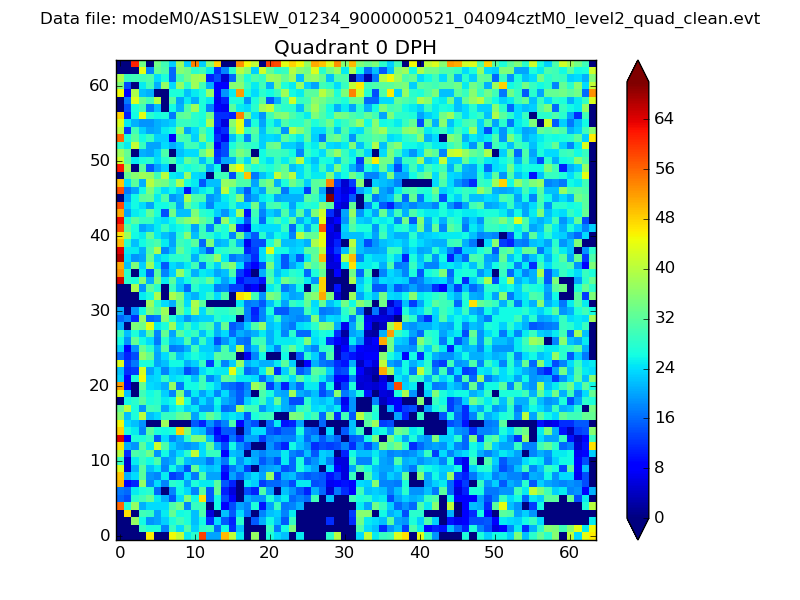 |
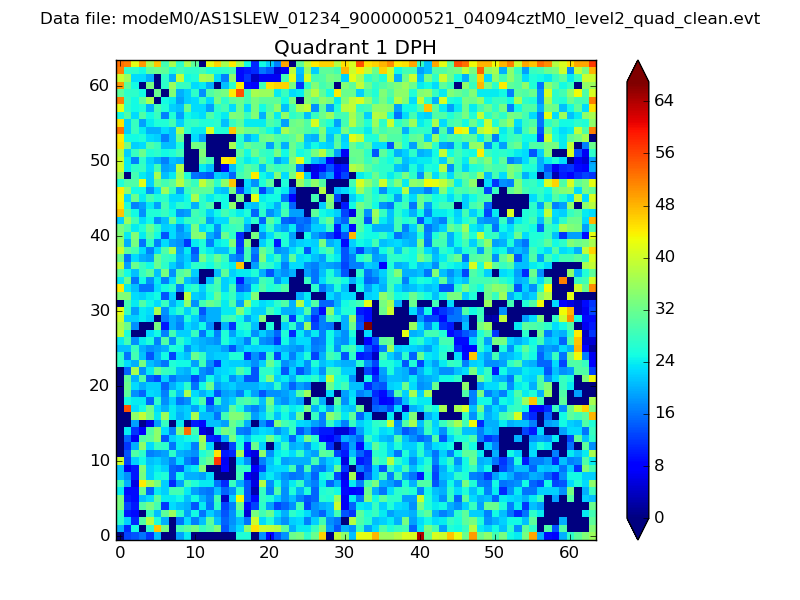 |
Quadrant B |
|---|---|---|---|
| Quadrant D | 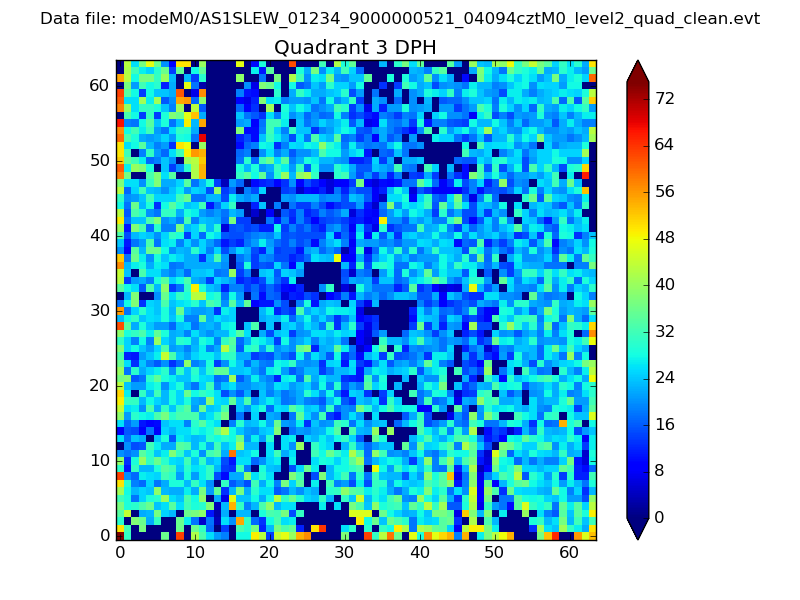 |
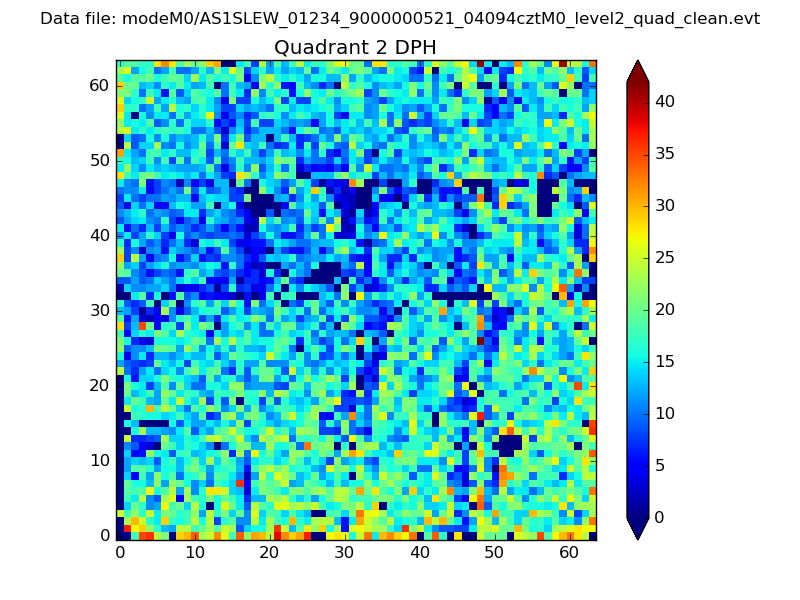 |
Quadrant C |
| Plot type | Count rate plots | Images |
|---|---|---|
| Comparison with Poisson distribution Blue bars denote a histogram of data divided into 1 sec bins. Red curve is a Poisson curve with rate = median count rate of data. |
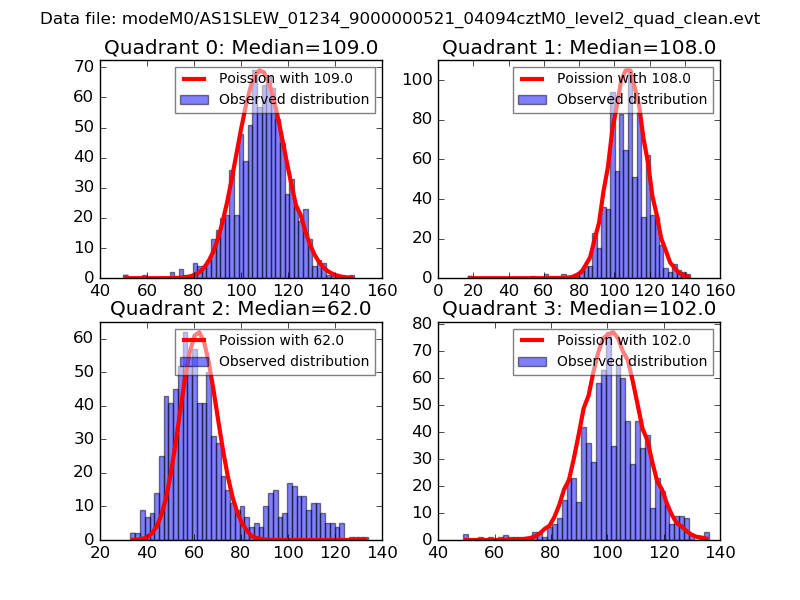 |
 |
| Quadrant-wise count rates Data is divided into 100 sec bins |
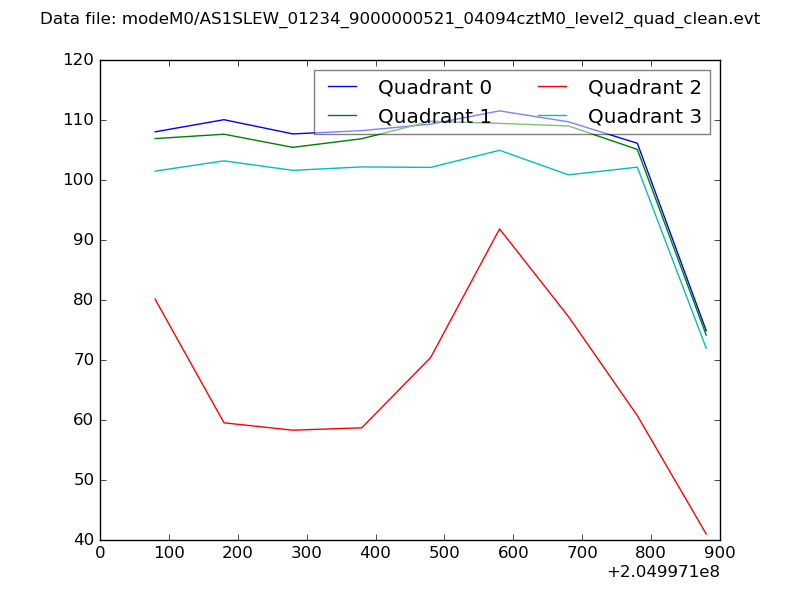 |
|
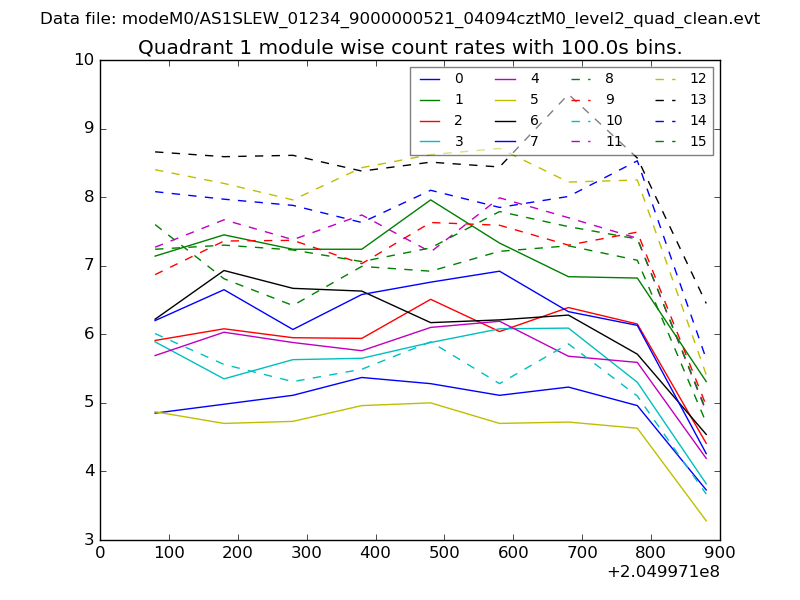
| Module-wise count rates for Quadrant A Data is divided into 100 sec bins |
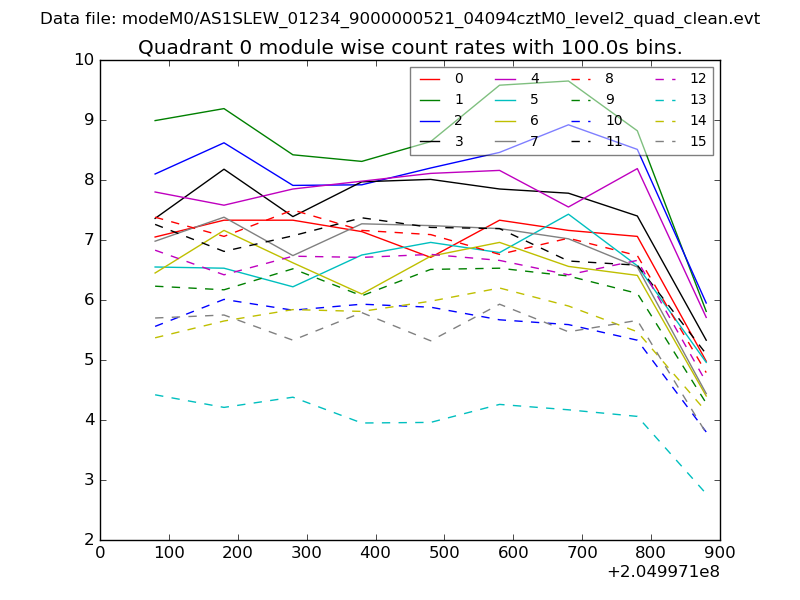 |
 |
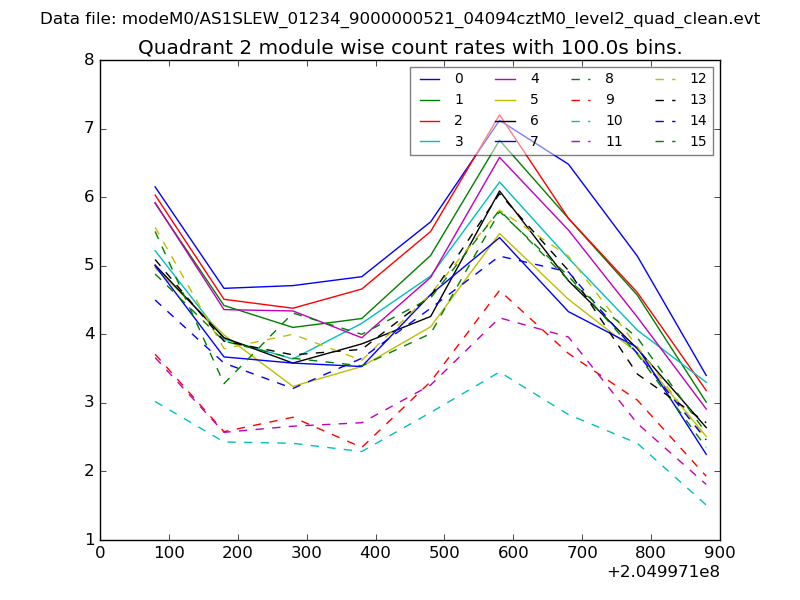
| Module-wise count rates for Quadrant B Data is divided into 100 sec bins |
 |
 |
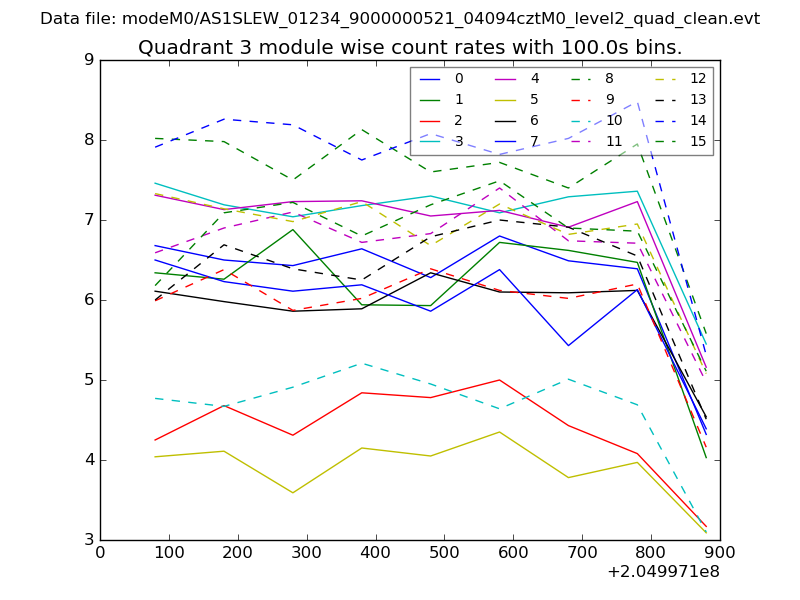
| Module-wise count rates for Quadrant C Data is divided into 100 sec bins |
 |
 |
| Module-wise count rates for Quadrant D Data is divided into 100 sec bins |
 |
 |
| Parameter | Plot |
|---|---|
| CZT HV Monitor | 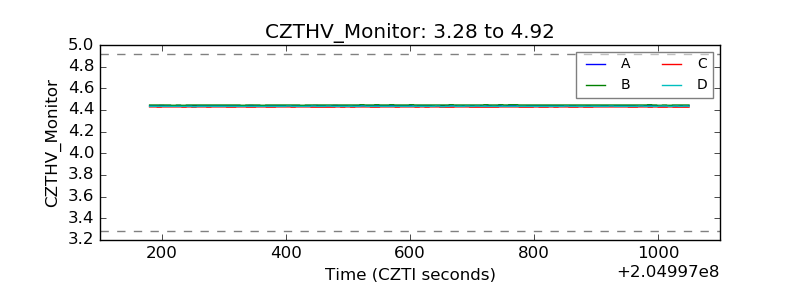 |
| D_VDD |  |
| Temperature 1 | 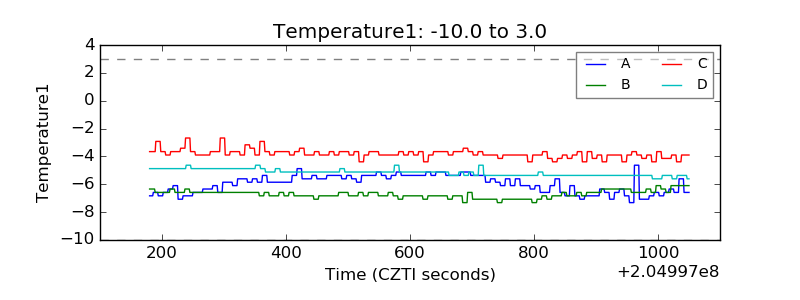 |
| Veto HV Monitor | 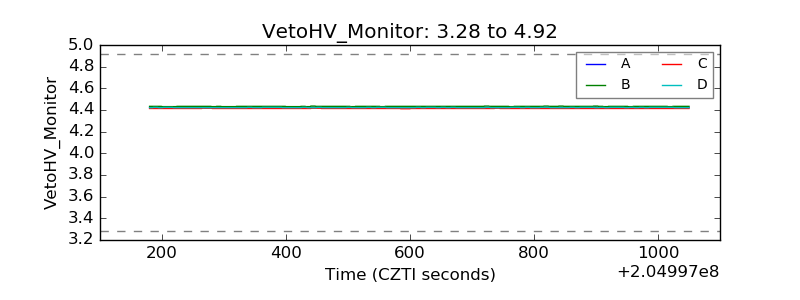 |
| Veto LLD | 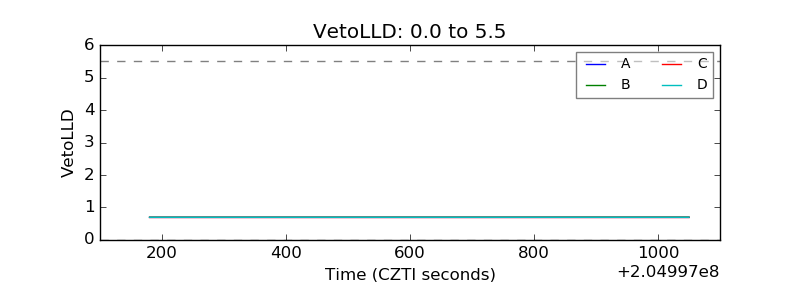 |
| Alpha Counter | 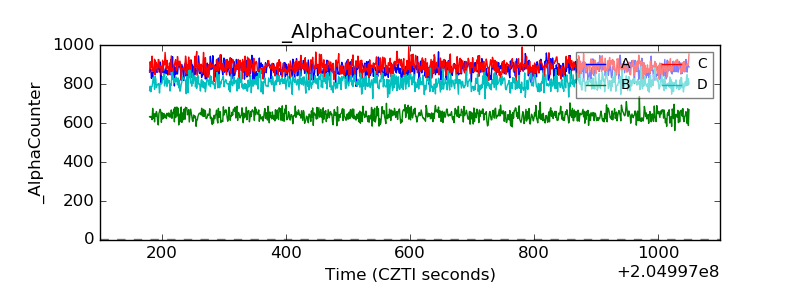 |
| _CPM_Rate | 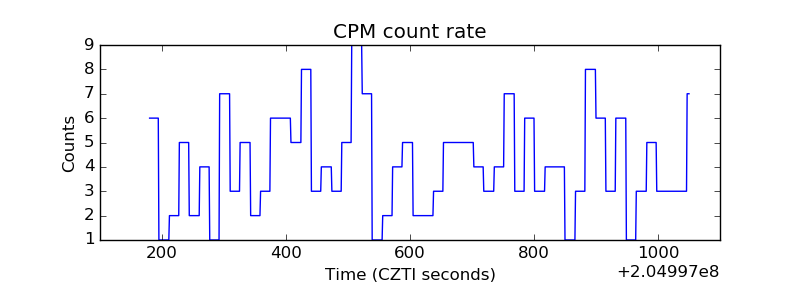 |
| CZT Counter | 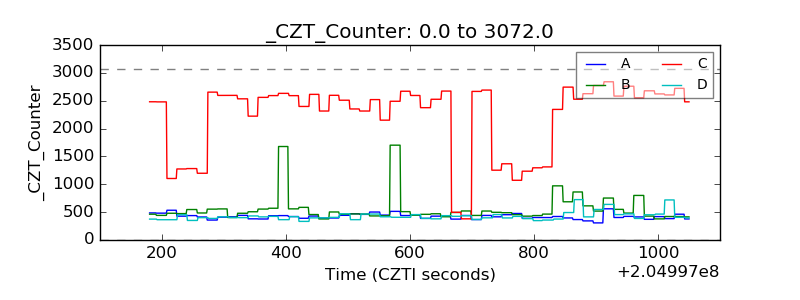 |
| +2.5 Volts monitor |  |
| +5 Volts monitor |  |
| _ROLL_ROT | 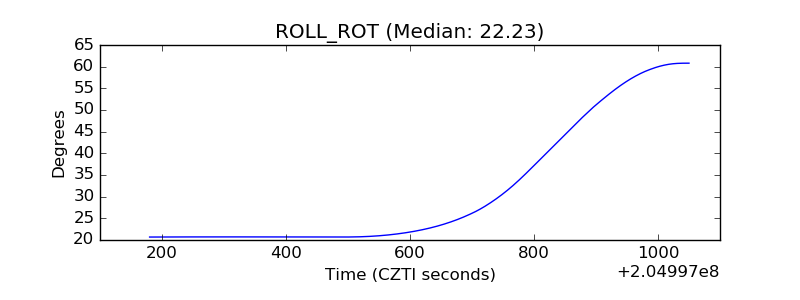 |
| _Roll_DEC | 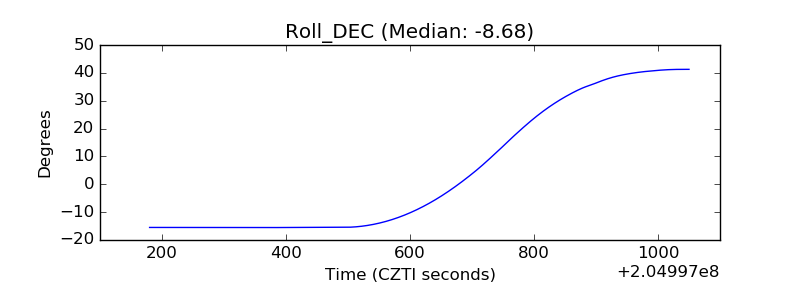 |
| _Roll_RA | 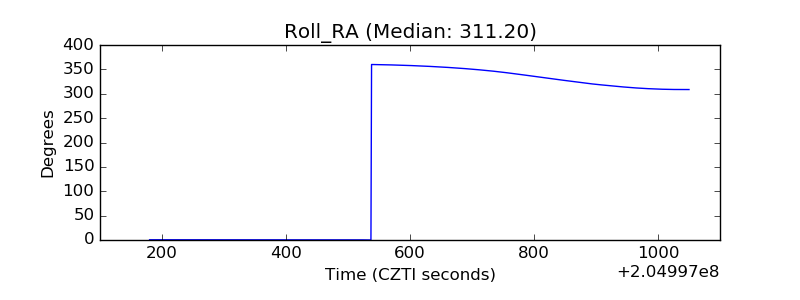 |
| Veto Counter | 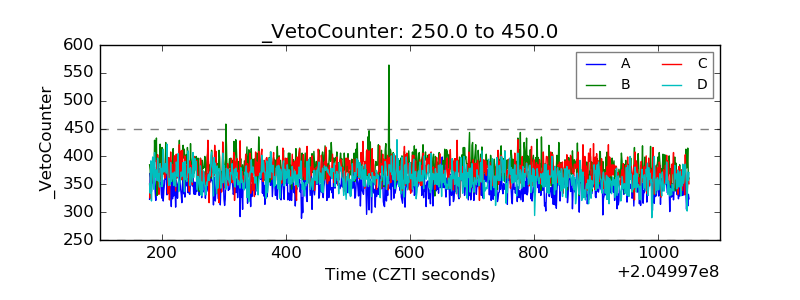 |