| Param | Original file | Final file |
|---|---|---|
| Filename | modeM0/AS1SLEW_01234_9000000523_04098cztM0_level2.evt | modeM0/AS1SLEW_01234_9000000523_04098cztM0_level2_quad_clean.evt |
| Size (bytes) | 27,138,240 | 6,690,240 |
| Size | 25.9 MB | 6.4 MB |
| Events in quadrant A | 190,075 | 41,659 |
| Events in quadrant B | 210,095 | 41,848 |
| Events in quadrant C | 164,469 | 41,340 |
| Events in quadrant D | 225,818 | 40,553 |
| Mode SS | |||
|---|---|---|---|
| Quadrant | BADHDUFLAG | Total packets | Discarded packets |
| A | 0 | 10 | 0 |
| B | 0 | 10 | 0 |
| C | 0 | 10 | 0 |
| D | 0 | 10 | 0 |
| Mode M0 | |||
|---|---|---|---|
| Quadrant | BADHDUFLAG | Total packets | Discarded packets |
| A | 0 | 847 | 0 |
| B | 0 | 847 | 0 |
| C | 0 | 804 | 0 |
| D | 0 | 973 | 0 |
| Quadrant | Total seconds | Saturated seconds | Saturation percentage |
|---|---|---|---|
| A | 402 | 0 | 0.000000% |
| B | 402 | 0 | 0.000000% |
| C | 402 | 0 | 0.000000% |
| D | 402 | 0 | 0.000000% |
Noise dominated data is calculated using 1-second bins in cleaned event files. If a bin has >2000 counts, and if more than 50% of those come from <1% of pixels, then it is considered to be noise-dominated and hence unusable.
| Quadrant | # 1 sec bins | Bins with >0 counts | Bins with >2000 counts | High rate bins dominated by noise | Noise dominated (total time) | Noise dominated (detector-on time) | Marked lightcurve |
|---|---|---|---|---|---|---|---|
| A | 402 | 402 | 0 | 0 | 0.00% | 0.00% | 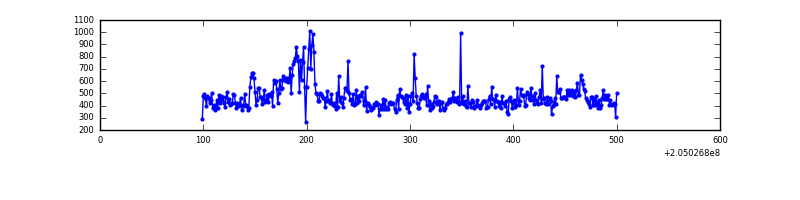 |
| B | 402 | 402 | 1 | 1 | 0.25% | 0.25% | 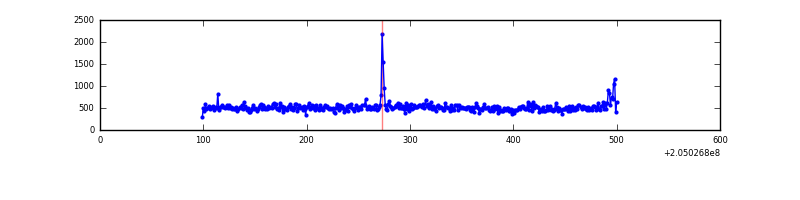 |
| C | 402 | 402 | 0 | 0 | 0.00% | 0.00% | 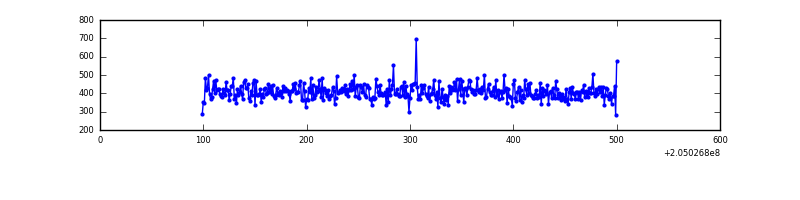 |
| D | 402 | 402 | 2 | 2 | 0.50% | 0.50% | 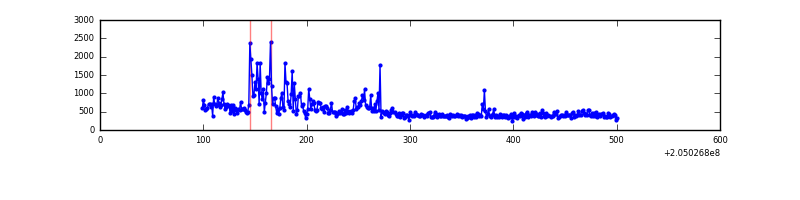 |
Top three noisy pixels from each quadrant. If the there are fewer than three noisy pixels in the level2.evt file, extra rows are filled as -1
| Pixel properties | Quadrant properties | ||||||
|---|---|---|---|---|---|---|---|
| Quadrant | DetID | PixID | Counts | Sigma | Mean | Median | Sigma |
| A | 0 | 199 | 13193 | 1199.75 | 42 | 41 | 11.0 |
| A | 0 | 50 | 10837 | 984.83 | 42 | 41 | 11.0 |
| A | 14 | 111 | 1697 | 151.06 | 42 | 41 | 11.0 |
| B | 3 | 0 | 33796 | 3252.76 | 43 | 42 | 10.4 |
| B | 12 | 18 | 3465 | 329.86 | 43 | 42 | 10.4 |
| B | 10 | 16 | 3092 | 293.92 | 43 | 42 | 10.4 |
| C | 13 | 61 | 385 | 28.79 | 42 | 42 | 11.9 |
| C | 9 | 144 | 330 | 24.17 | 42 | 42 | 11.9 |
| C | -1 | -1 | -1 | -1.0 | 42 | 42 | 11.9 |
| D | 12 | 233 | 40547 | 3475.45 | 40 | 39 | 11.7 |
| D | 10 | 172 | 10694 | 914.16 | 40 | 39 | 11.7 |
| D | 2 | 14 | 6355 | 541.89 | 40 | 39 | 11.7 |
Histogram calculated using DETX and DETY for each event in the final _common_clean file
| Quadrant A | 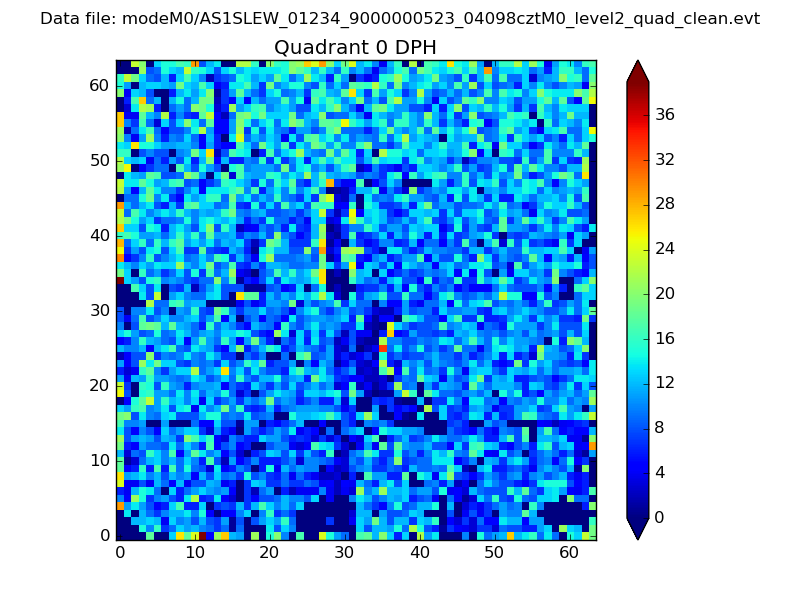 |
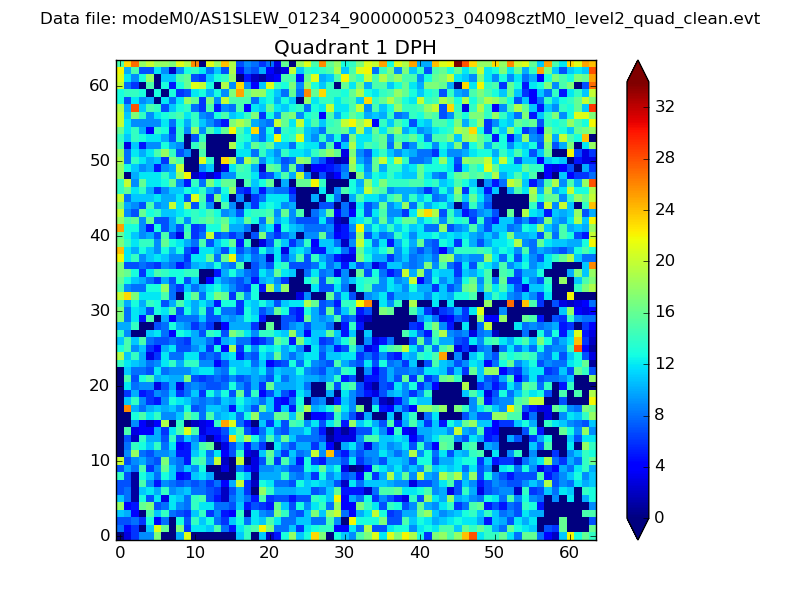 |
Quadrant B |
|---|---|---|---|
| Quadrant D |  |
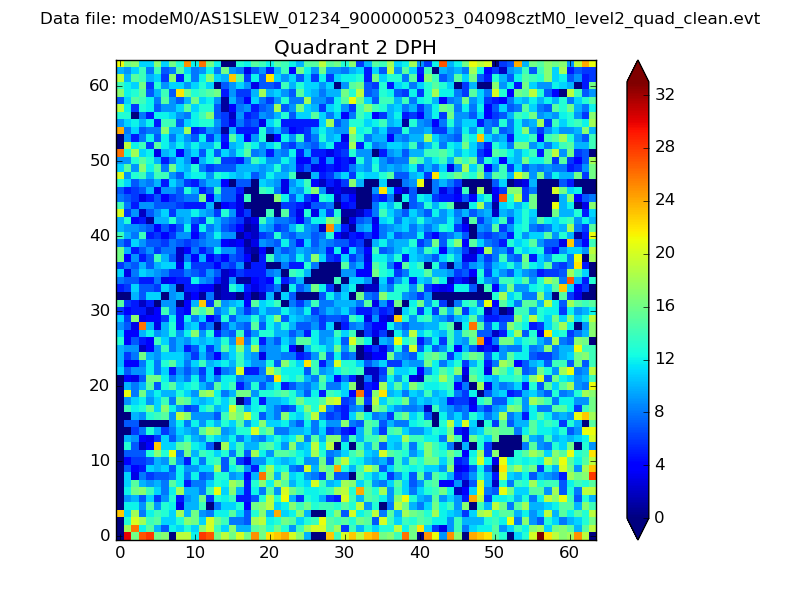 |
Quadrant C |
| Plot type | Count rate plots | Images |
|---|---|---|
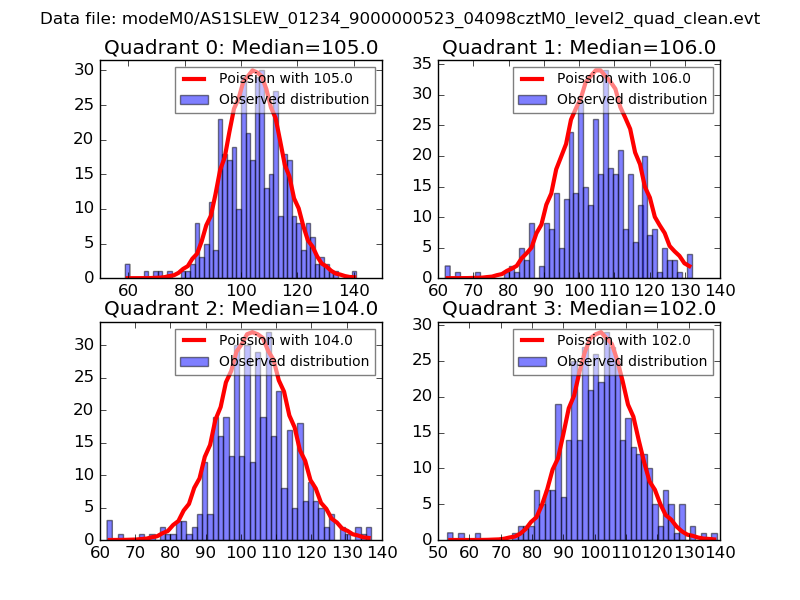
| Comparison with Poisson distribution Blue bars denote a histogram of data divided into 1 sec bins. Red curve is a Poisson curve with rate = median count rate of data. |
 |
 |
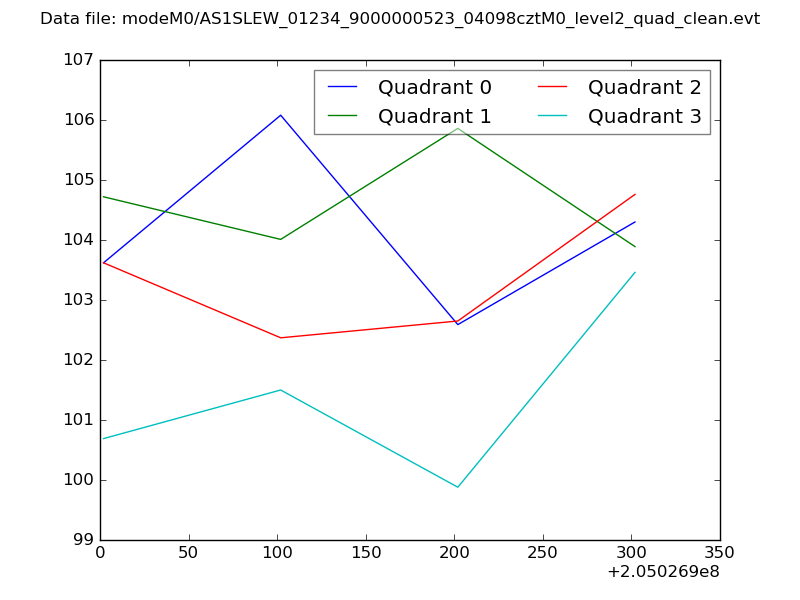
| Quadrant-wise count rates Data is divided into 100 sec bins |
 |
|
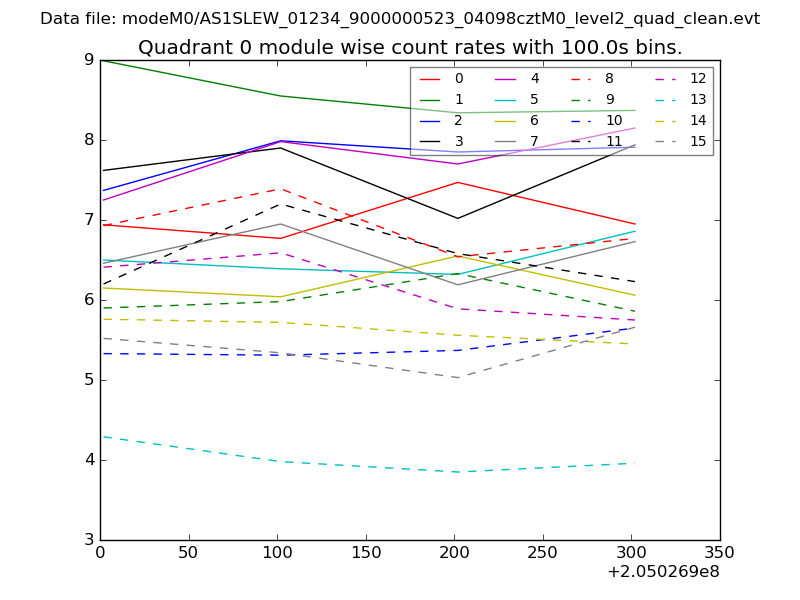
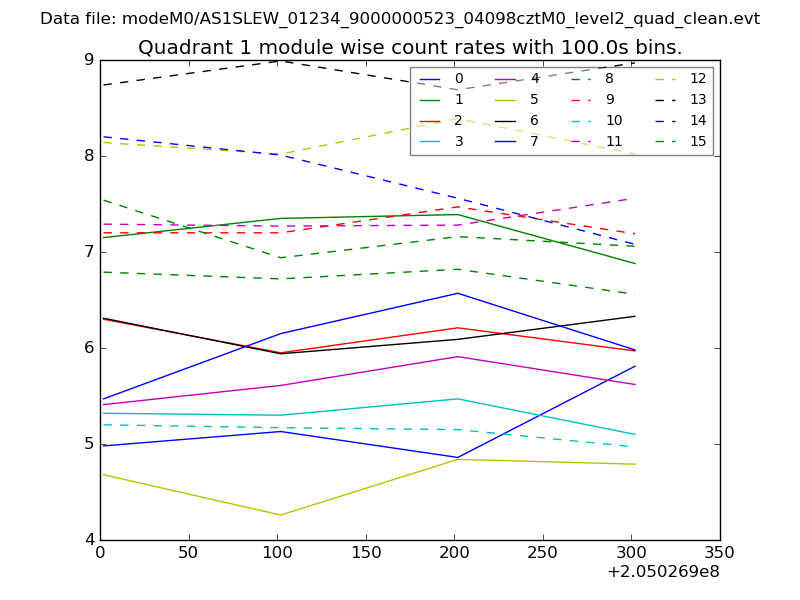
| Module-wise count rates for Quadrant A Data is divided into 100 sec bins |
 |
 |
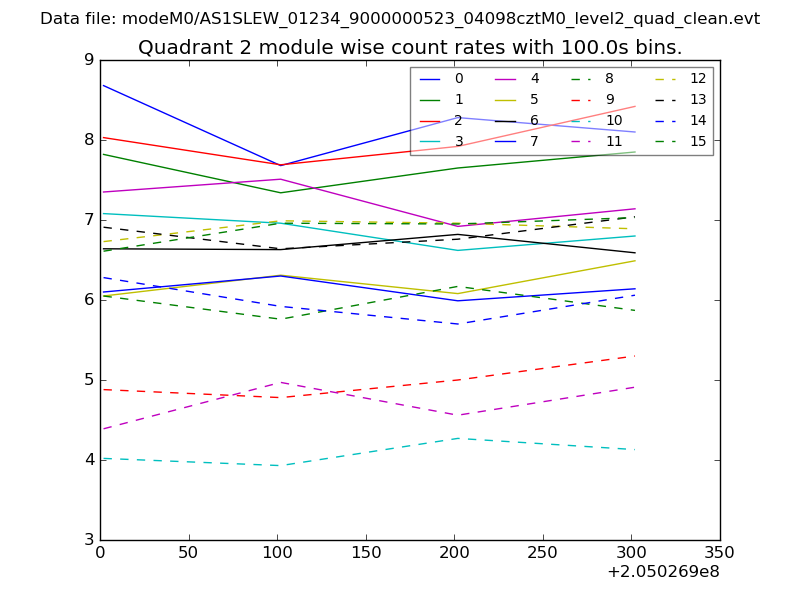
| Module-wise count rates for Quadrant B Data is divided into 100 sec bins |
 |
 |
| Module-wise count rates for Quadrant C Data is divided into 100 sec bins |
 |
 |
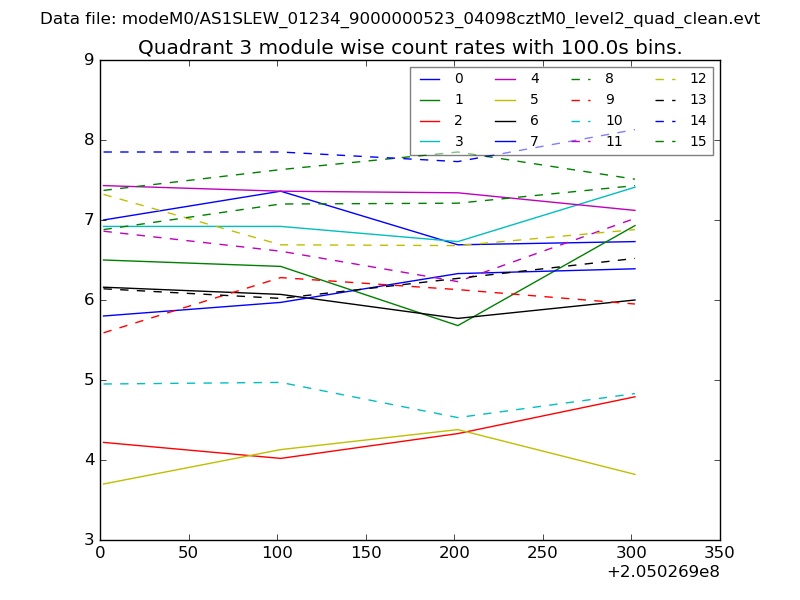
| Module-wise count rates for Quadrant D Data is divided into 100 sec bins |
 |
 |
| Parameter | Plot |
|---|---|
| CZT HV Monitor | 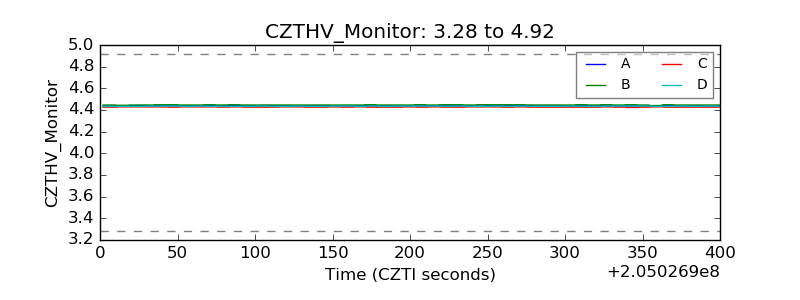 |
| D_VDD | 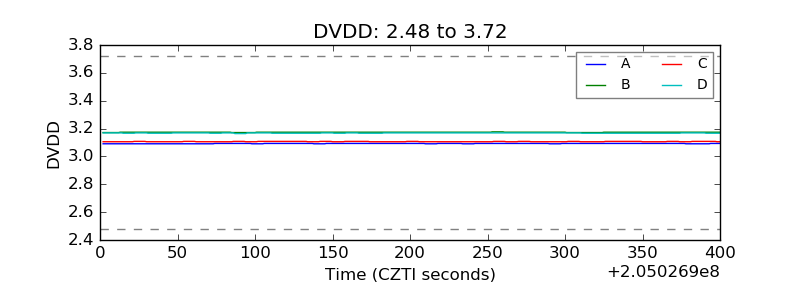 |
| Temperature 1 | 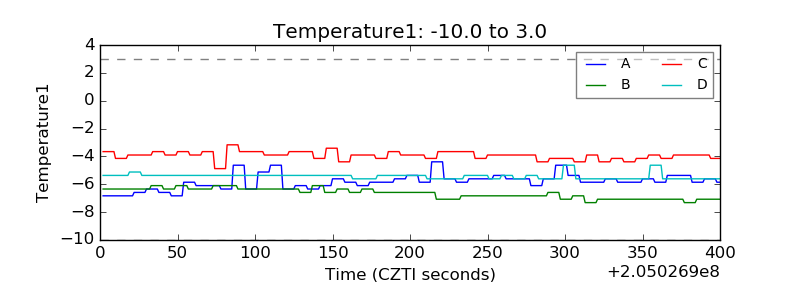 |
| Veto HV Monitor | 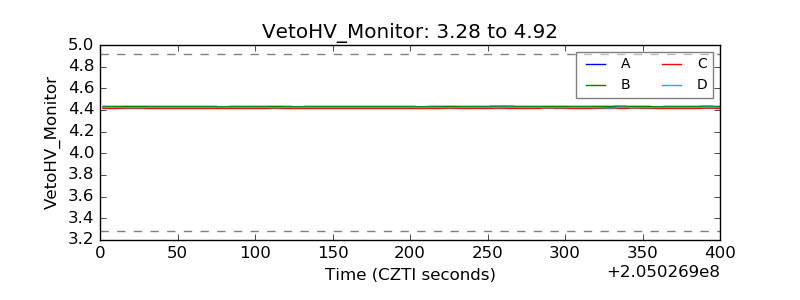 |
| Veto LLD | 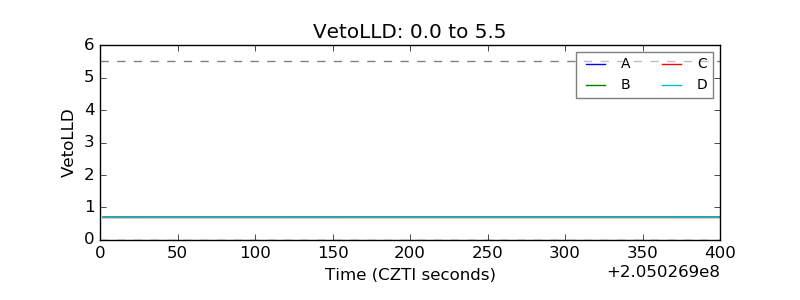 |
| Alpha Counter | 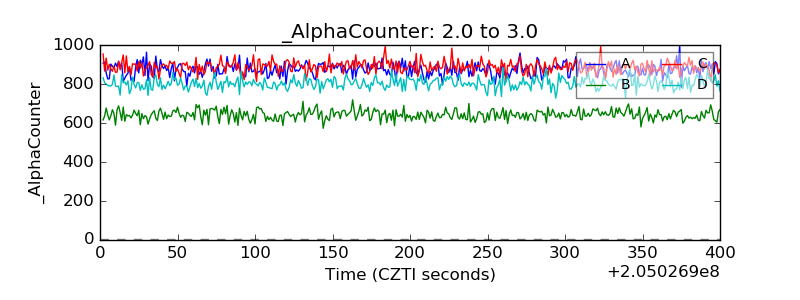 |
| _CPM_Rate | 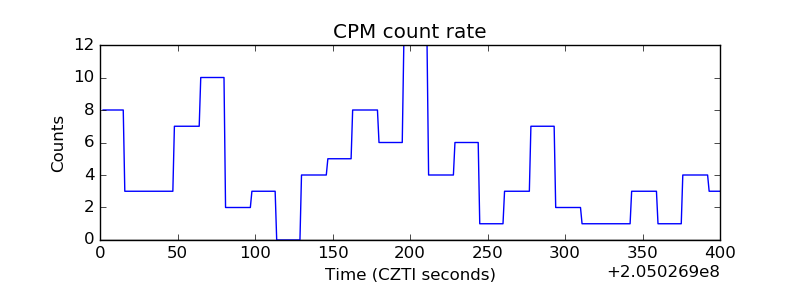 |
| CZT Counter | 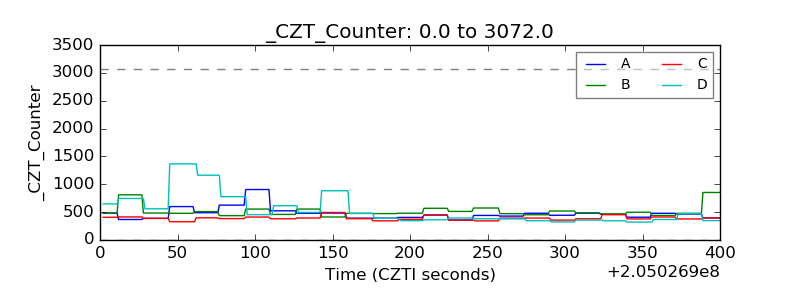 |
| +2.5 Volts monitor | 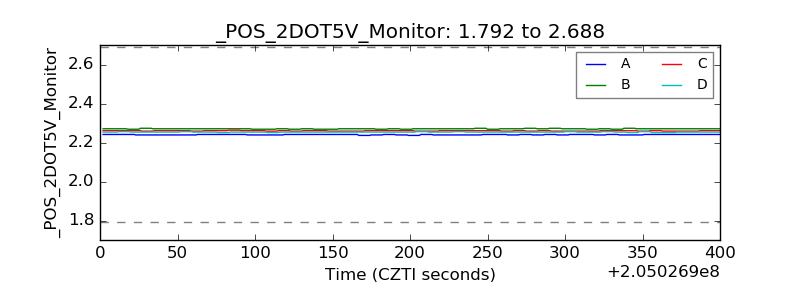 |
| +5 Volts monitor |  |
| _ROLL_ROT | 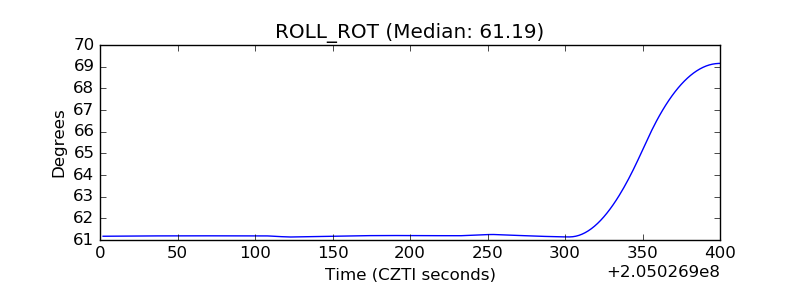 |
| _Roll_DEC | 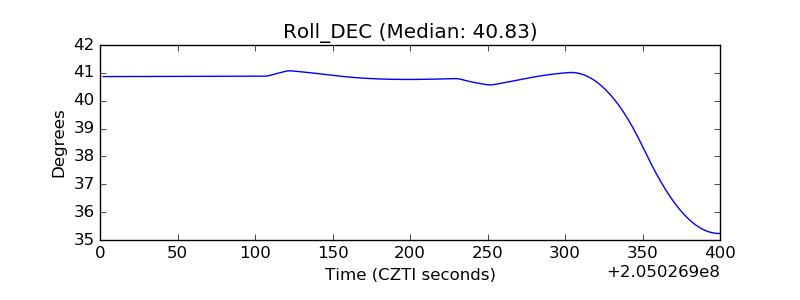 |
| _Roll_RA | 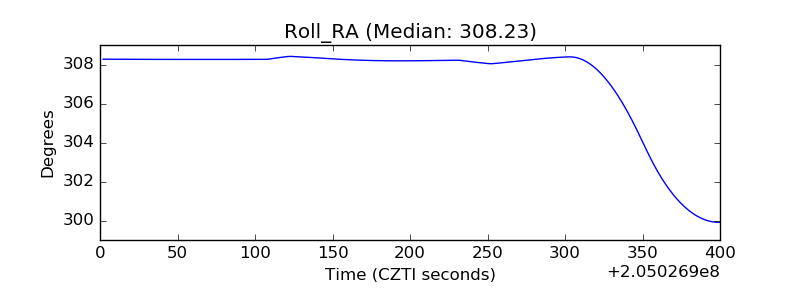 |
| Veto Counter | 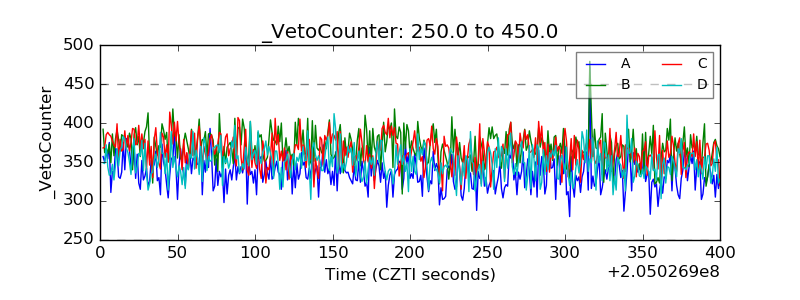 |