| Param | Original file | Final file |
|---|---|---|
| Filename | modeM0/AS1G05_191T01_9000000524cztM0_level2.fits | modeM0/AS1G05_191T01_9000000524cztM0_level2_quad_clean.evt |
| Size (bytes) | 538,816,320 | 618,995,520 |
| Size | 513.9 MB | 590.3 MB |
| Events in quadrant A | 3,222,250 | 3,850,321 |
| Events in quadrant B | 3,118,234 | 3,846,187 |
| Events in quadrant C | 3,184,938 | 3,642,361 |
| Events in quadrant D | 2,774,380 | 3,391,871 |
| Mode M0 | |||
|---|---|---|---|
| Quadrant | BADHDUFLAG | Total packets | Discarded packets |
| A | 0 | 127640 | 0 |
| B | 0 | 128688 | 0 |
| C | 0 | 131560 | 0 |
| D | 0 | 125694 | 0 |
| Mode M9 | |||
|---|---|---|---|
| Quadrant | BADHDUFLAG | Total packets | Discarded packets |
| A | 0 | 70 | 0 |
| B | 0 | 70 | 0 |
| C | 0 | 70 | 0 |
| D | 0 | 70 | 0 |
| Mode SS | |||
|---|---|---|---|
| Quadrant | BADHDUFLAG | Total packets | Discarded packets |
| A | 0 | 1186 | 0 |
| B | 0 | 1186 | 0 |
| C | 0 | 1186 | 0 |
| D | 0 | 1186 | 0 |
| Quadrant | Total seconds | Saturated seconds | Saturation percentage |
|---|---|---|---|
| A | 58579 | 1211 | 2.067294% |
| B | 58580 | 1448 | 2.471833% |
| C | 58580 | 1357 | 2.316490% |
| D | 58580 | 1018 | 1.737794% |
Noise dominated data is calculated using 1-second bins in cleaned event files. If a bin has >2000 counts, and if more than 50% of those come from <1% of pixels, then it is considered to be noise-dominated and hence unusable.
| Quadrant | # 1 sec bins | Bins with >0 counts | Bins with >2000 counts | High rate bins dominated by noise | Noise dominated (total time) | Noise dominated (detector-on time) | Marked lightcurve |
|---|---|---|---|---|---|---|---|
| A | 65379 | 58570 | 0 | 0 | 0.00% | 0.00% |  |
| B | 65379 | 58568 | 0 | 0 | 0.00% | 0.00% |  |
| C | 65379 | 58542 | 0 | 0 | 0.00% | 0.00% |  |
| D | 65379 | 58564 | 0 | 0 | 0.00% | 0.00% |  |
Top three noisy pixels from each quadrant. If the there are fewer than three noisy pixels in the level2.evt file, extra rows are filled as -1
| Pixel properties | Quadrant properties | ||||||
|---|---|---|---|---|---|---|---|
| Quadrant | DetID | PixID | Counts | Sigma | Mean | Median | Sigma |
| A | 0 | 29 | 3142 | 10.88 | 833 | 776 | 217.4 |
| A | 14 | 188 | 3126 | 10.81 | 833 | 776 | 217.4 |
| A | 7 | 110 | 2782 | 9.23 | 833 | 776 | 217.4 |
| B | 2 | 9 | 2669 | 11.23 | 821 | 777 | 168.5 |
| B | 12 | 226 | 2320 | 9.16 | 821 | 777 | 168.5 |
| B | 14 | 254 | 2103 | 7.87 | 821 | 777 | 168.5 |
| C | 1 | 81 | 2477 | 7.5 | 840 | 778 | 226.7 |
| C | 1 | 80 | 2427 | 7.27 | 840 | 778 | 226.7 |
| C | 1 | 65 | 2262 | 6.55 | 840 | 778 | 226.7 |
| D | 11 | 82 | 2481 | 8.18 | 789 | 714 | 216.1 |
| D | 3 | 14 | 2133 | 6.57 | 789 | 714 | 216.1 |
| D | 4 | 160 | 2102 | 6.42 | 789 | 714 | 216.1 |
Histogram calculated using DETX and DETY for each event in the final _common_clean file
| Quadrant A | 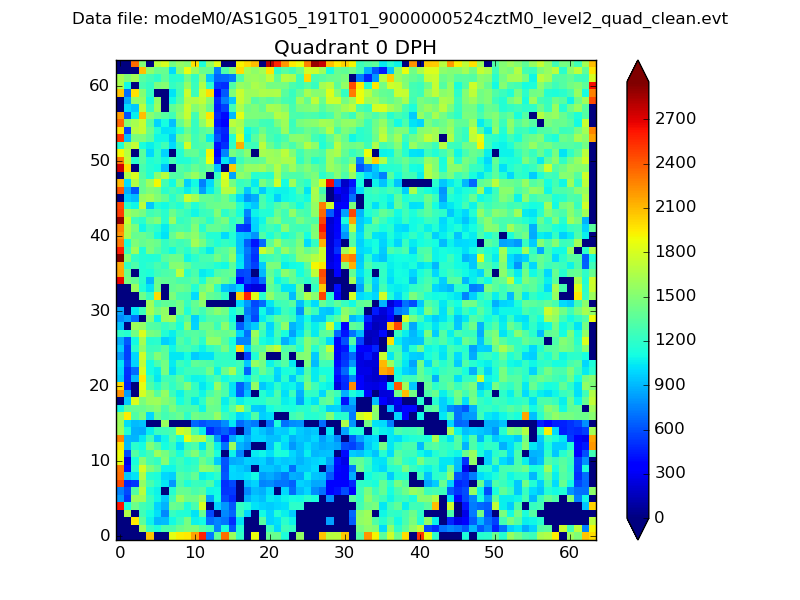 |
 |
Quadrant B |
|---|---|---|---|
| Quadrant D | 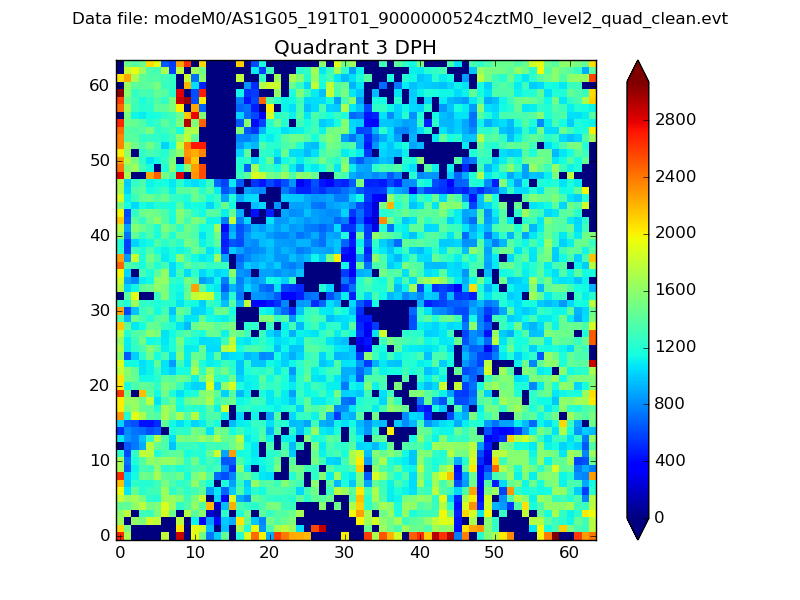 |
 |
Quadrant C |
| Plot type | Count rate plots | Images |
|---|---|---|
| Comparison with Poisson distribution Blue bars denote a histogram of data divided into 1 sec bins. Red curve is a Poisson curve with rate = median count rate of data. |
 |
 |
| Quadrant-wise count rates Data is divided into 100 sec bins |
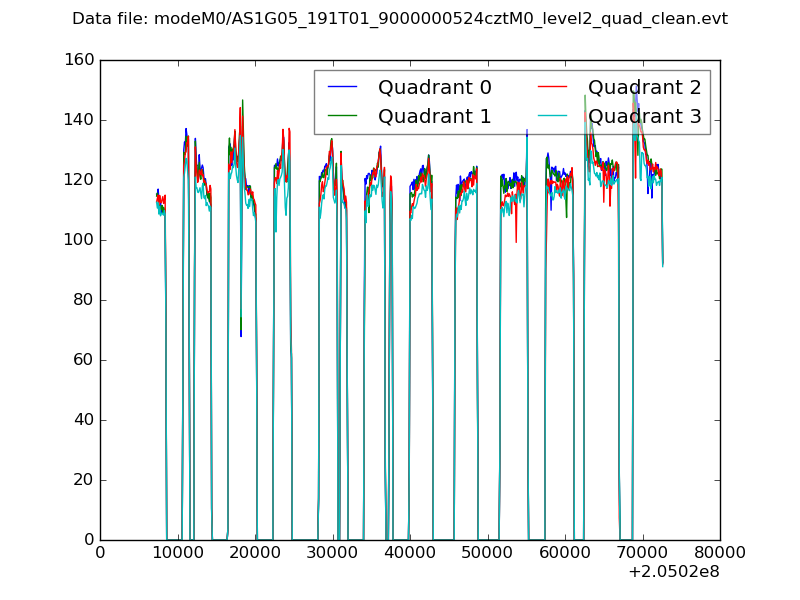 |
|
| Module-wise count rates for Quadrant A Data is divided into 100 sec bins |
 |
 |
| Module-wise count rates for Quadrant B Data is divided into 100 sec bins |
 |
 |
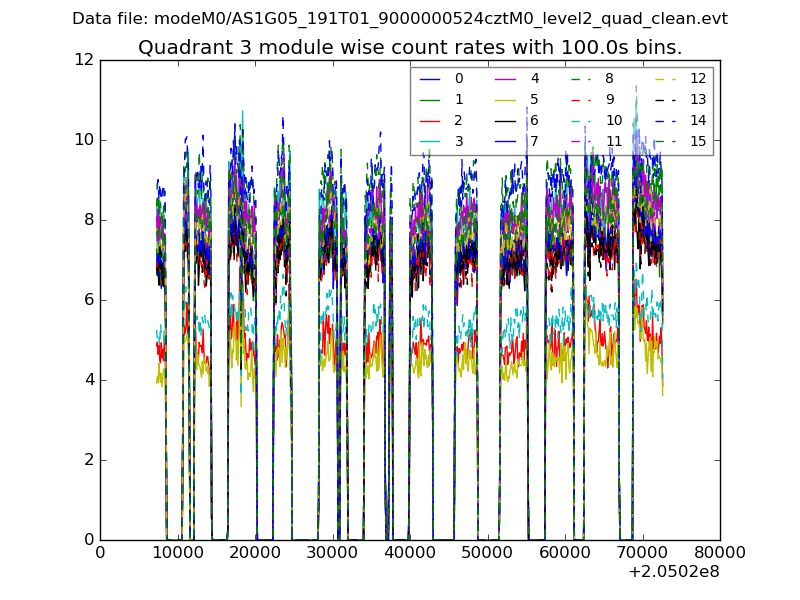
| Module-wise count rates for Quadrant C Data is divided into 100 sec bins |
 |
 |
| Module-wise count rates for Quadrant D Data is divided into 100 sec bins |
 |
 |
| Parameter | Plot |
|---|---|
| CZT HV Monitor | 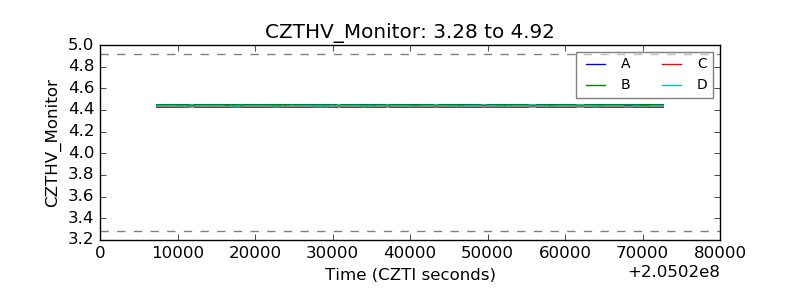 |
| D_VDD | 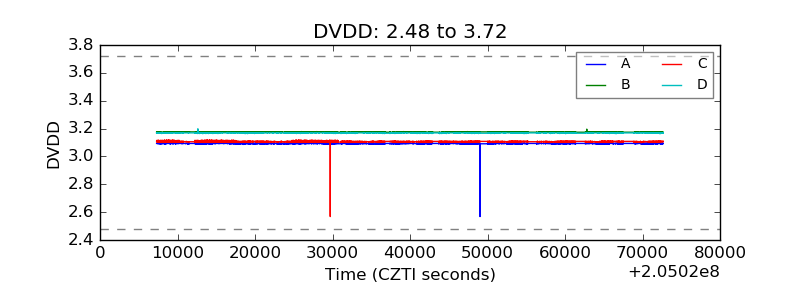 |
| Temperature 1 |  |
| Veto HV Monitor |  |
| Veto LLD |  |
| Alpha Counter |  |
| _CPM_Rate |  |
| CZT Counter | 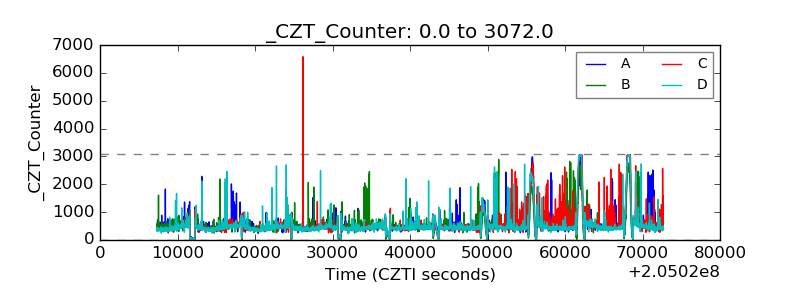 |
| +2.5 Volts monitor |  |
| +5 Volts monitor |  |
| _ROLL_ROT |  |
| _Roll_DEC |  |
| _Roll_RA |  |
| Veto Counter |  |