| Param | Original file | Final file |
|---|---|---|
| Filename | modeM0/AS1G05_191T01_9000000524_04099cztM0_level2.evt | modeM0/AS1G05_191T01_9000000524_04099cztM0_level2_quad_clean.evt |
| Size (bytes) | 382,645,440 | 69,128,640 |
| Size | 364.9 MB | 65.9 MB |
| Events in quadrant A | 2,927,974 | 430,175 |
| Events in quadrant B | 3,032,695 | 427,767 |
| Events in quadrant C | 2,565,037 | 427,519 |
| Events in quadrant D | 2,674,436 | 408,777 |
| Mode M0 | |||
|---|---|---|---|
| Quadrant | BADHDUFLAG | Total packets | Discarded packets |
| A | 0 | 12552 | 2 |
| B | 0 | 12730 | 1 |
| C | 0 | 11675 | 1 |
| D | 0 | 12229 | 1 |
| Mode M9 | |||
|---|---|---|---|
| Quadrant | BADHDUFLAG | Total packets | Discarded packets |
| A | 0 | 7 | 0 |
| B | 0 | 7 | 0 |
| C | 0 | 7 | 0 |
| D | 0 | 7 | 0 |
| Mode SS | |||
|---|---|---|---|
| Quadrant | BADHDUFLAG | Total packets | Discarded packets |
| A | 0 | 114 | 0 |
| B | 0 | 114 | 0 |
| C | 0 | 114 | 0 |
| D | 0 | 114 | 0 |
| Quadrant | Total seconds | Saturated seconds | Saturation percentage |
|---|---|---|---|
| A | 5712 | 40 | 0.700280% |
| B | 5712 | 26 | 0.455182% |
| C | 5712 | 14 | 0.245098% |
| D | 5712 | 34 | 0.595238% |
Noise dominated data is calculated using 1-second bins in cleaned event files. If a bin has >2000 counts, and if more than 50% of those come from <1% of pixels, then it is considered to be noise-dominated and hence unusable.
| Quadrant | # 1 sec bins | Bins with >0 counts | Bins with >2000 counts | High rate bins dominated by noise | Noise dominated (total time) | Noise dominated (detector-on time) | Marked lightcurve |
|---|---|---|---|---|---|---|---|
| A | 6387 | 5713 | 10 | 10 | 0.16% | 0.18% | 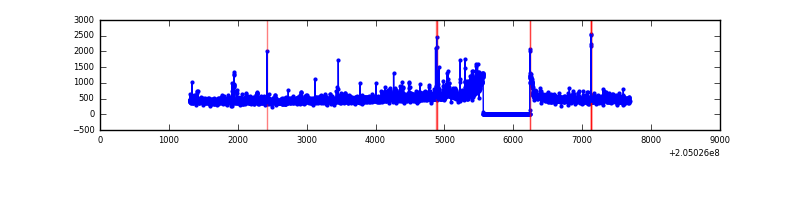 |
| B | 6387 | 5713 | 2 | 2 | 0.03% | 0.04% | 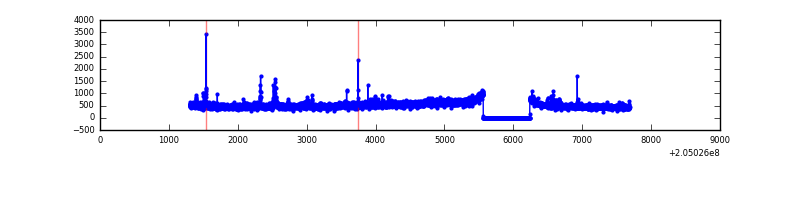 |
| C | 6387 | 5713 | 0 | 0 | 0.00% | 0.00% | 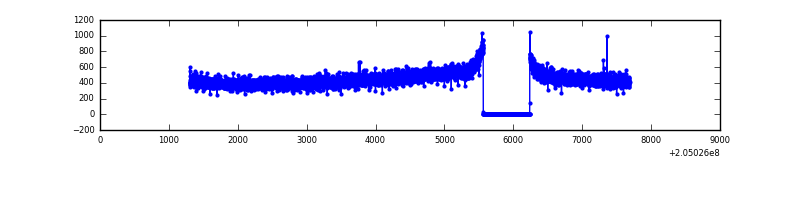 |
| D | 6387 | 5713 | 30 | 30 | 0.47% | 0.53% | 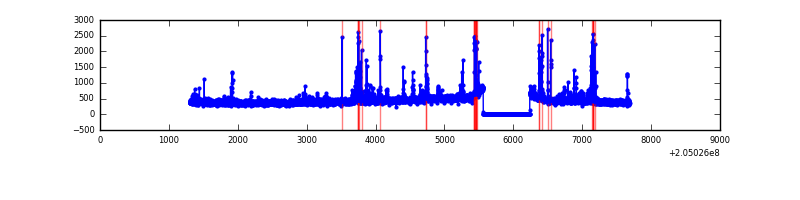 |
Top three noisy pixels from each quadrant. If the there are fewer than three noisy pixels in the level2.evt file, extra rows are filled as -1
| Pixel properties | Quadrant properties | ||||||
|---|---|---|---|---|---|---|---|
| Quadrant | DetID | PixID | Counts | Sigma | Mean | Median | Sigma |
| A | 0 | 199 | 272694 | 1994.95 | 666 | 655 | 136.4 |
| A | 0 | 50 | 31459 | 225.9 | 666 | 655 | 136.4 |
| A | 0 | 226 | 31061 | 222.98 | 666 | 655 | 136.4 |
| B | 3 | 0 | 312716 | 2409.27 | 674 | 661 | 129.5 |
| B | 10 | 16 | 48187 | 366.93 | 674 | 661 | 129.5 |
| B | 14 | 167 | 27963 | 210.79 | 674 | 661 | 129.5 |
| C | 8 | 128 | 19208 | 122.18 | 648 | 654 | 151.9 |
| C | 8 | 112 | 7552 | 45.42 | 648 | 654 | 151.9 |
| C | 8 | 144 | 7331 | 43.97 | 648 | 654 | 151.9 |
| D | 13 | 239 | 94669 | 611.03 | 640 | 624 | 153.9 |
| D | 10 | 172 | 81471 | 525.28 | 640 | 624 | 153.9 |
| D | 2 | 14 | 40360 | 258.17 | 640 | 624 | 153.9 |
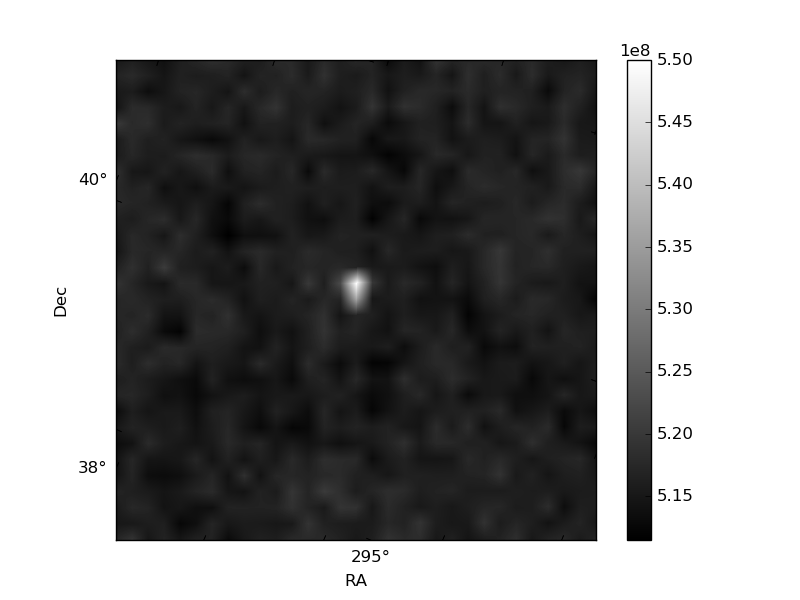
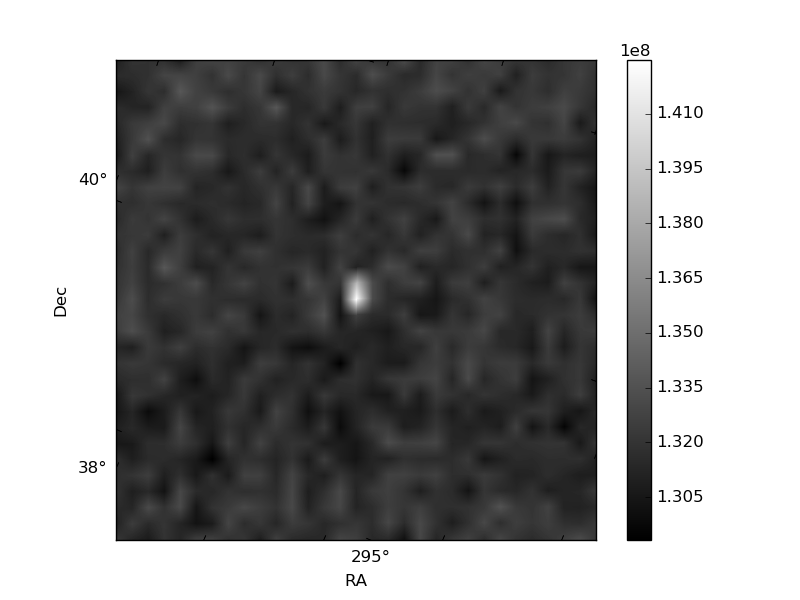
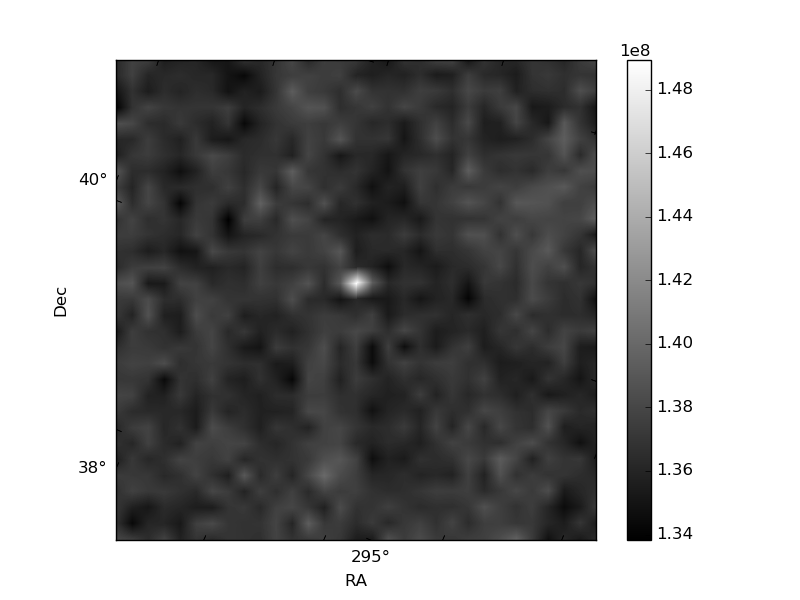
Histogram calculated using DETX and DETY for each event in the final _common_clean file
| Quadrant A | 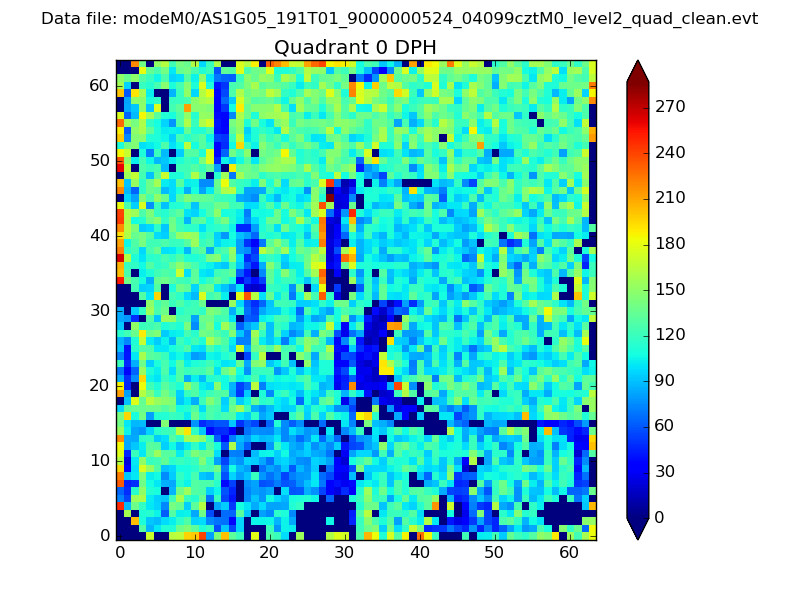 |
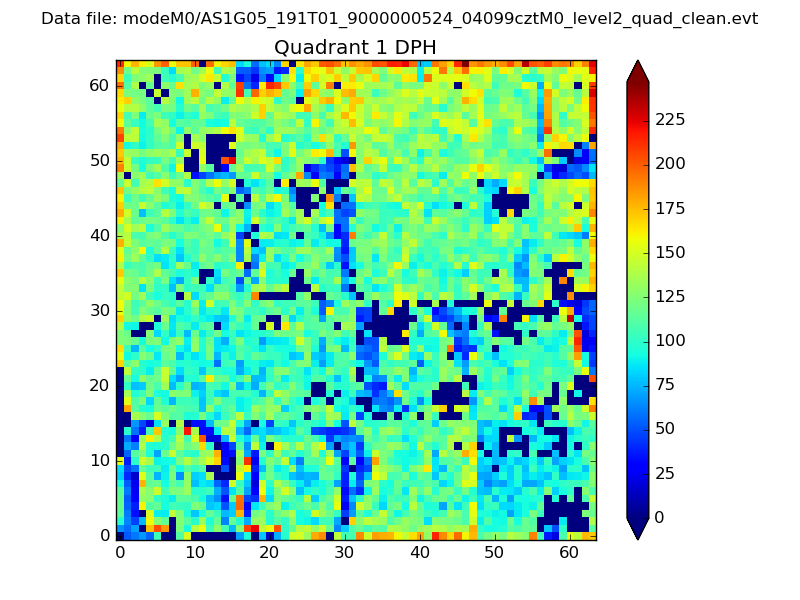 |
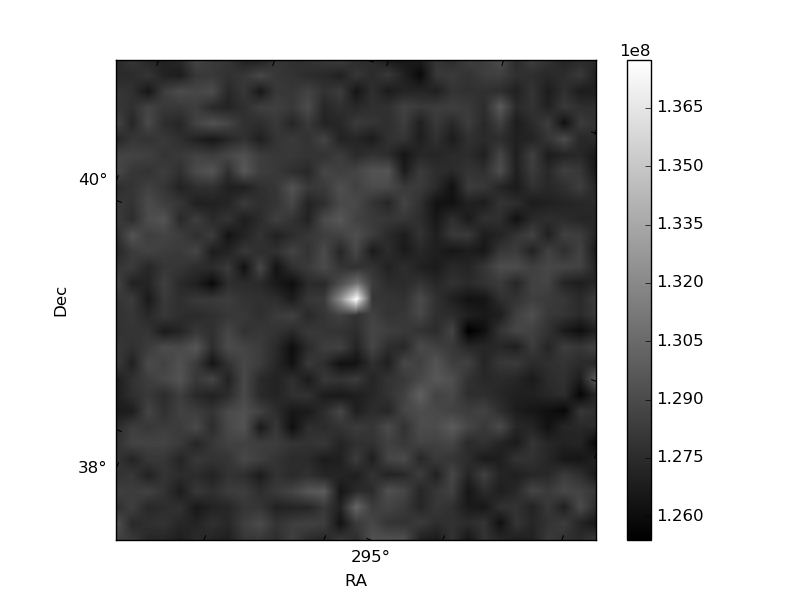
Quadrant B |
|---|---|---|---|
| Quadrant D | 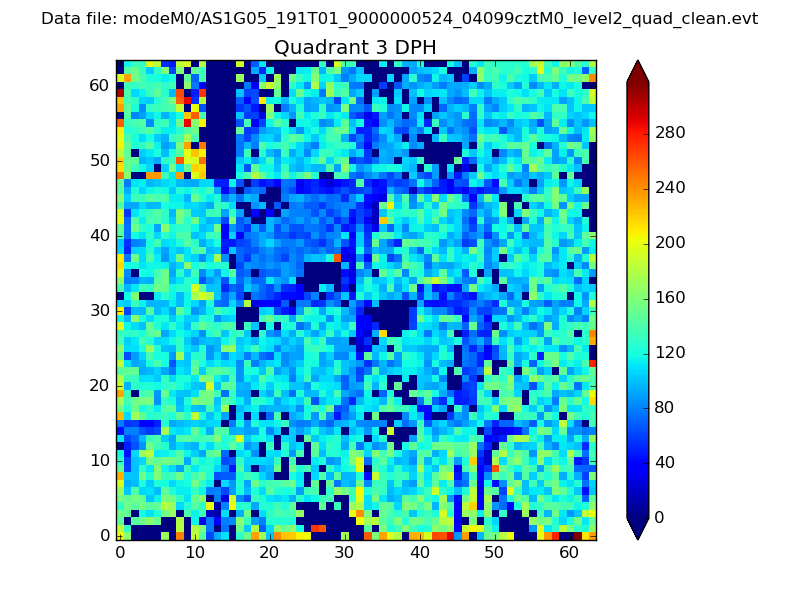 |
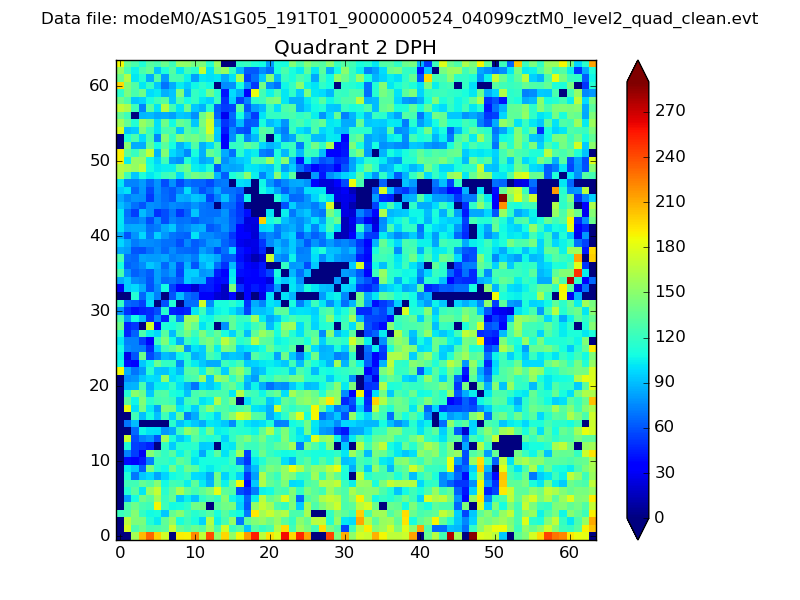 |
Quadrant C |
| Plot type | Count rate plots | Images |
|---|---|---|
| Comparison with Poisson distribution Blue bars denote a histogram of data divided into 1 sec bins. Red curve is a Poisson curve with rate = median count rate of data. |
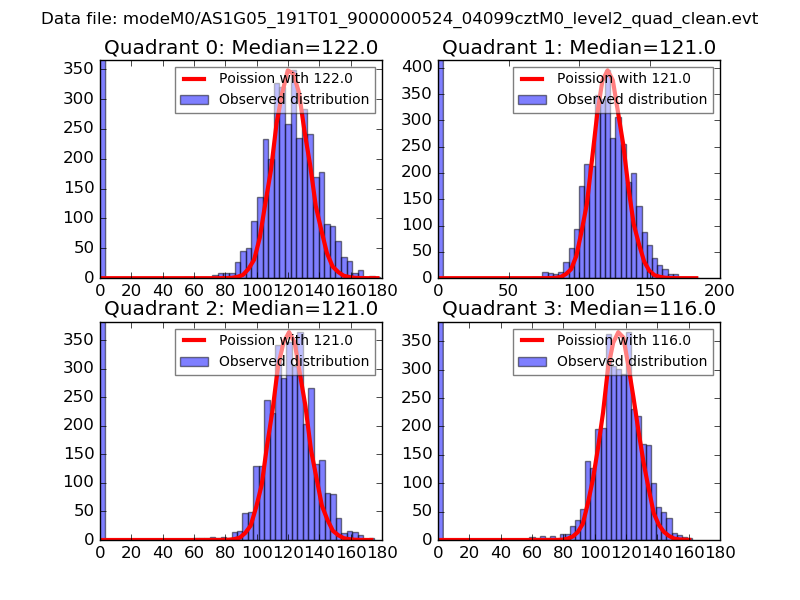 |
 |
| Quadrant-wise count rates Data is divided into 100 sec bins |
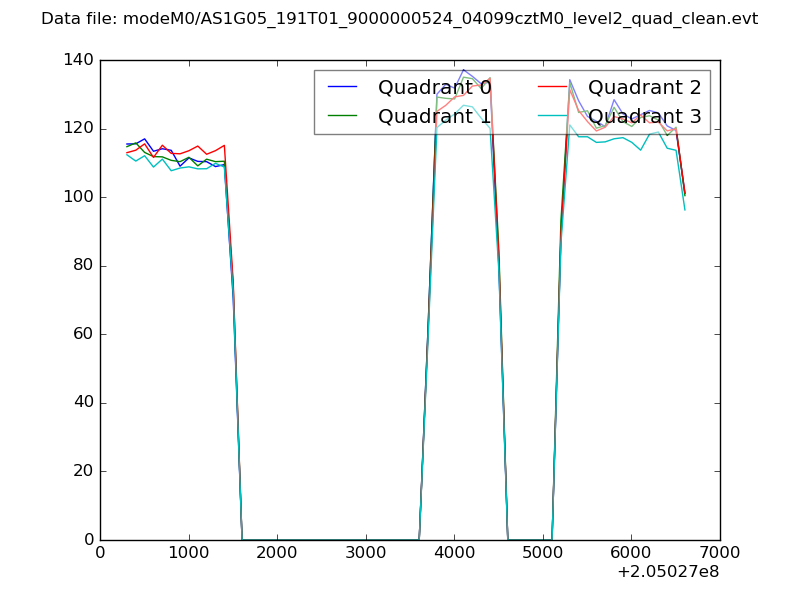 |
|
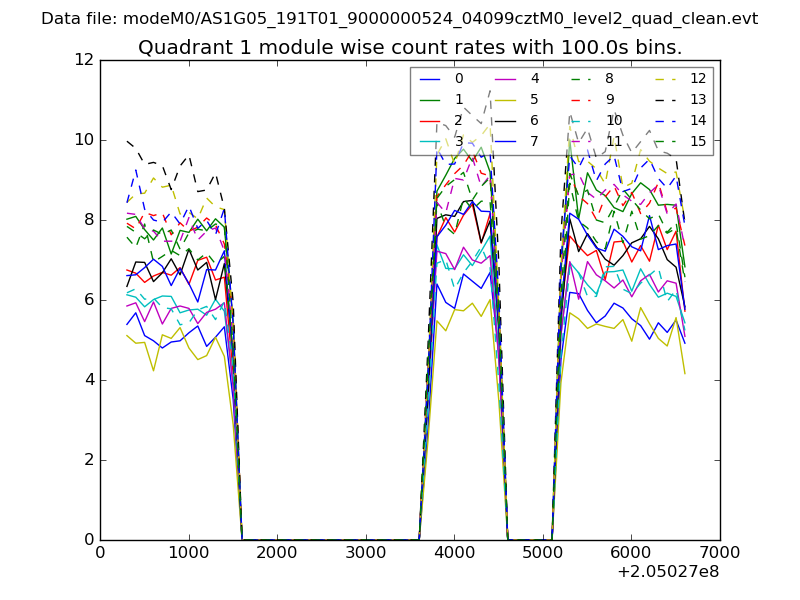
| Module-wise count rates for Quadrant A Data is divided into 100 sec bins |
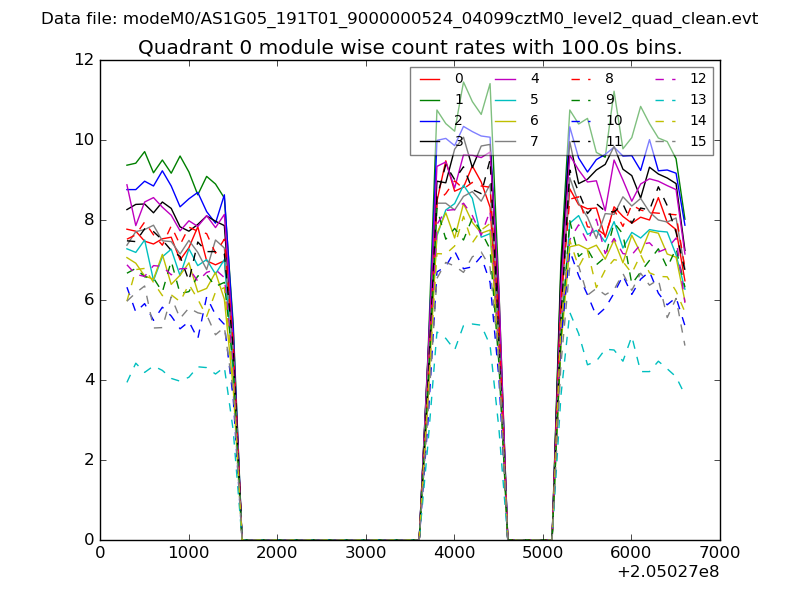 |
 |
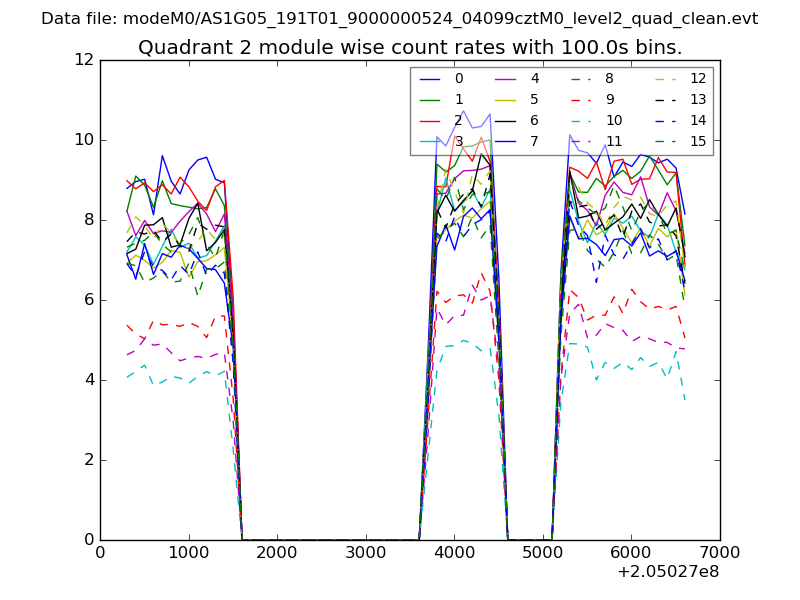
| Module-wise count rates for Quadrant B Data is divided into 100 sec bins |
 |
 |
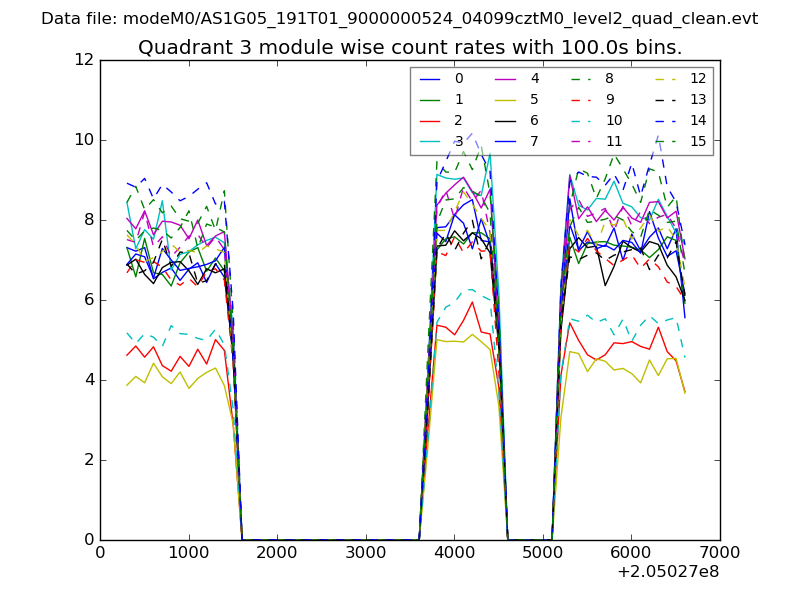
| Module-wise count rates for Quadrant C Data is divided into 100 sec bins |
 |
 |
| Module-wise count rates for Quadrant D Data is divided into 100 sec bins |
 |
 |
| Parameter | Plot |
|---|---|
| CZT HV Monitor | 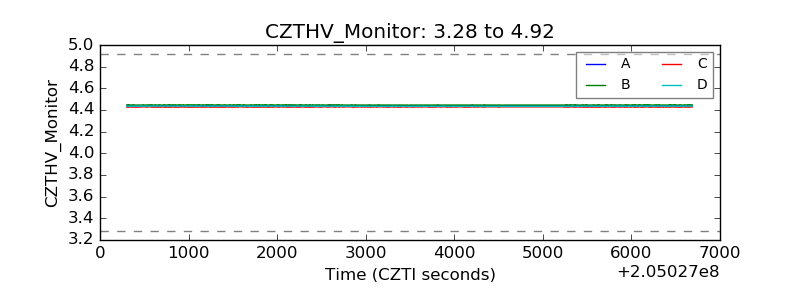 |
| D_VDD |  |
| Temperature 1 | 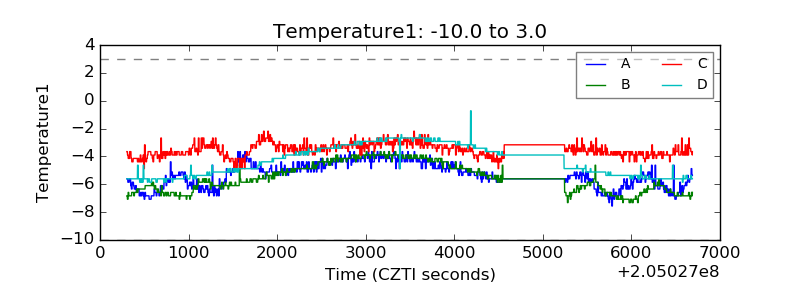 |
| Veto HV Monitor | 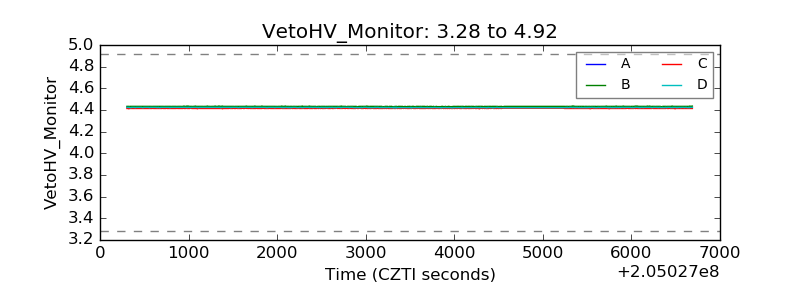 |
| Veto LLD | 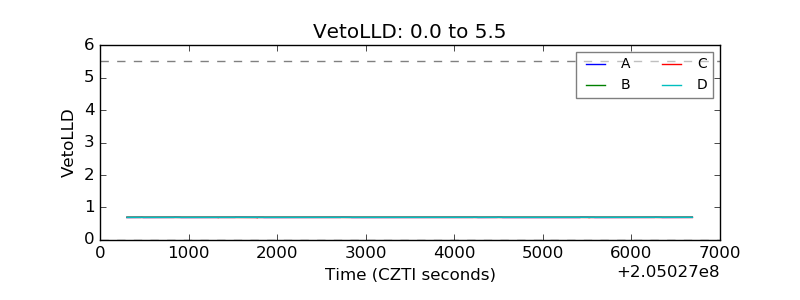 |
| Alpha Counter | 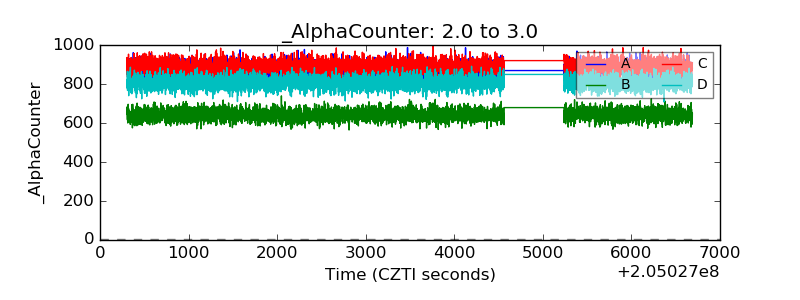 |
| _CPM_Rate | 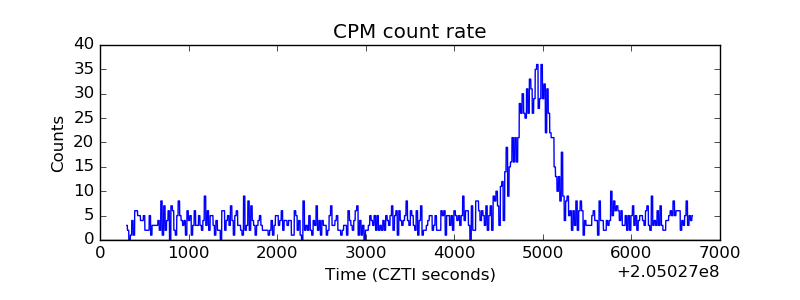 |
| CZT Counter | 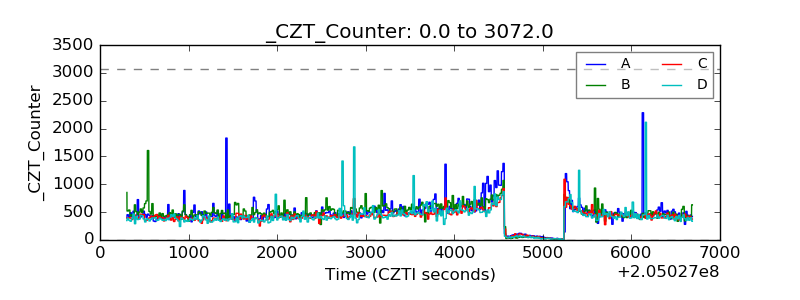 |
| +2.5 Volts monitor |  |
| +5 Volts monitor |  |
| _ROLL_ROT | 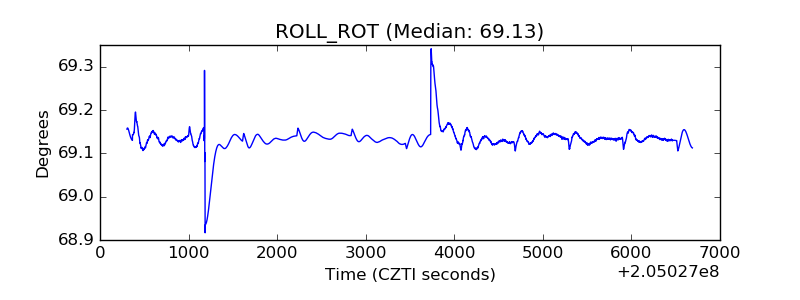 |
| _Roll_DEC | 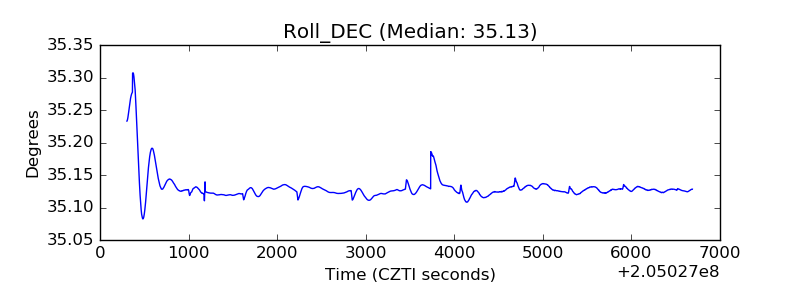 |
| _Roll_RA | 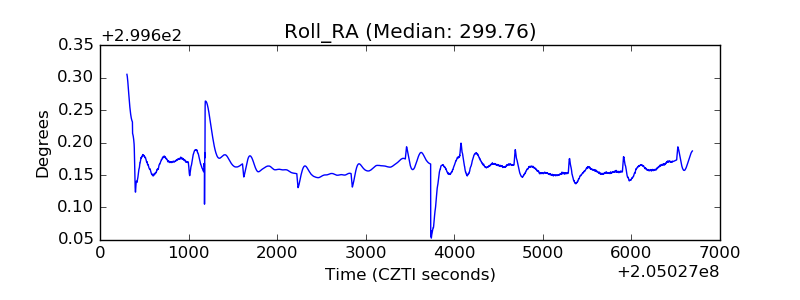 |
| Veto Counter | 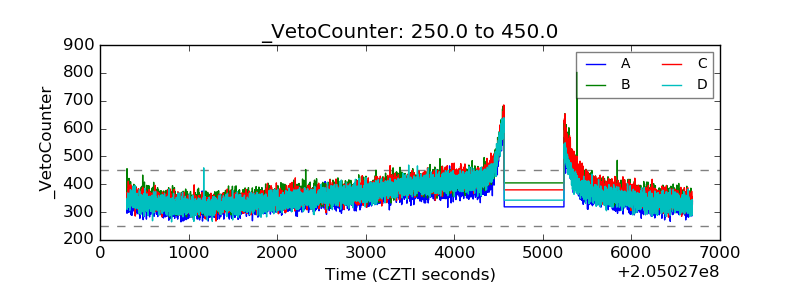 |