| Param | Original file | Final file |
|---|---|---|
| Filename | modeM0/AS1G05_191T01_9000000524_04100cztM0_level2.evt | modeM0/AS1G05_191T01_9000000524_04100cztM0_level2_quad_clean.evt |
| Size (bytes) | 506,485,440 | 101,551,680 |
| Size | 483.0 MB | 96.8 MB |
| Events in quadrant A | 4,199,356 | 643,370 |
| Events in quadrant B | 3,699,317 | 648,099 |
| Events in quadrant C | 3,438,800 | 645,320 |
| Events in quadrant D | 3,496,421 | 621,255 |
| Mode M0 | |||
|---|---|---|---|
| Quadrant | BADHDUFLAG | Total packets | Discarded packets |
| A | 0 | 17446 | 2 |
| B | 0 | 15886 | 1 |
| C | 0 | 15419 | 1 |
| D | 0 | 15895 | 1 |
| Mode M9 | |||
|---|---|---|---|
| Quadrant | BADHDUFLAG | Total packets | Discarded packets |
| A | 0 | 1 | 0 |
| B | 0 | 1 | 0 |
| C | 0 | 1 | 0 |
| D | 0 | 1 | 0 |
| Mode SS | |||
|---|---|---|---|
| Quadrant | BADHDUFLAG | Total packets | Discarded packets |
| A | 0 | 150 | 0 |
| B | 0 | 150 | 0 |
| C | 0 | 150 | 0 |
| D | 0 | 150 | 0 |
| Quadrant | Total seconds | Saturated seconds | Saturation percentage |
|---|---|---|---|
| A | 7435 | 260 | 3.496974% |
| B | 7435 | 245 | 3.295225% |
| C | 7435 | 105 | 1.412239% |
| D | 7435 | 129 | 1.735037% |
Noise dominated data is calculated using 1-second bins in cleaned event files. If a bin has >2000 counts, and if more than 50% of those come from <1% of pixels, then it is considered to be noise-dominated and hence unusable.
| Quadrant | # 1 sec bins | Bins with >0 counts | Bins with >2000 counts | High rate bins dominated by noise | Noise dominated (total time) | Noise dominated (detector-on time) | Marked lightcurve |
|---|---|---|---|---|---|---|---|
| A | 7490 | 7436 | 12 | 12 | 0.16% | 0.16% | 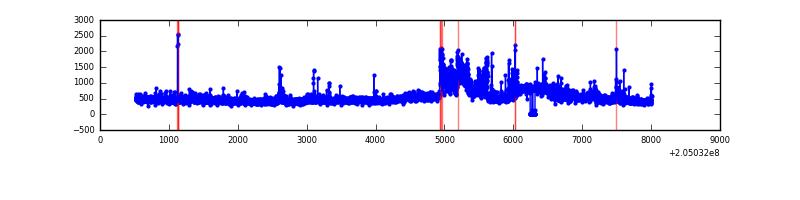 |
| B | 7490 | 7435 | 1 | 1 | 0.01% | 0.01% | 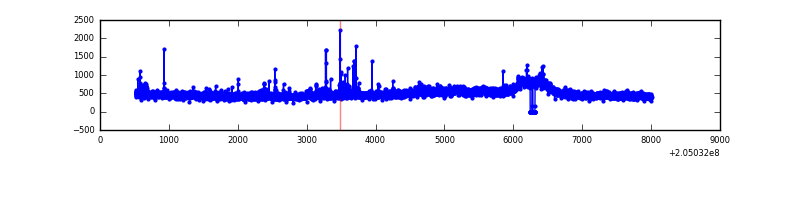 |
| C | 7490 | 7437 | 0 | 0 | 0.00% | 0.00% | 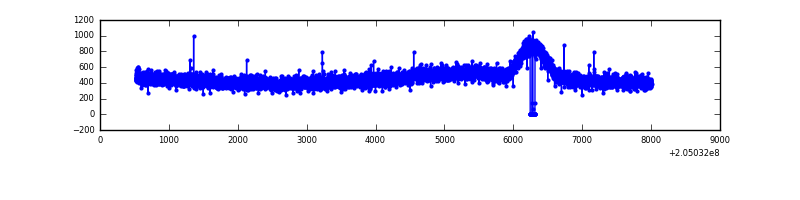 |
| D | 7490 | 7435 | 34 | 34 | 0.45% | 0.46% | 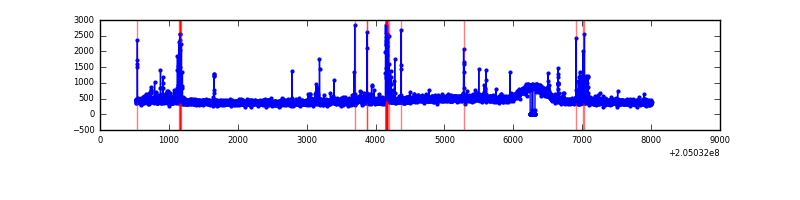 |
Top three noisy pixels from each quadrant. If the there are fewer than three noisy pixels in the level2.evt file, extra rows are filled as -1
| Pixel properties | Quadrant properties | ||||||
|---|---|---|---|---|---|---|---|
| Quadrant | DetID | PixID | Counts | Sigma | Mean | Median | Sigma |
| A | 0 | 199 | 673400 | 3691.51 | 887 | 868 | 182.2 |
| A | 0 | 226 | 68301 | 370.14 | 887 | 868 | 182.2 |
| A | 8 | 15 | 25035 | 132.65 | 887 | 868 | 182.2 |
| B | 3 | 0 | 102258 | 586.4 | 901 | 882 | 172.9 |
| B | 10 | 16 | 50822 | 288.87 | 901 | 882 | 172.9 |
| B | 15 | 204 | 21565 | 119.64 | 901 | 882 | 172.9 |
| C | 8 | 128 | 22303 | 105.08 | 870 | 877 | 203.9 |
| C | 8 | 144 | 8785 | 38.78 | 870 | 877 | 203.9 |
| C | 8 | 112 | 8211 | 35.97 | 870 | 877 | 203.9 |
| D | 10 | 172 | 110622 | 521.74 | 862 | 837 | 210.4 |
| D | 13 | 239 | 76969 | 361.81 | 862 | 837 | 210.4 |
| D | 2 | 14 | 36239 | 168.24 | 862 | 837 | 210.4 |
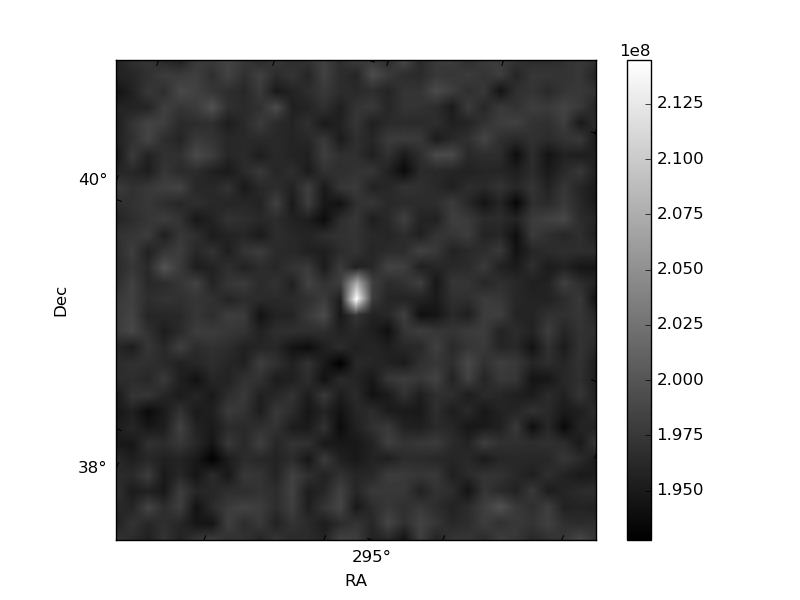
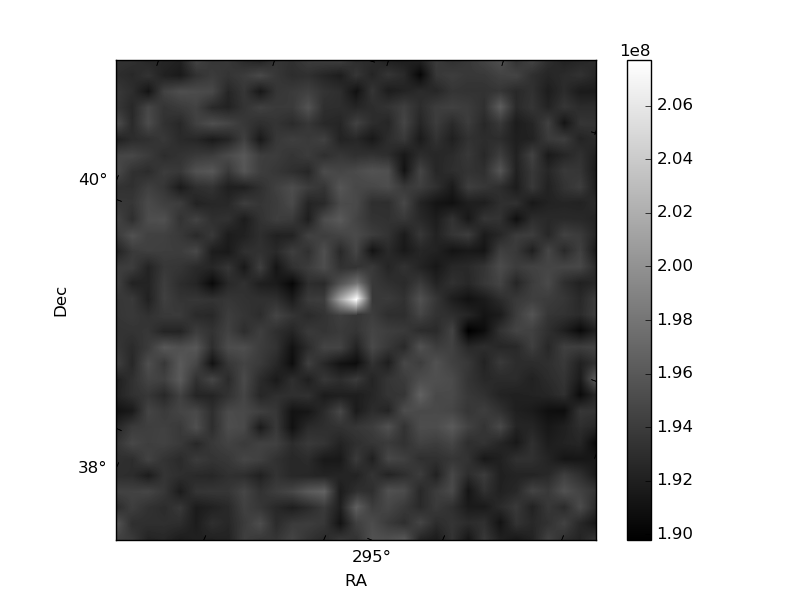
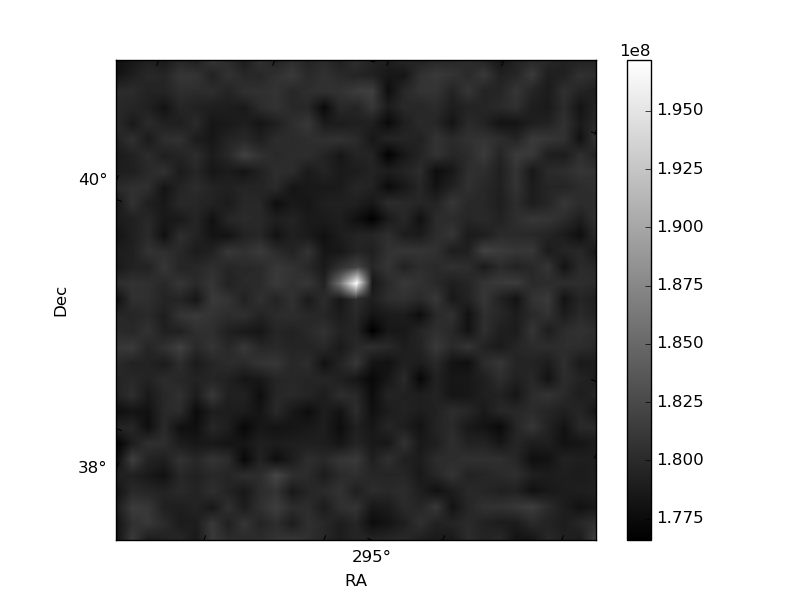
Histogram calculated using DETX and DETY for each event in the final _common_clean file
| Quadrant A | 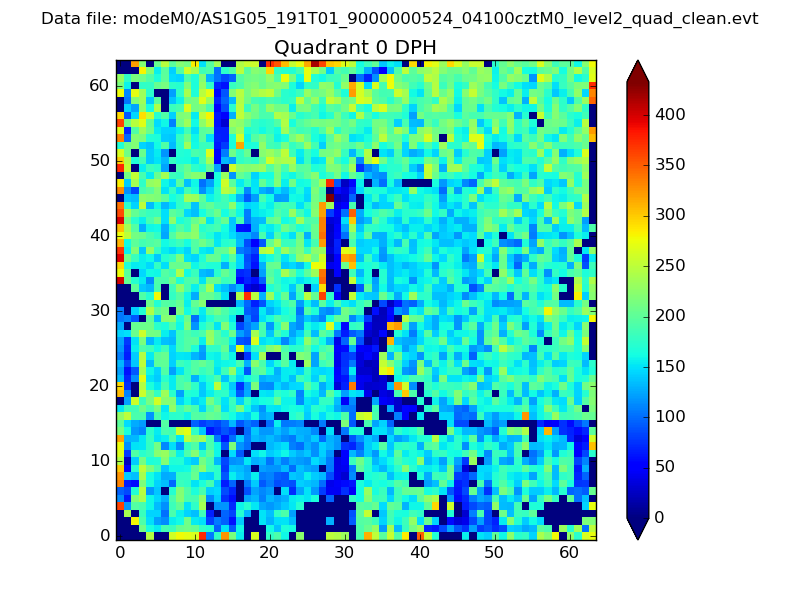 |
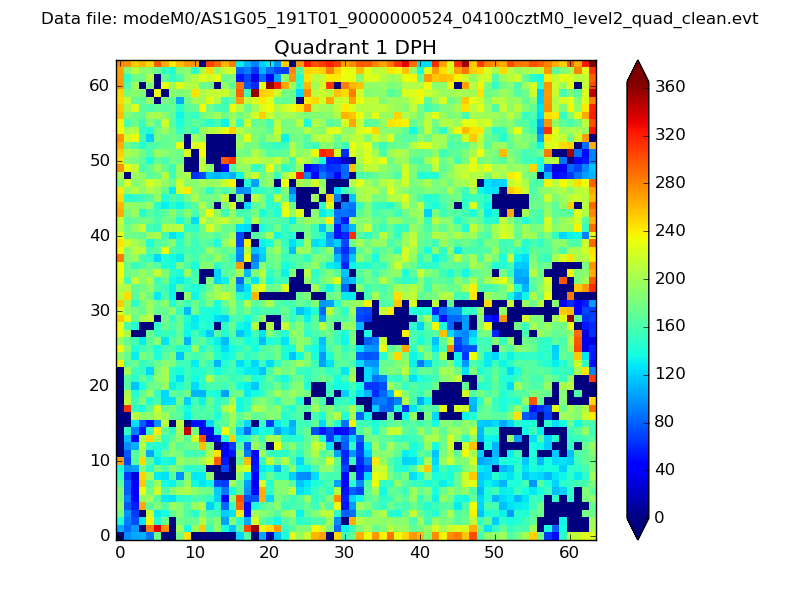 |
Quadrant B |
|---|---|---|---|
| Quadrant D | 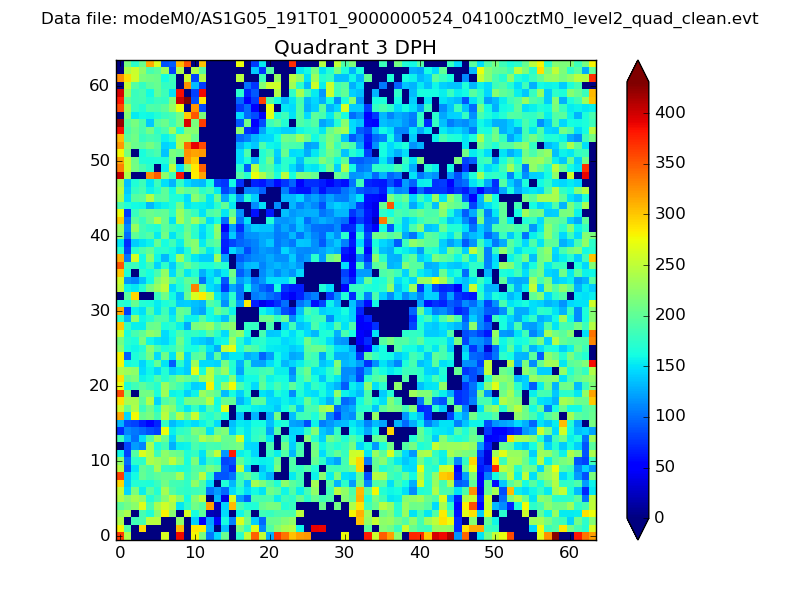 |
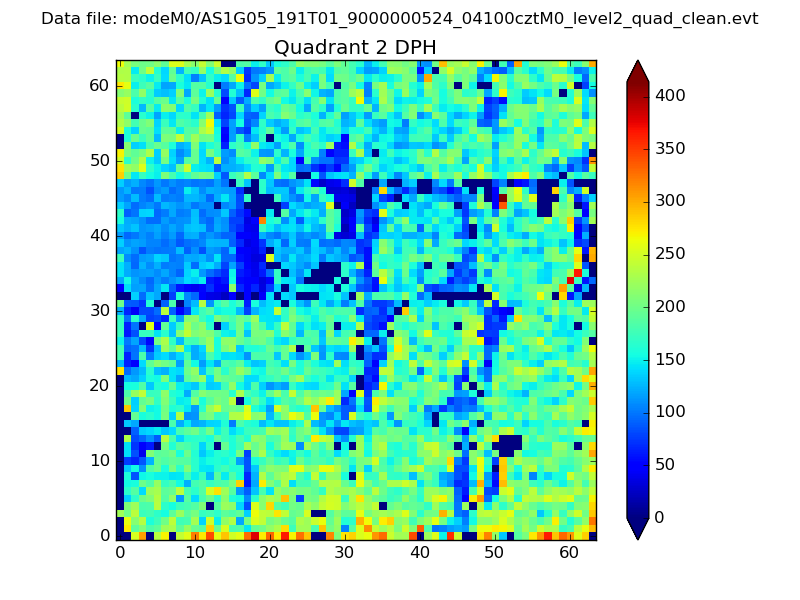 |
Quadrant C |
| Plot type | Count rate plots | Images |
|---|---|---|
| Comparison with Poisson distribution Blue bars denote a histogram of data divided into 1 sec bins. Red curve is a Poisson curve with rate = median count rate of data. |
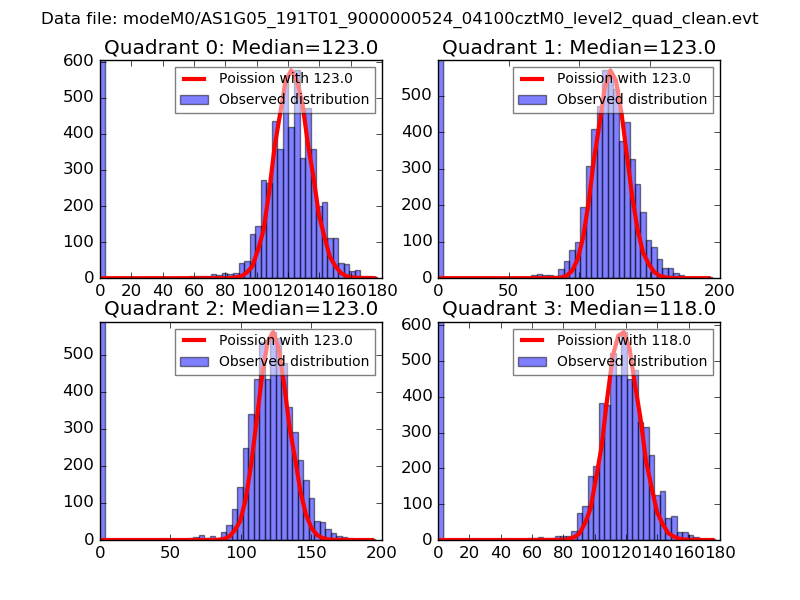 |
 |
| Quadrant-wise count rates Data is divided into 100 sec bins |
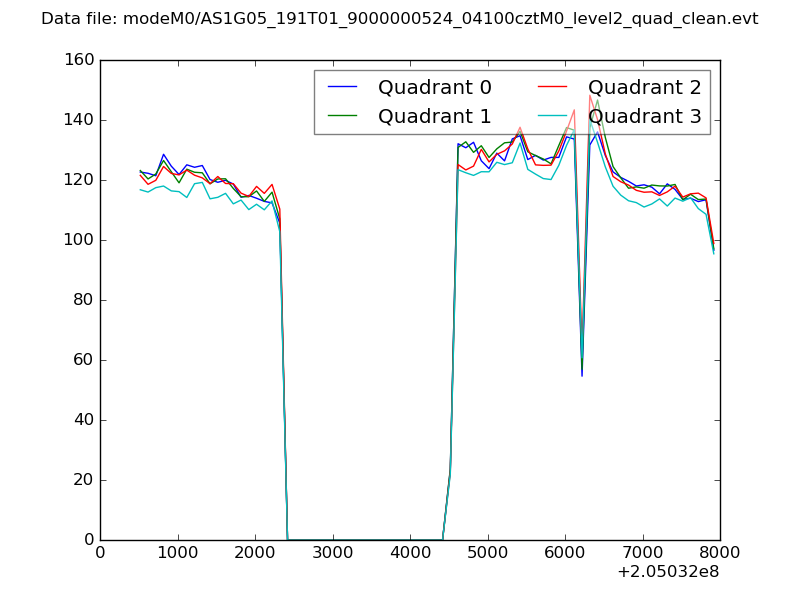 |
|
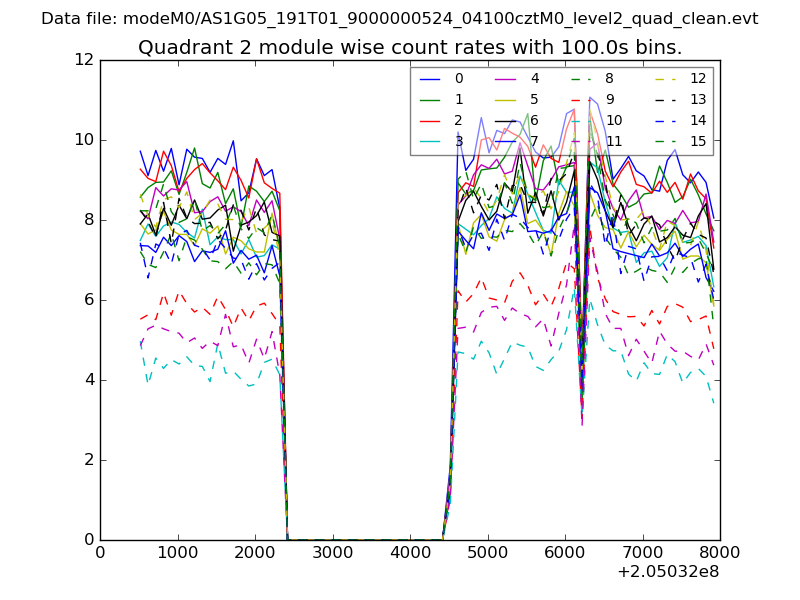
| Module-wise count rates for Quadrant A Data is divided into 100 sec bins |
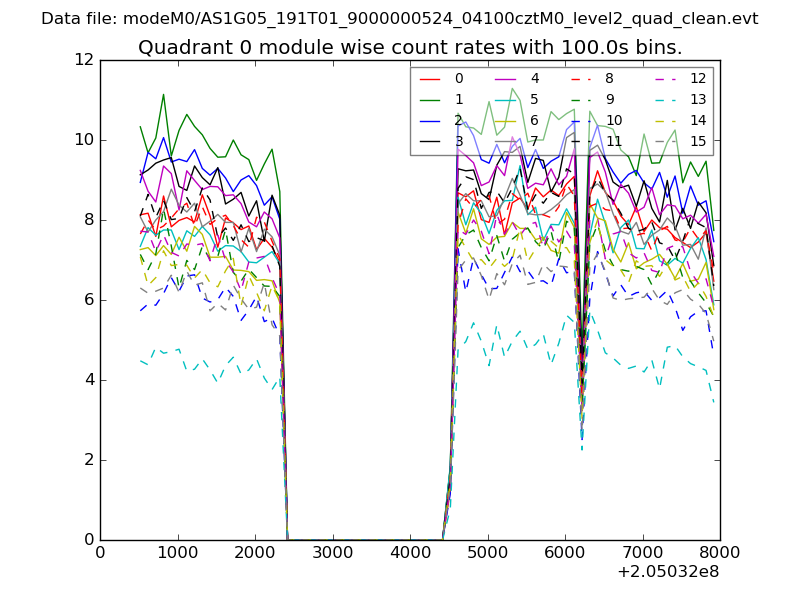 |
 |
| Module-wise count rates for Quadrant B Data is divided into 100 sec bins |
 |
 |
| Module-wise count rates for Quadrant C Data is divided into 100 sec bins |
 |
 |
| Module-wise count rates for Quadrant D Data is divided into 100 sec bins |
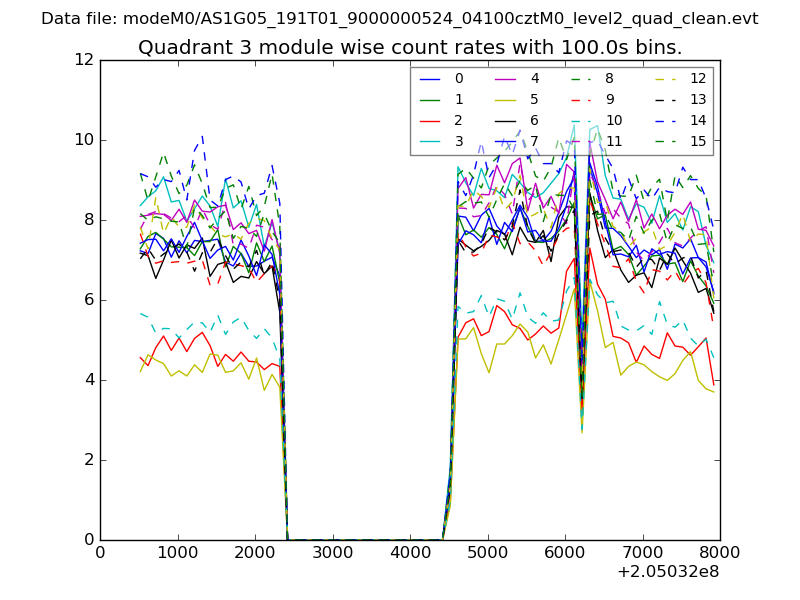 |
 |
| Parameter | Plot |
|---|---|
| CZT HV Monitor | 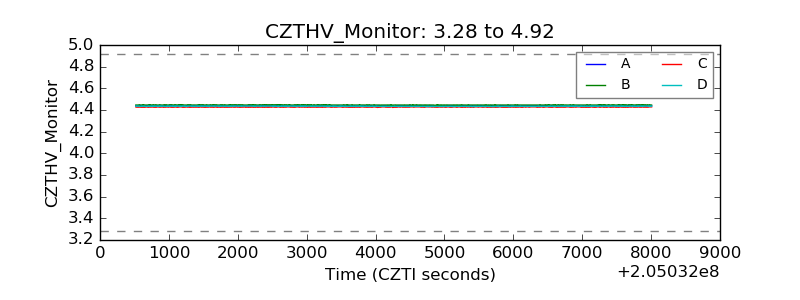 |
| D_VDD | 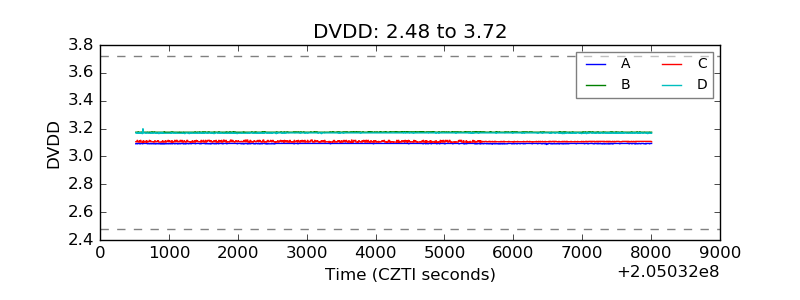 |
| Temperature 1 | 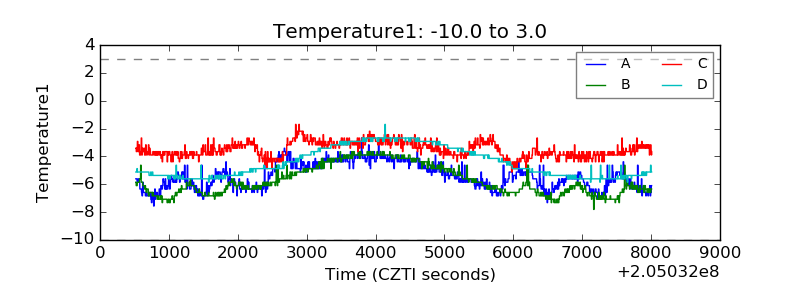 |
| Veto HV Monitor | 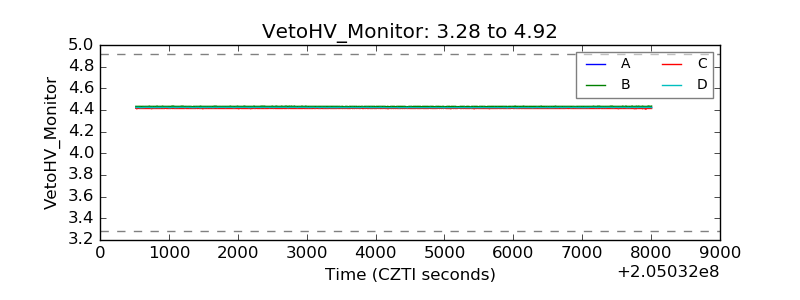 |
| Veto LLD | 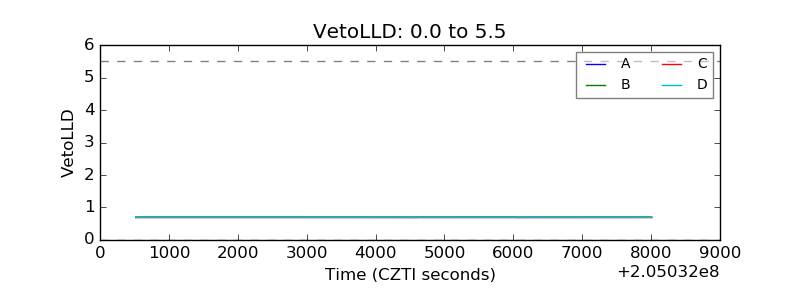 |
| Alpha Counter | 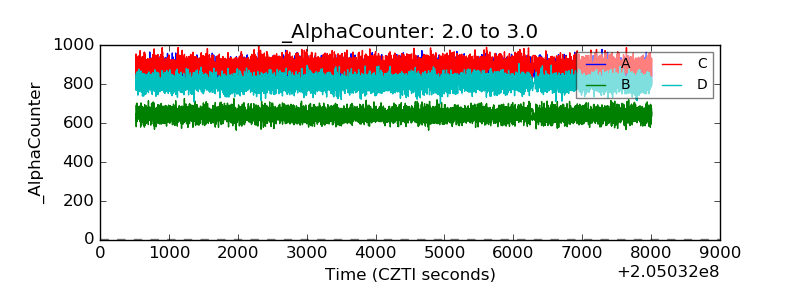 |
| _CPM_Rate | 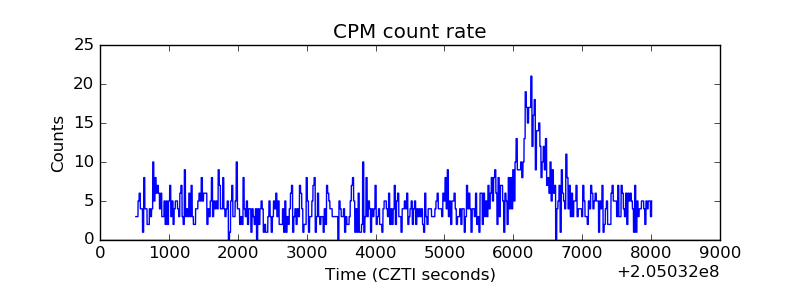 |
| CZT Counter | 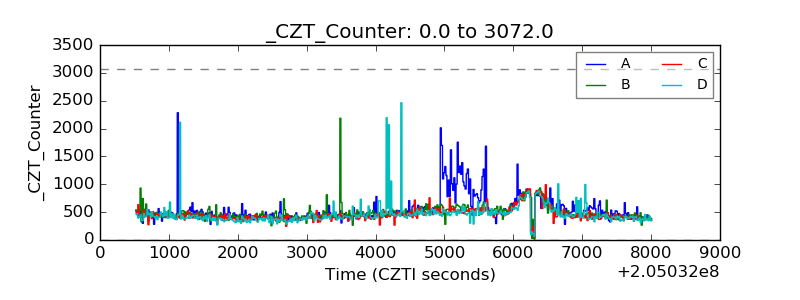 |
| +2.5 Volts monitor |  |
| +5 Volts monitor |  |
| _ROLL_ROT | 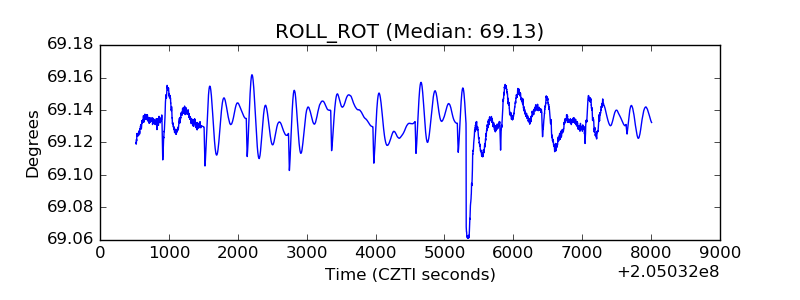 |
| _Roll_DEC | 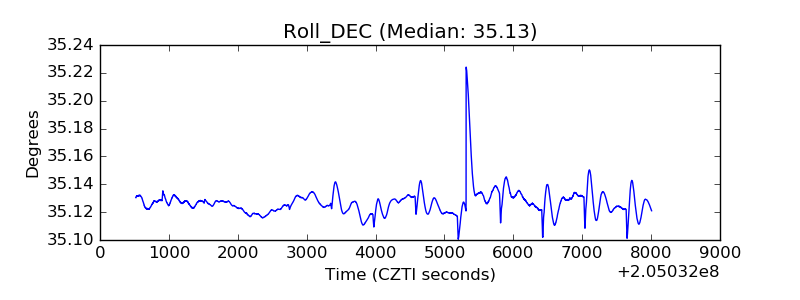 |
| _Roll_RA | 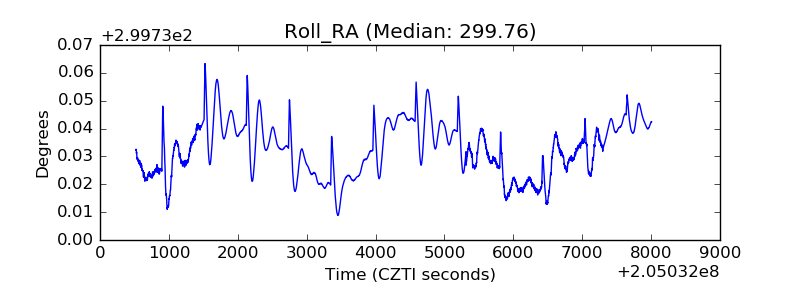 |
| Veto Counter | 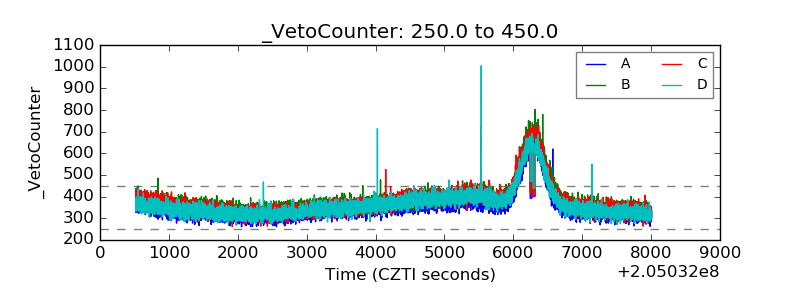 |