| Param | Original file | Final file |
|---|---|---|
| Filename | modeM0/AS1G05_191T01_9000000524_04102cztM0_level2.evt | modeM0/AS1G05_191T01_9000000524_04102cztM0_level2_quad_clean.evt |
| Size (bytes) | 314,438,400 | 55,938,240 |
| Size | 299.9 MB | 53.3 MB |
| Events in quadrant A | 2,321,685 | 341,027 |
| Events in quadrant B | 2,458,427 | 340,164 |
| Events in quadrant C | 2,212,001 | 336,694 |
| Events in quadrant D | 2,189,183 | 324,694 |
| Mode M0 | |||
|---|---|---|---|
| Quadrant | BADHDUFLAG | Total packets | Discarded packets |
| A | 0 | 10189 | 4 |
| B | 0 | 10620 | 3 |
| C | 0 | 10109 | 1 |
| D | 0 | 10312 | 1 |
| Mode SS | |||
|---|---|---|---|
| Quadrant | BADHDUFLAG | Total packets | Discarded packets |
| A | 0 | 100 | 0 |
| B | 0 | 100 | 0 |
| C | 0 | 100 | 0 |
| D | 0 | 100 | 0 |
| Quadrant | Total seconds | Saturated seconds | Saturation percentage |
|---|---|---|---|
| A | 5005 | 10 | 0.199800% |
| B | 5005 | 18 | 0.359640% |
| C | 5006 | 3 | 0.059928% |
| D | 5006 | 12 | 0.239712% |
Noise dominated data is calculated using 1-second bins in cleaned event files. If a bin has >2000 counts, and if more than 50% of those come from <1% of pixels, then it is considered to be noise-dominated and hence unusable.
| Quadrant | # 1 sec bins | Bins with >0 counts | Bins with >2000 counts | High rate bins dominated by noise | Noise dominated (total time) | Noise dominated (detector-on time) | Marked lightcurve |
|---|---|---|---|---|---|---|---|
| A | 5006 | 5006 | 1 | 1 | 0.02% | 0.02% | 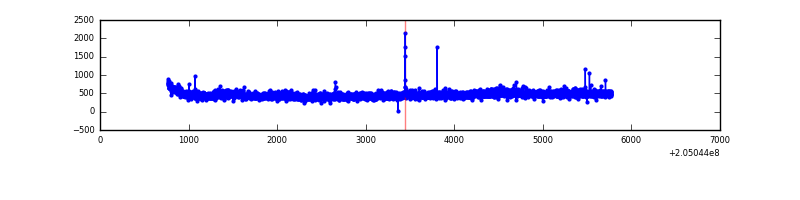 |
| B | 5006 | 5006 | 8 | 8 | 0.16% | 0.16% | 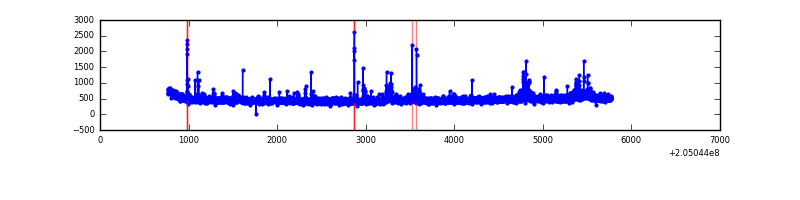 |
| C | 5006 | 5006 | 0 | 0 | 0.00% | 0.00% | 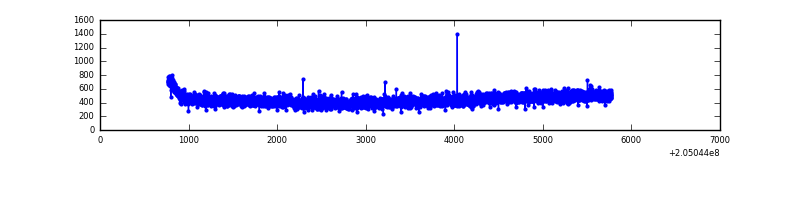 |
| D | 5006 | 5006 | 13 | 13 | 0.26% | 0.26% |  |
Top three noisy pixels from each quadrant. If the there are fewer than three noisy pixels in the level2.evt file, extra rows are filled as -1
| Pixel properties | Quadrant properties | ||||||
|---|---|---|---|---|---|---|---|
| Quadrant | DetID | PixID | Counts | Sigma | Mean | Median | Sigma |
| A | 0 | 199 | 72131 | 599.95 | 574 | 563 | 119.3 |
| A | 8 | 15 | 15306 | 123.59 | 574 | 563 | 119.3 |
| A | 0 | 50 | 13607 | 109.35 | 574 | 563 | 119.3 |
| B | 14 | 167 | 85531 | 758.02 | 579 | 566 | 112.1 |
| B | 10 | 16 | 51798 | 457.07 | 579 | 566 | 112.1 |
| B | 15 | 204 | 42479 | 373.93 | 579 | 566 | 112.1 |
| C | 8 | 128 | 21445 | 158.88 | 556 | 560 | 131.5 |
| C | 8 | 144 | 8279 | 58.72 | 556 | 560 | 131.5 |
| C | 8 | 112 | 7580 | 53.4 | 556 | 560 | 131.5 |
| D | 13 | 239 | 45212 | 329.02 | 554 | 538 | 135.8 |
| D | 10 | 172 | 35090 | 254.47 | 554 | 538 | 135.8 |
| D | 2 | 14 | 14169 | 100.39 | 554 | 538 | 135.8 |
Histogram calculated using DETX and DETY for each event in the final _common_clean file
| Quadrant A | 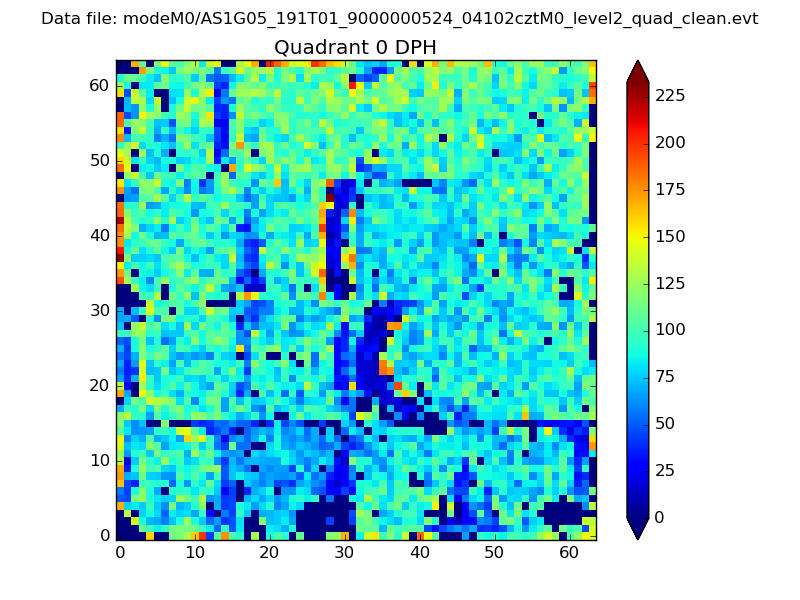 |
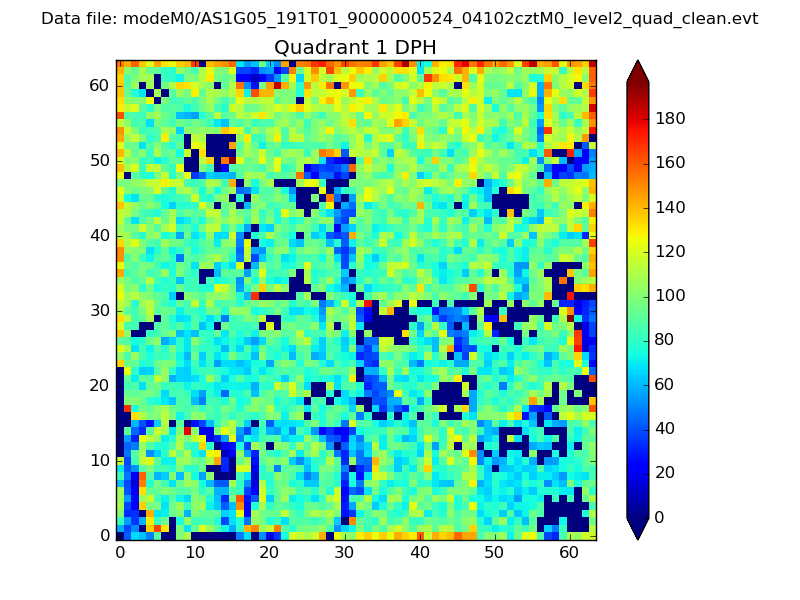 |
Quadrant B |
|---|---|---|---|
| Quadrant D | 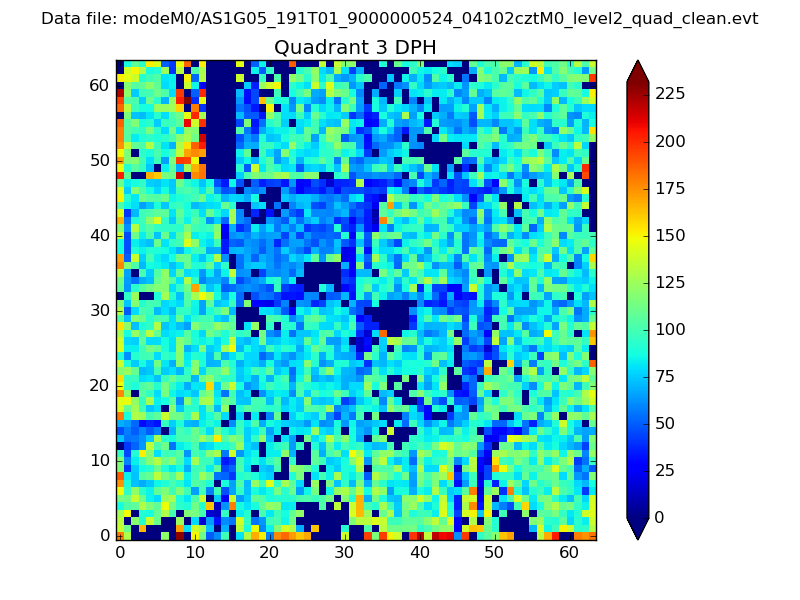 |
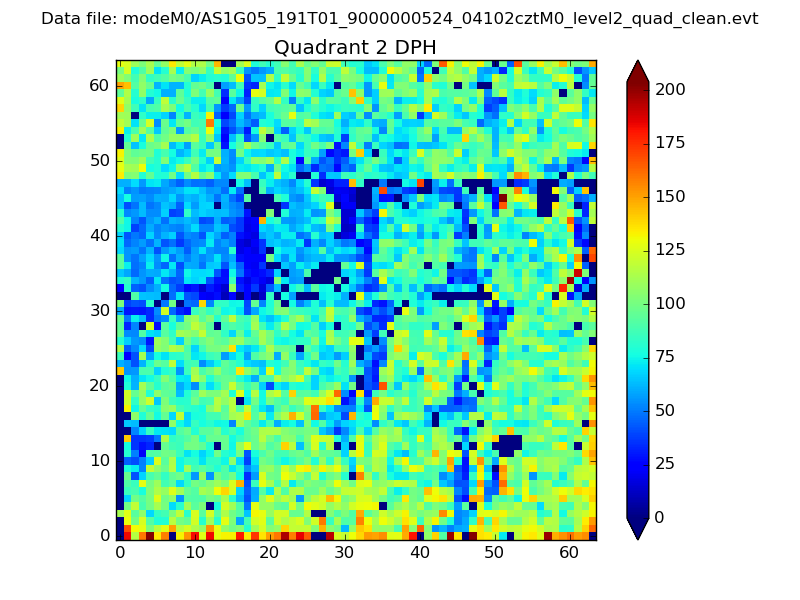 |
Quadrant C |
| Plot type | Count rate plots | Images |
|---|---|---|
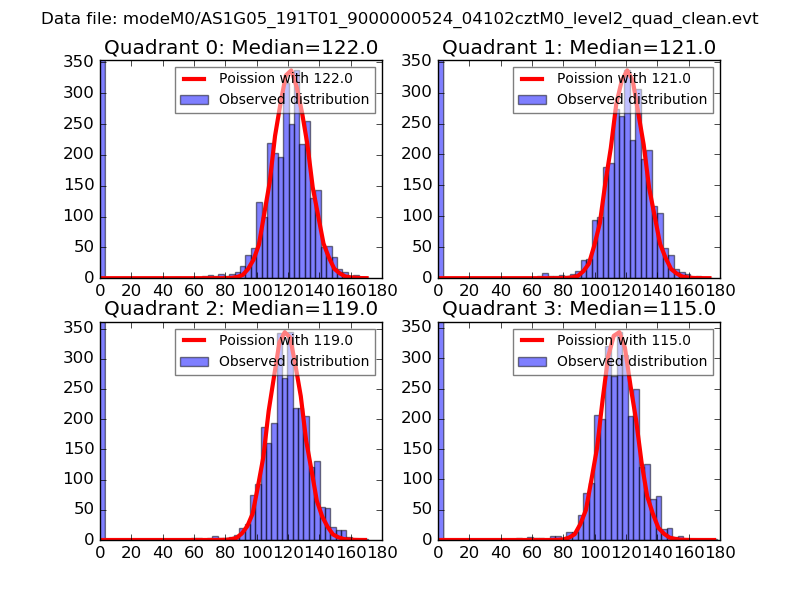
| Comparison with Poisson distribution Blue bars denote a histogram of data divided into 1 sec bins. Red curve is a Poisson curve with rate = median count rate of data. |
 |
 |
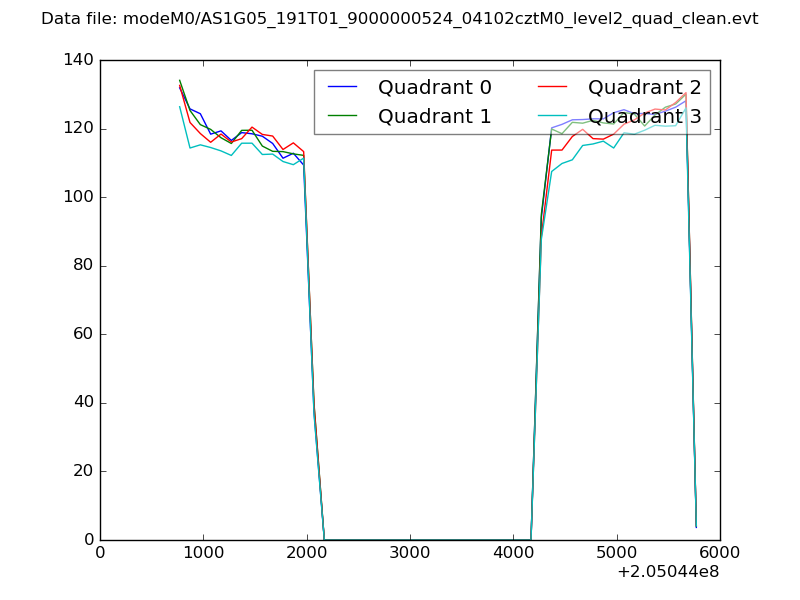
| Quadrant-wise count rates Data is divided into 100 sec bins |
 |
|
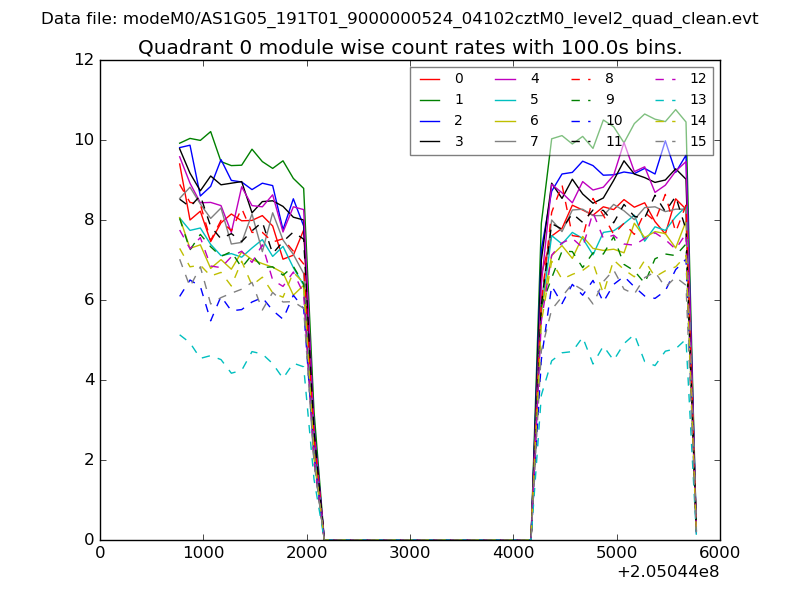
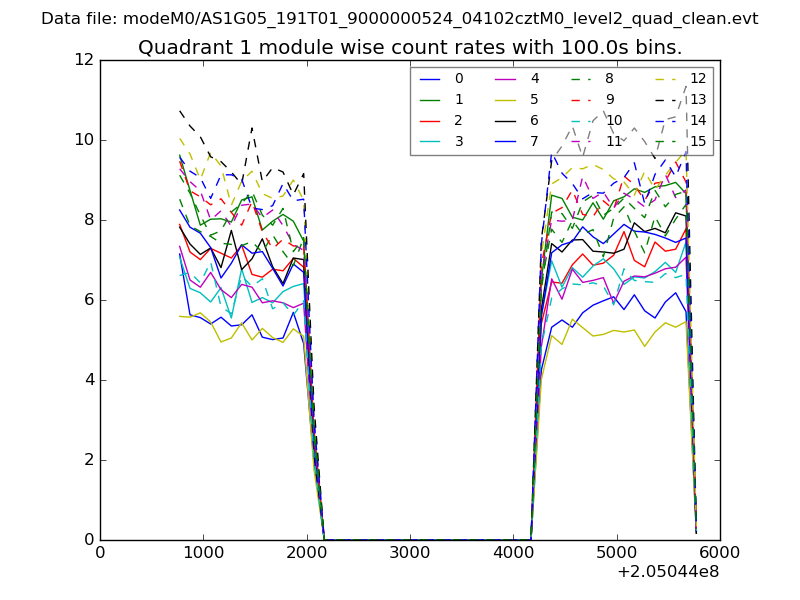
| Module-wise count rates for Quadrant A Data is divided into 100 sec bins |
 |
 |
| Module-wise count rates for Quadrant B Data is divided into 100 sec bins |
 |
 |
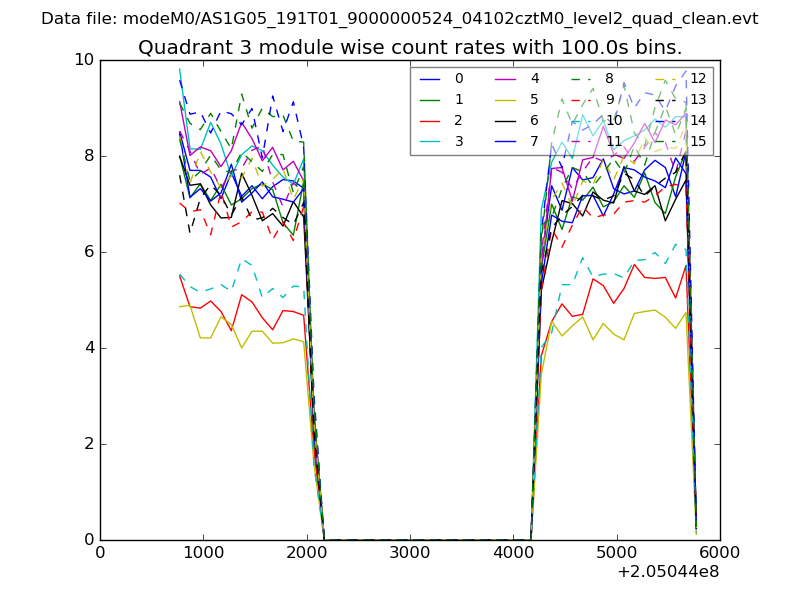
| Module-wise count rates for Quadrant C Data is divided into 100 sec bins |
 |
 |
| Module-wise count rates for Quadrant D Data is divided into 100 sec bins |
 |
 |
| Parameter | Plot |
|---|---|
| CZT HV Monitor | 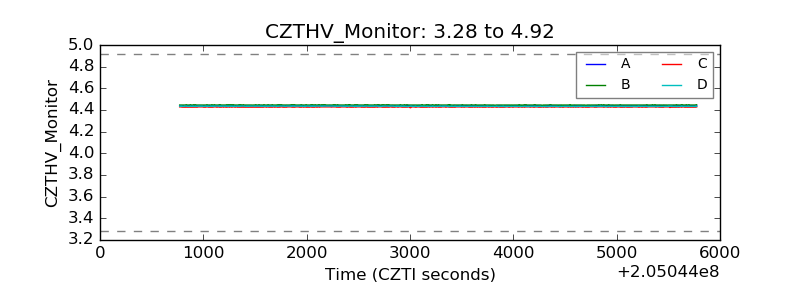 |
| D_VDD | 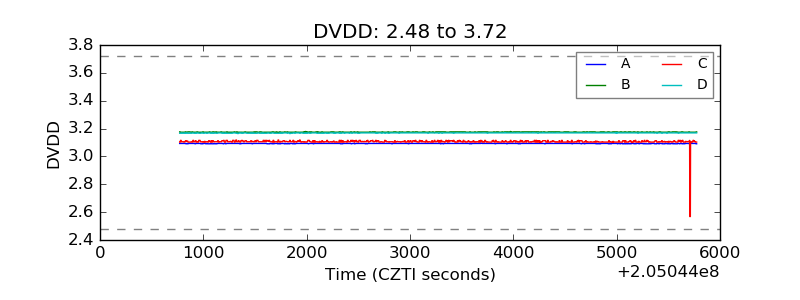 |
| Temperature 1 | 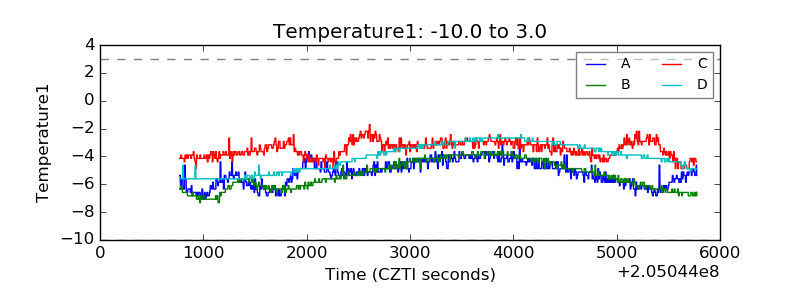 |
| Veto HV Monitor | 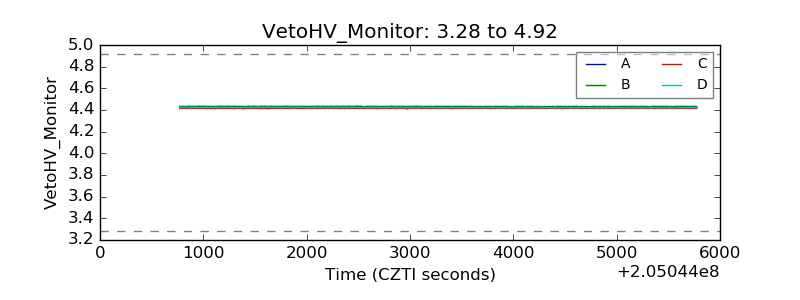 |
| Veto LLD | 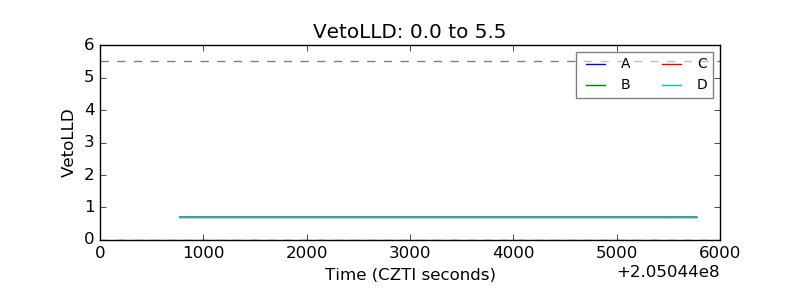 |
| Alpha Counter | 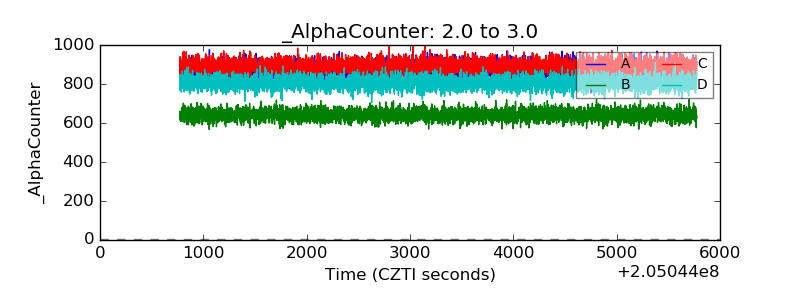 |
| _CPM_Rate | 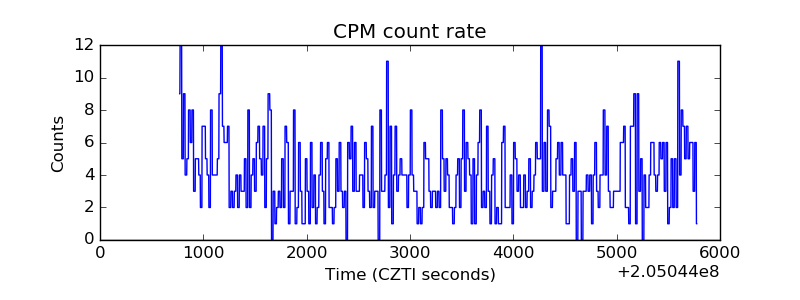 |
| CZT Counter | 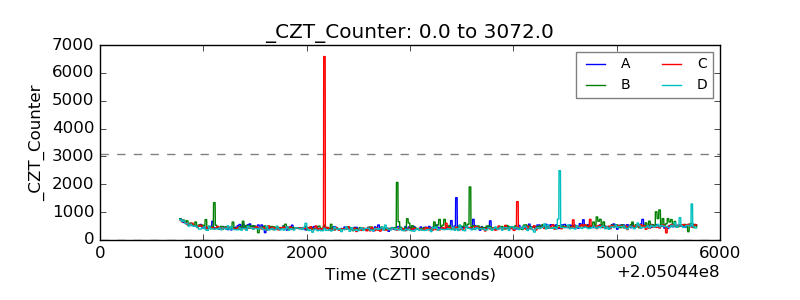 |
| +2.5 Volts monitor |  |
| +5 Volts monitor |  |
| _ROLL_ROT | 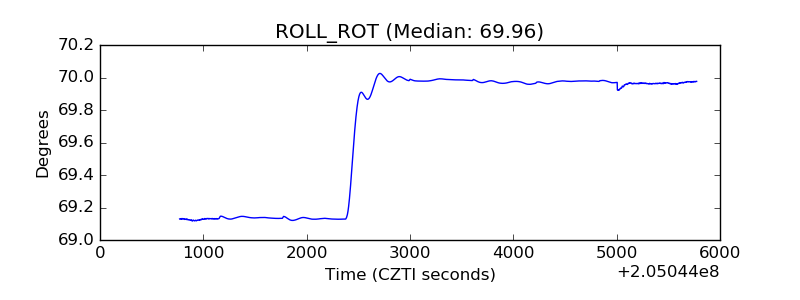 |
| _Roll_DEC | 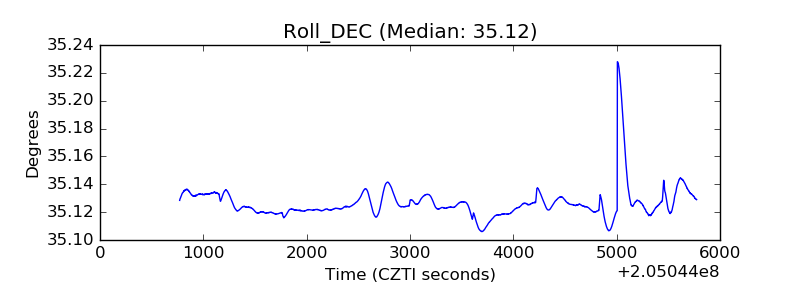 |
| _Roll_RA | 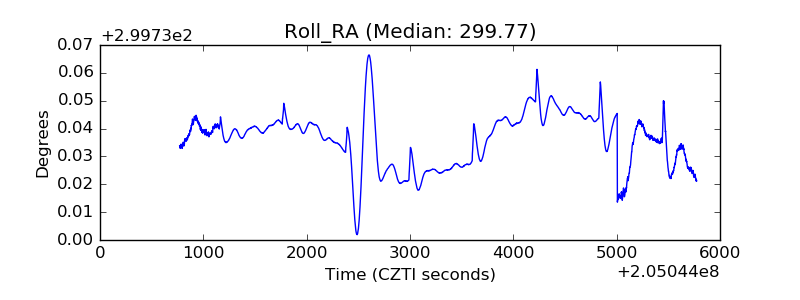 |
| Veto Counter | 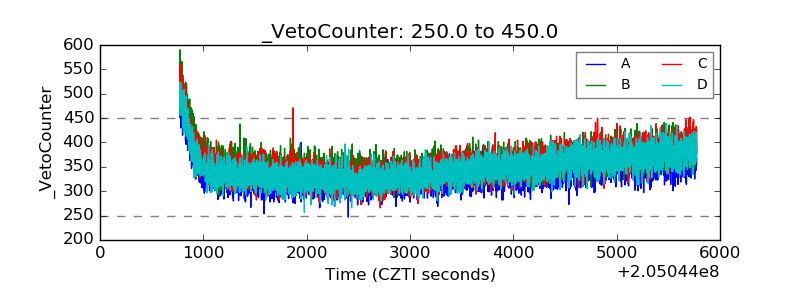 |