| Param | Original file | Final file |
|---|---|---|
| Filename | modeM0/AS1G05_191T01_9000000524_04104cztM0_level2.evt | modeM0/AS1G05_191T01_9000000524_04104cztM0_level2_quad_clean.evt |
| Size (bytes) | 940,034,880 | 164,603,520 |
| Size | 896.5 MB | 157.0 MB |
| Events in quadrant A | 6,804,666 | 1,016,495 |
| Events in quadrant B | 7,599,069 | 1,010,415 |
| Events in quadrant C | 6,474,452 | 1,005,476 |
| Events in quadrant D | 6,627,507 | 970,383 |
| Mode M0 | |||
|---|---|---|---|
| Quadrant | BADHDUFLAG | Total packets | Discarded packets |
| A | 0 | 29388 | 5 |
| B | 0 | 31586 | 4 |
| C | 0 | 29079 | 4 |
| D | 0 | 29892 | 4 |
| Mode M9 | |||
|---|---|---|---|
| Quadrant | BADHDUFLAG | Total packets | Discarded packets |
| A | 0 | 16 | 0 |
| B | 0 | 16 | 0 |
| C | 0 | 16 | 0 |
| D | 0 | 16 | 0 |
| Mode SS | |||
|---|---|---|---|
| Quadrant | BADHDUFLAG | Total packets | Discarded packets |
| A | 0 | 292 | 0 |
| B | 0 | 292 | 0 |
| C | 0 | 292 | 0 |
| D | 0 | 292 | 0 |
| Quadrant | Total seconds | Saturated seconds | Saturation percentage |
|---|---|---|---|
| A | 14215 | 309 | 2.173760% |
| B | 14215 | 393 | 2.764685% |
| C | 14215 | 202 | 1.421034% |
| D | 14215 | 248 | 1.744636% |
Noise dominated data is calculated using 1-second bins in cleaned event files. If a bin has >2000 counts, and if more than 50% of those come from <1% of pixels, then it is considered to be noise-dominated and hence unusable.
| Quadrant | # 1 sec bins | Bins with >0 counts | Bins with >2000 counts | High rate bins dominated by noise | Noise dominated (total time) | Noise dominated (detector-on time) | Marked lightcurve |
|---|---|---|---|---|---|---|---|
| A | 15850 | 14216 | 0 | 0 | 0.00% | 0.00% | 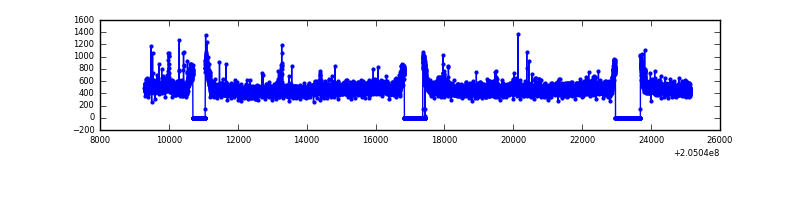 |
| B | 15850 | 14216 | 92 | 92 | 0.58% | 0.65% | 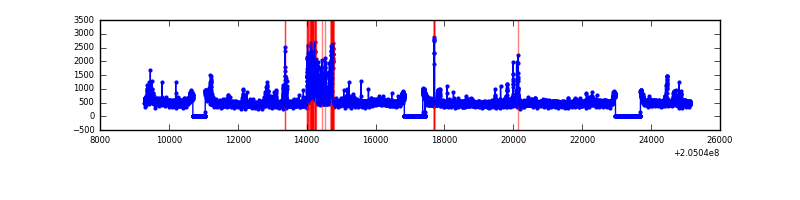 |
| C | 15850 | 14216 | 0 | 0 | 0.00% | 0.00% | 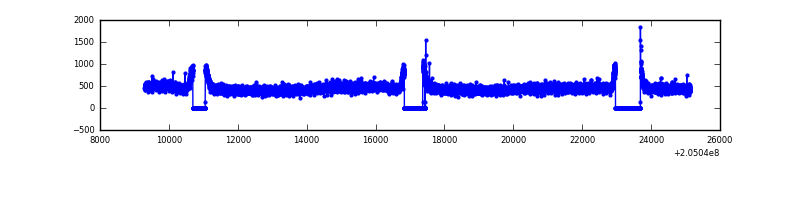 |
| D | 15850 | 14216 | 17 | 17 | 0.11% | 0.12% | 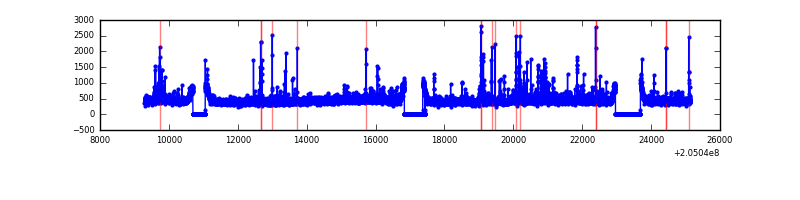 |
Top three noisy pixels from each quadrant. If the there are fewer than three noisy pixels in the level2.evt file, extra rows are filled as -1
| Pixel properties | Quadrant properties | ||||||
|---|---|---|---|---|---|---|---|
| Quadrant | DetID | PixID | Counts | Sigma | Mean | Median | Sigma |
| A | 0 | 199 | 150340 | 428.59 | 1697 | 1660 | 346.9 |
| A | 8 | 15 | 60455 | 169.48 | 1697 | 1660 | 346.9 |
| A | 0 | 50 | 50059 | 139.52 | 1697 | 1660 | 346.9 |
| B | 14 | 167 | 766102 | 2316.13 | 1710 | 1669 | 330.0 |
| B | 15 | 204 | 121910 | 364.31 | 1710 | 1669 | 330.0 |
| B | 12 | 111 | 30779 | 88.2 | 1710 | 1669 | 330.0 |
| C | 13 | 61 | 13596 | 31.02 | 1653 | 1665 | 384.6 |
| C | 8 | 128 | 7224 | 14.45 | 1653 | 1665 | 384.6 |
| C | 12 | 4 | 6320 | 12.1 | 1653 | 1665 | 384.6 |
| D | 10 | 172 | 177851 | 441.96 | 1643 | 1596 | 398.8 |
| D | 2 | 14 | 90569 | 223.1 | 1643 | 1596 | 398.8 |
| D | 13 | 239 | 81352 | 199.99 | 1643 | 1596 | 398.8 |
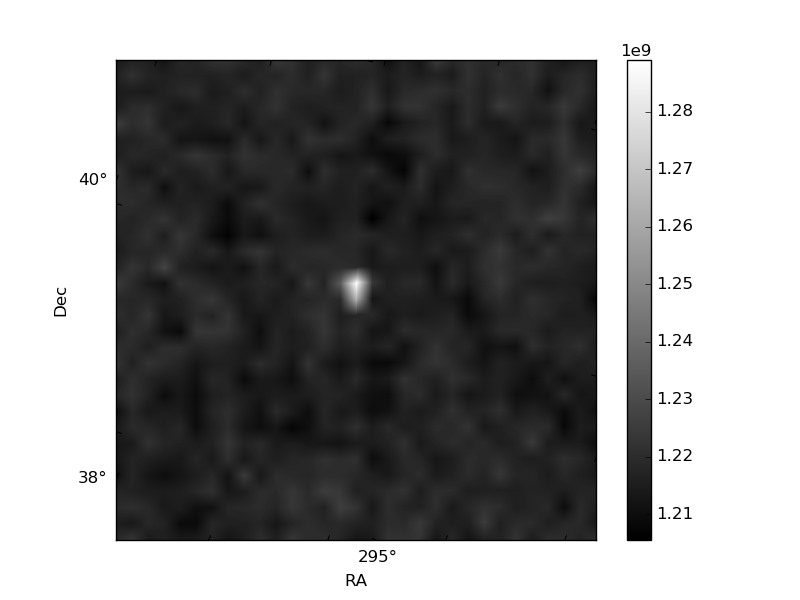
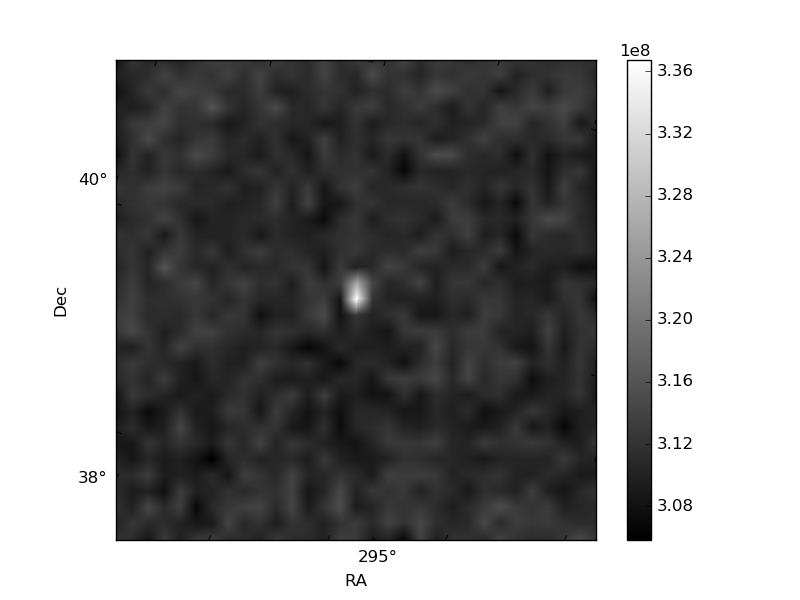
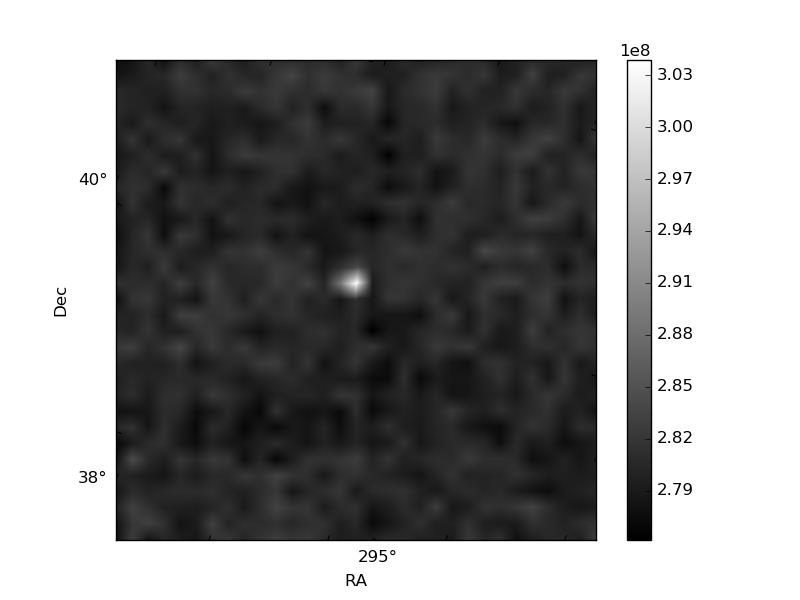
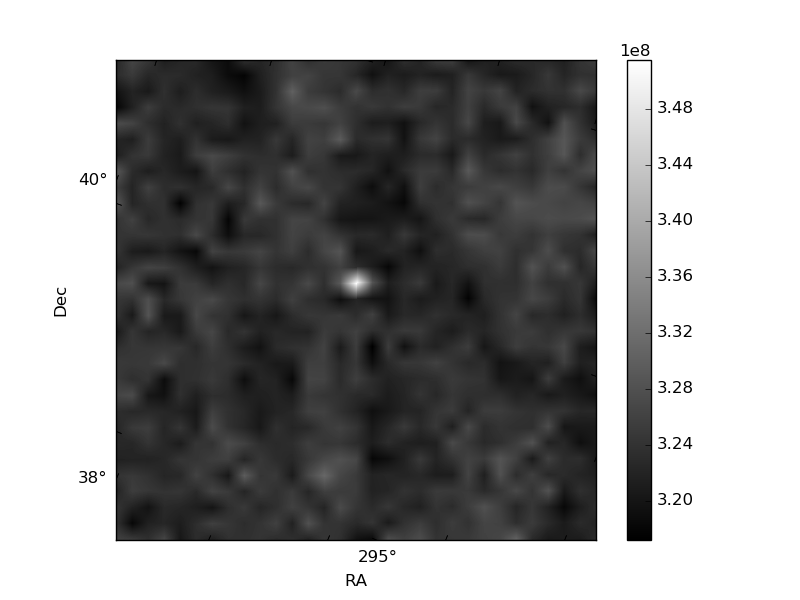
Histogram calculated using DETX and DETY for each event in the final _common_clean file
| Quadrant A | 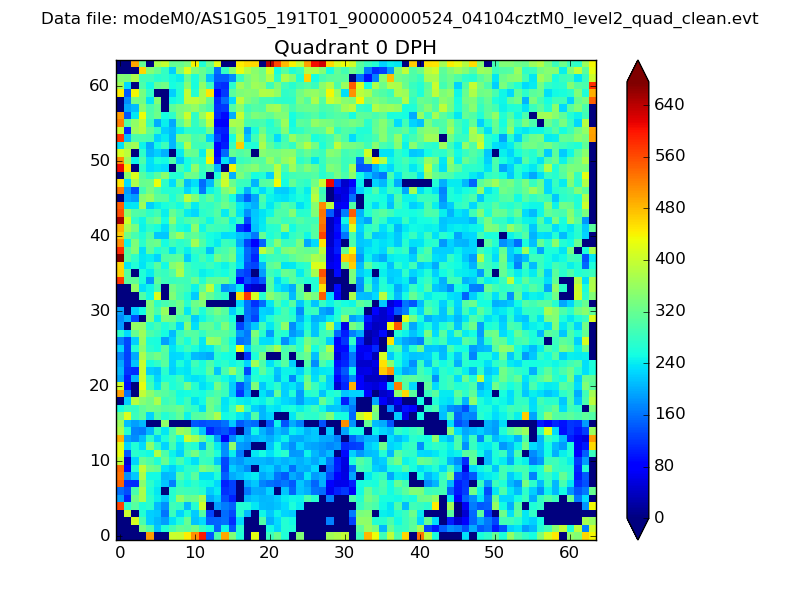 |
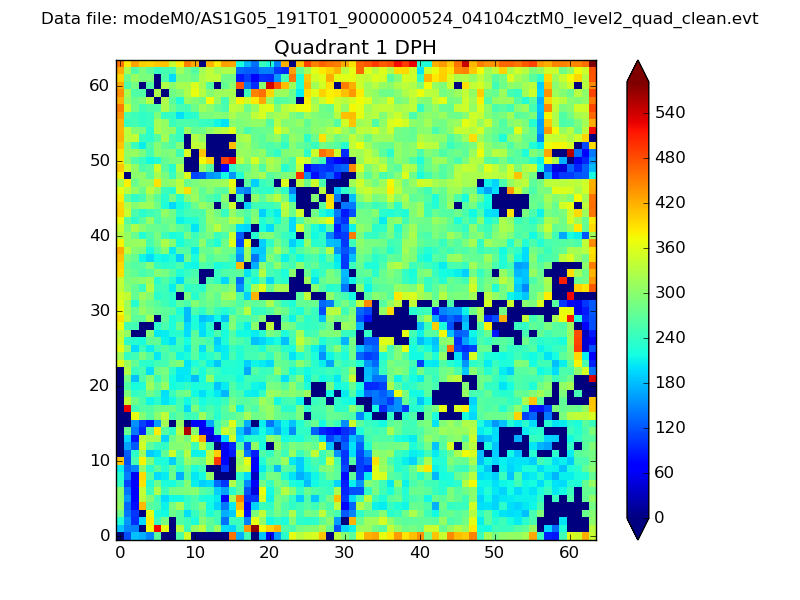 |
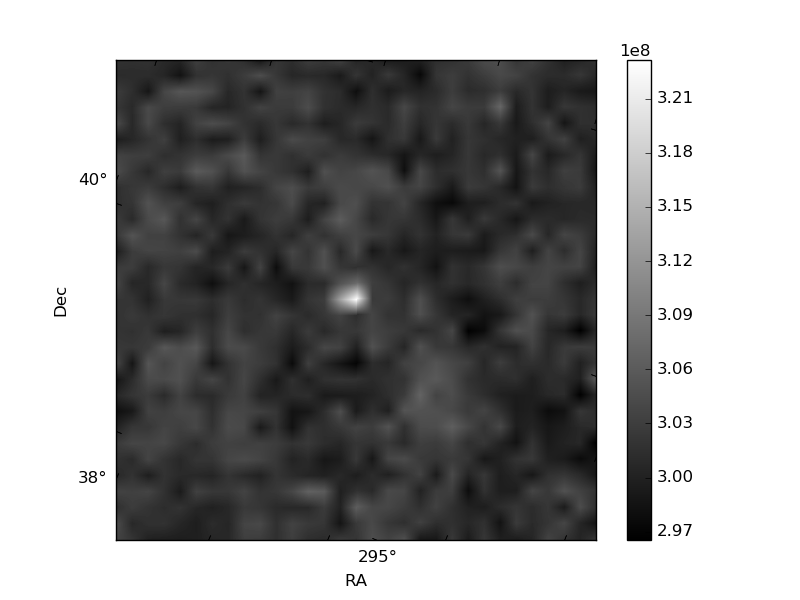
Quadrant B |
|---|---|---|---|
| Quadrant D | 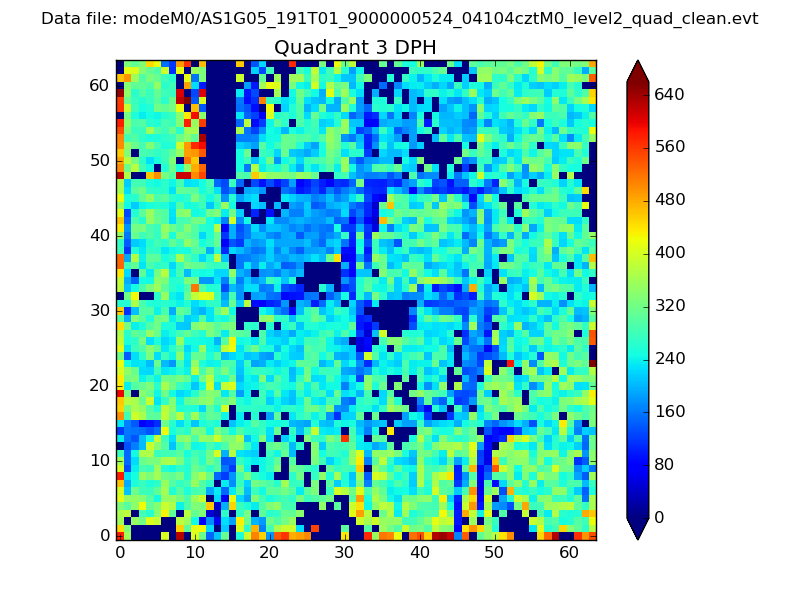 |
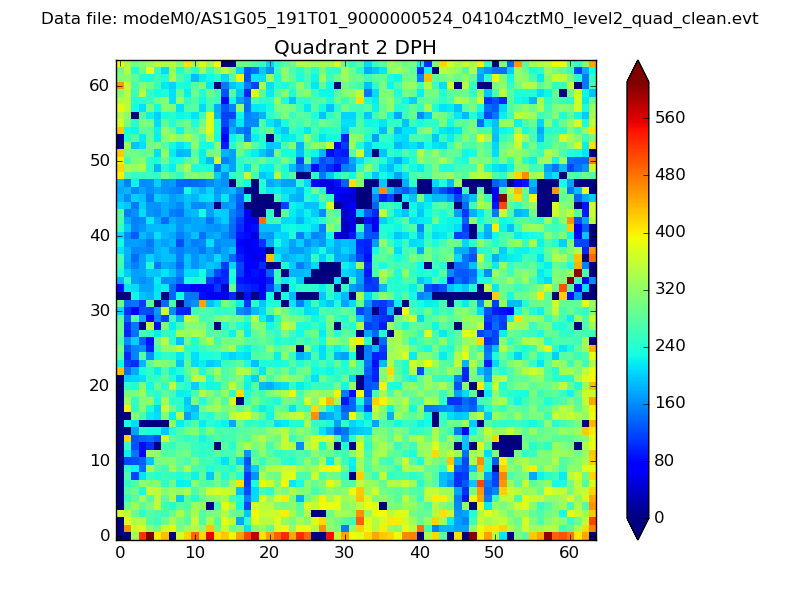 |
Quadrant C |
| Plot type | Count rate plots | Images |
|---|---|---|
| Comparison with Poisson distribution Blue bars denote a histogram of data divided into 1 sec bins. Red curve is a Poisson curve with rate = median count rate of data. |
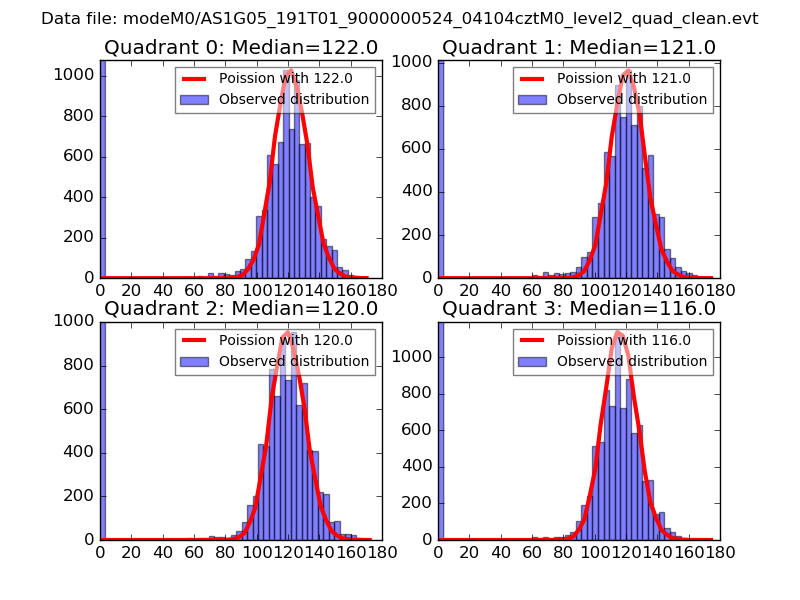 |
 |
| Quadrant-wise count rates Data is divided into 100 sec bins |
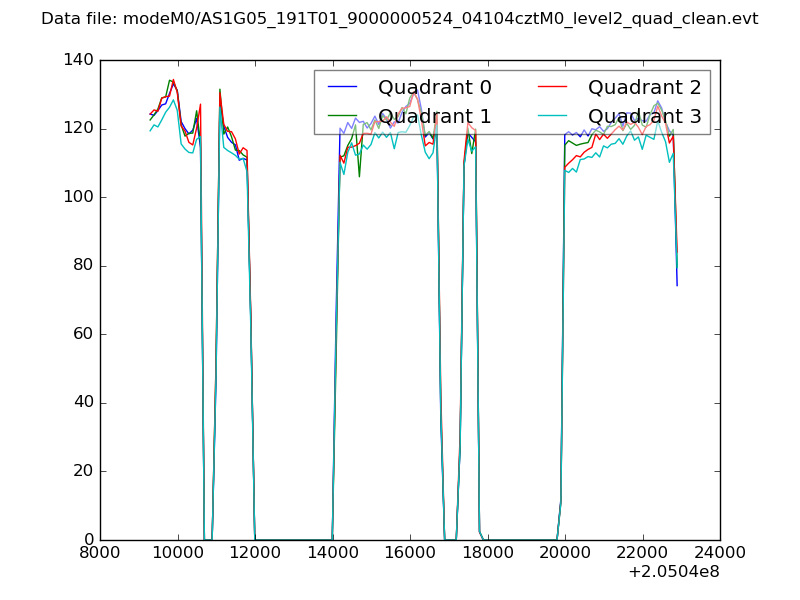 |
|
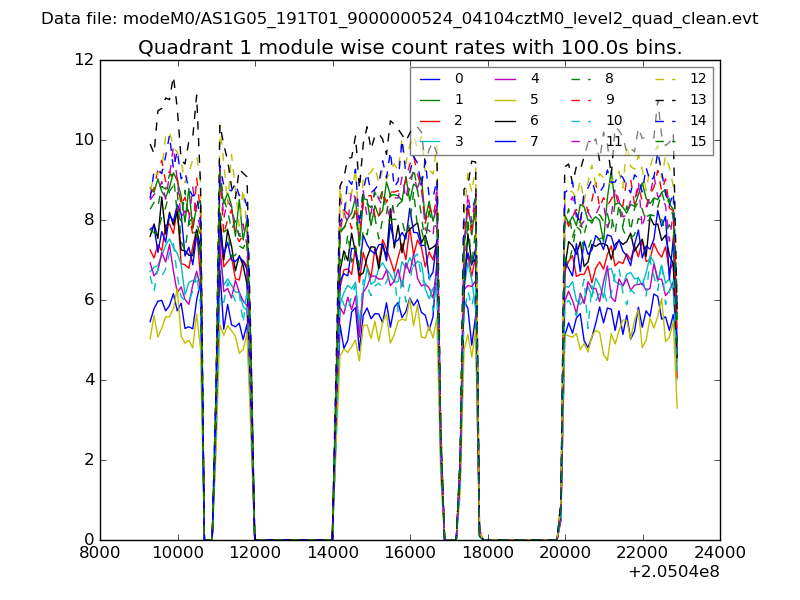
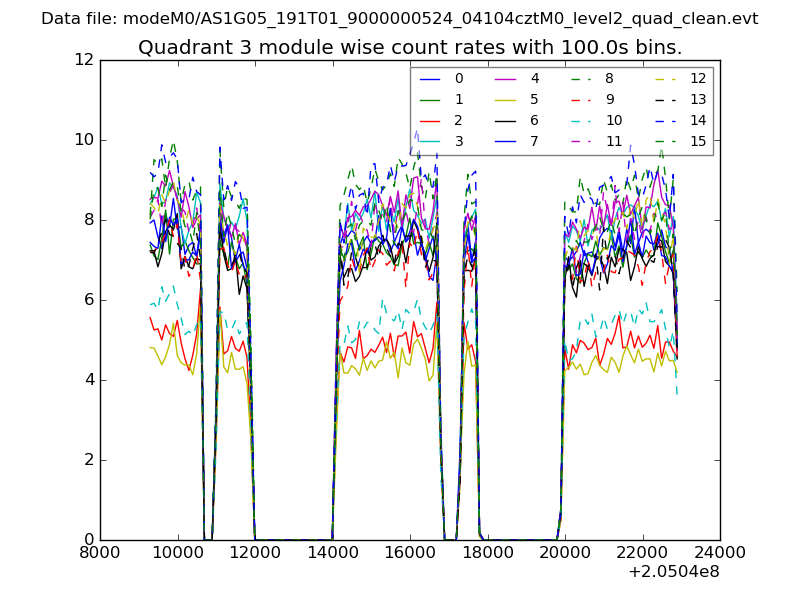
| Module-wise count rates for Quadrant A Data is divided into 100 sec bins |
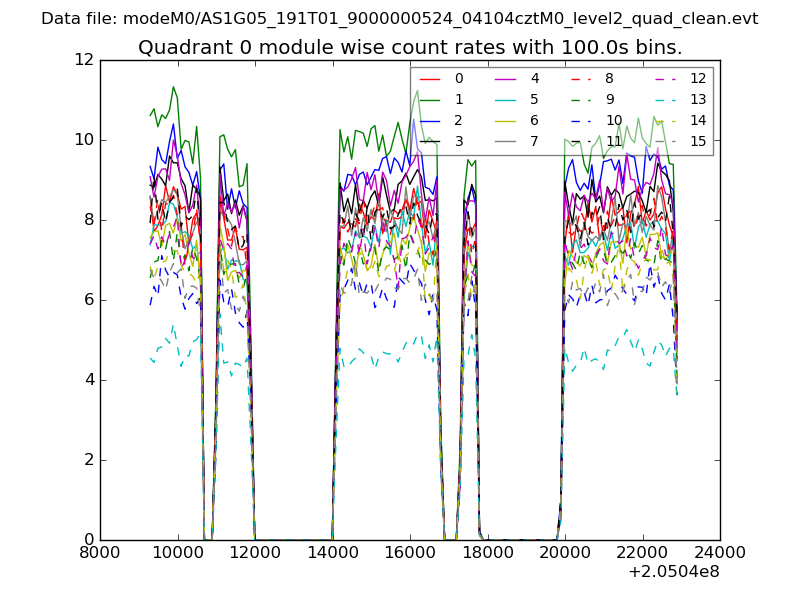 |
 |
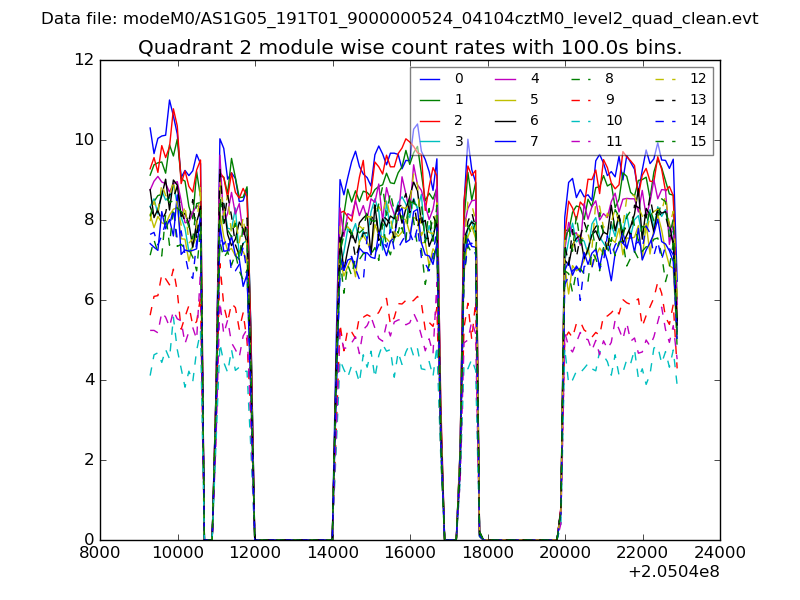
| Module-wise count rates for Quadrant B Data is divided into 100 sec bins |
 |
 |
| Module-wise count rates for Quadrant C Data is divided into 100 sec bins |
 |
 |
| Module-wise count rates for Quadrant D Data is divided into 100 sec bins |
 |
 |
| Parameter | Plot |
|---|---|
| CZT HV Monitor |  |
| D_VDD | 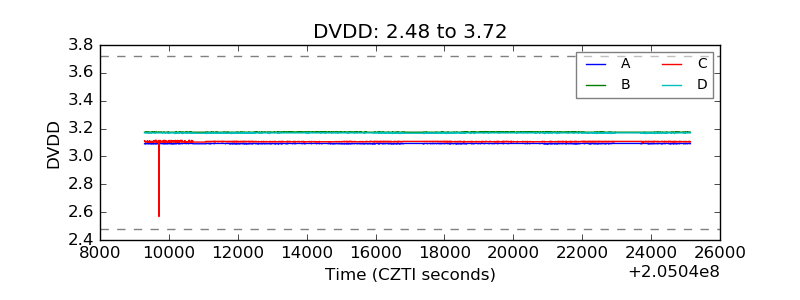 |
| Temperature 1 | 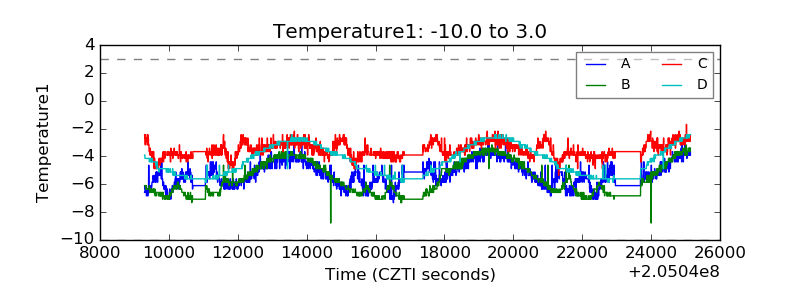 |
| Veto HV Monitor | 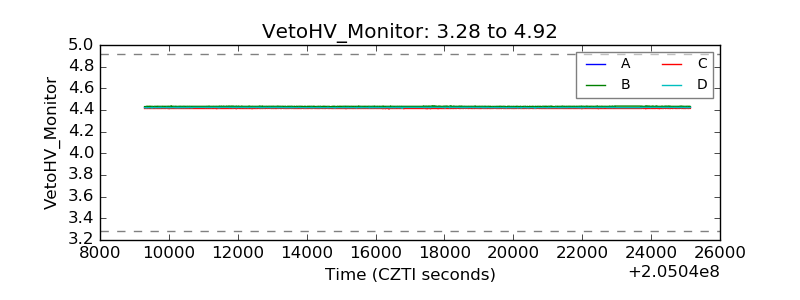 |
| Veto LLD | 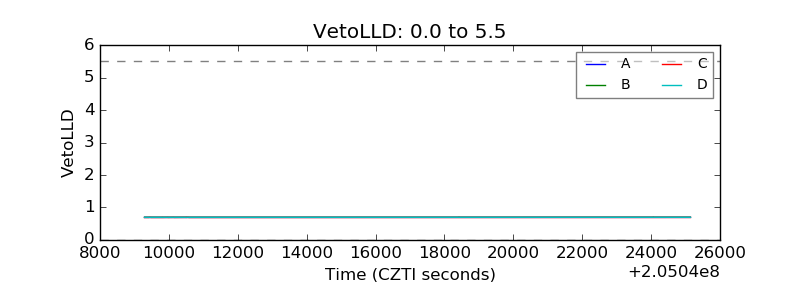 |
| Alpha Counter | 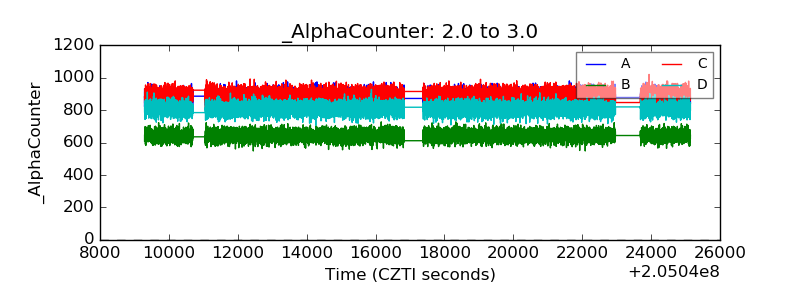 |
| _CPM_Rate | 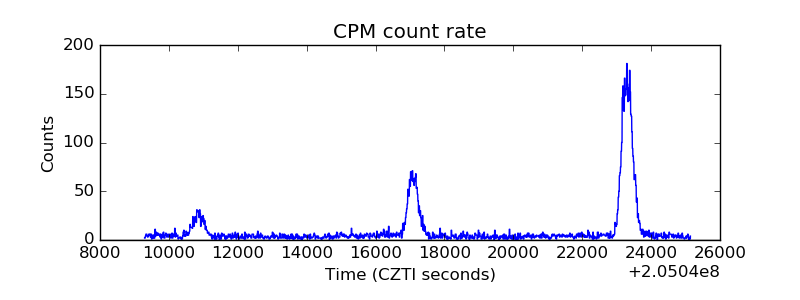 |
| CZT Counter | 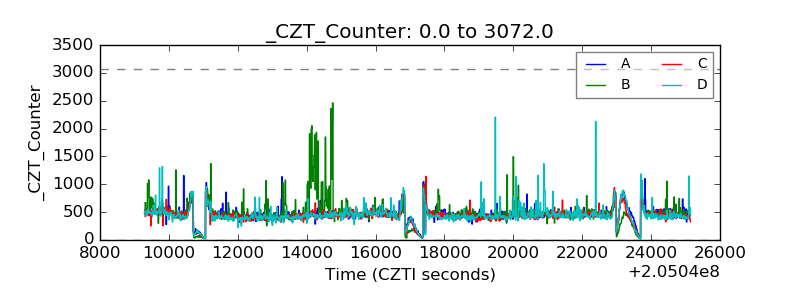 |
| +2.5 Volts monitor |  |
| +5 Volts monitor |  |
| _ROLL_ROT | 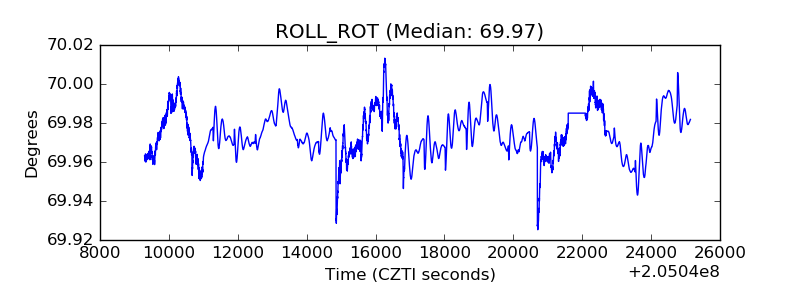 |
| _Roll_DEC | 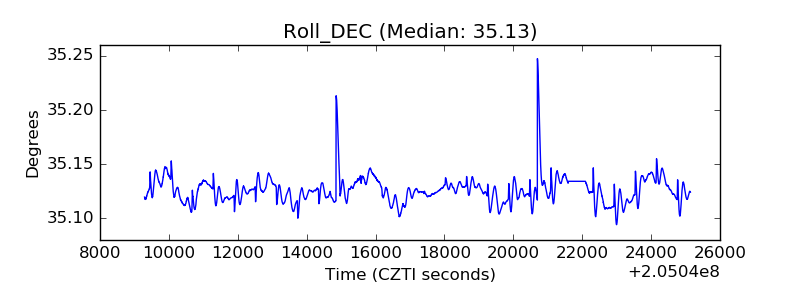 |
| _Roll_RA | 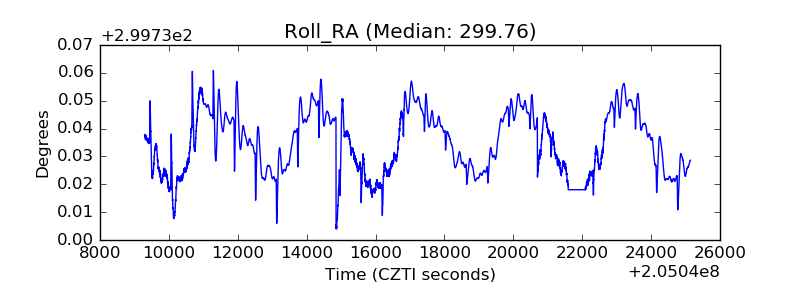 |
| Veto Counter | 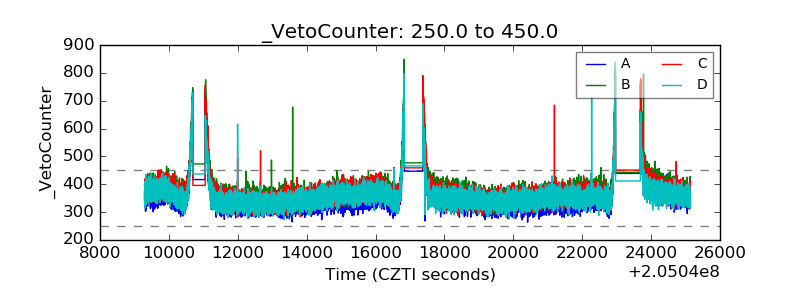 |