| Param | Original file | Final file |
|---|---|---|
| Filename | modeM0/AS1G05_191T01_9000000524_04105cztM0_level2.evt | modeM0/AS1G05_191T01_9000000524_04105cztM0_level2_quad_clean.evt |
| Size (bytes) | 453,663,360 | 66,343,680 |
| Size | 432.6 MB | 63.3 MB |
| Events in quadrant A | 3,318,349 | 393,430 |
| Events in quadrant B | 3,531,151 | 388,015 |
| Events in quadrant C | 3,088,131 | 384,854 |
| Events in quadrant D | 3,346,064 | 375,251 |
| Mode M0 | |||
|---|---|---|---|
| Quadrant | BADHDUFLAG | Total packets | Discarded packets |
| A | 0 | 14128 | 3 |
| B | 0 | 14615 | 2 |
| C | 0 | 13716 | 2 |
| D | 0 | 14658 | 2 |
| Mode M9 | |||
|---|---|---|---|
| Quadrant | BADHDUFLAG | Total packets | Discarded packets |
| A | 0 | 10 | 0 |
| B | 0 | 10 | 0 |
| C | 0 | 10 | 0 |
| D | 0 | 11 | 0 |
| Mode SS | |||
|---|---|---|---|
| Quadrant | BADHDUFLAG | Total packets | Discarded packets |
| A | 0 | 136 | 0 |
| B | 0 | 136 | 0 |
| C | 0 | 136 | 0 |
| D | 0 | 136 | 0 |
| Quadrant | Total seconds | Saturated seconds | Saturation percentage |
|---|---|---|---|
| A | 6700 | 73 | 1.089552% |
| B | 6700 | 124 | 1.850746% |
| C | 6700 | 40 | 0.597015% |
| D | 6700 | 143 | 2.134328% |
Noise dominated data is calculated using 1-second bins in cleaned event files. If a bin has >2000 counts, and if more than 50% of those come from <1% of pixels, then it is considered to be noise-dominated and hence unusable.
| Quadrant | # 1 sec bins | Bins with >0 counts | Bins with >2000 counts | High rate bins dominated by noise | Noise dominated (total time) | Noise dominated (detector-on time) | Marked lightcurve |
|---|---|---|---|---|---|---|---|
| A | 7625 | 6700 | 8 | 8 | 0.10% | 0.12% |  |
| B | 7625 | 6700 | 51 | 51 | 0.67% | 0.76% |  |
| C | 7625 | 6700 | 0 | 0 | 0.00% | 0.00% |  |
| D | 7625 | 6700 | 94 | 94 | 1.23% | 1.40% | 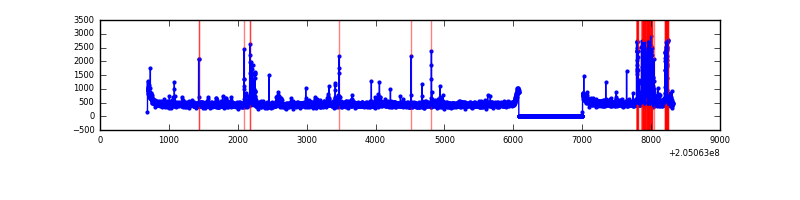 |
Top three noisy pixels from each quadrant. If the there are fewer than three noisy pixels in the level2.evt file, extra rows are filled as -1
| Pixel properties | Quadrant properties | ||||||
|---|---|---|---|---|---|---|---|
| Quadrant | DetID | PixID | Counts | Sigma | Mean | Median | Sigma |
| A | 0 | 50 | 120472 | 723.93 | 805 | 789 | 165.3 |
| A | 0 | 199 | 84669 | 507.37 | 805 | 789 | 165.3 |
| A | 0 | 226 | 15513 | 89.06 | 805 | 789 | 165.3 |
| B | 14 | 167 | 310897 | 1989.17 | 810 | 792 | 155.9 |
| B | 15 | 204 | 75591 | 479.8 | 810 | 792 | 155.9 |
| B | 12 | 111 | 14157 | 85.73 | 810 | 792 | 155.9 |
| C | 9 | 144 | 45204 | 244.67 | 778 | 784 | 181.5 |
| C | 13 | 61 | 6310 | 30.44 | 778 | 784 | 181.5 |
| C | 9 | 175 | 4177 | 18.69 | 778 | 784 | 181.5 |
| D | 10 | 172 | 317808 | 1696.4 | 770 | 747 | 186.9 |
| D | 2 | 14 | 33507 | 175.28 | 770 | 747 | 186.9 |
| D | 13 | 223 | 33161 | 173.43 | 770 | 747 | 186.9 |
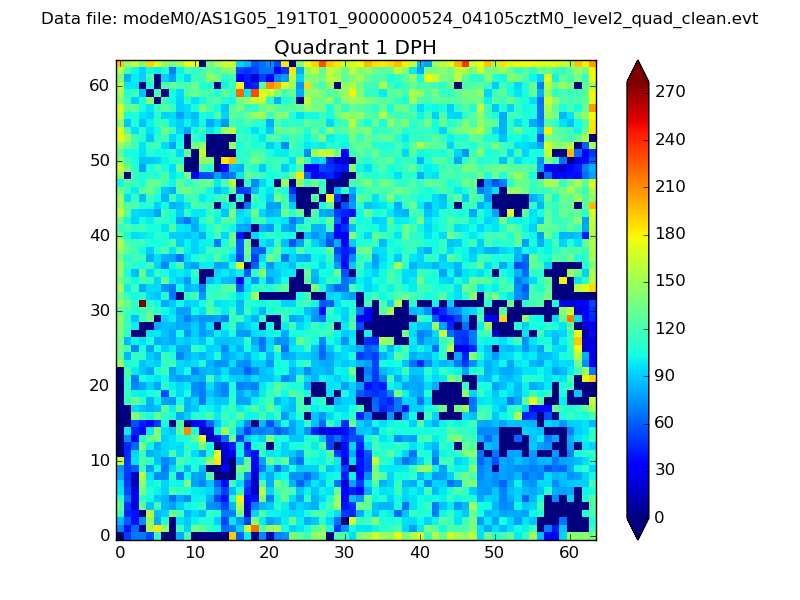
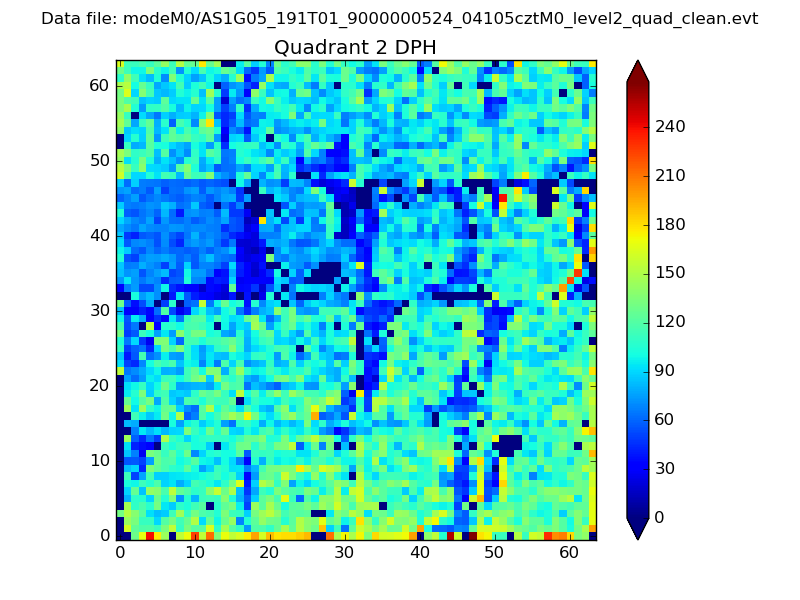
Histogram calculated using DETX and DETY for each event in the final _common_clean file
| Quadrant A |  |
 |
Quadrant B |
|---|---|---|---|
| Quadrant D | 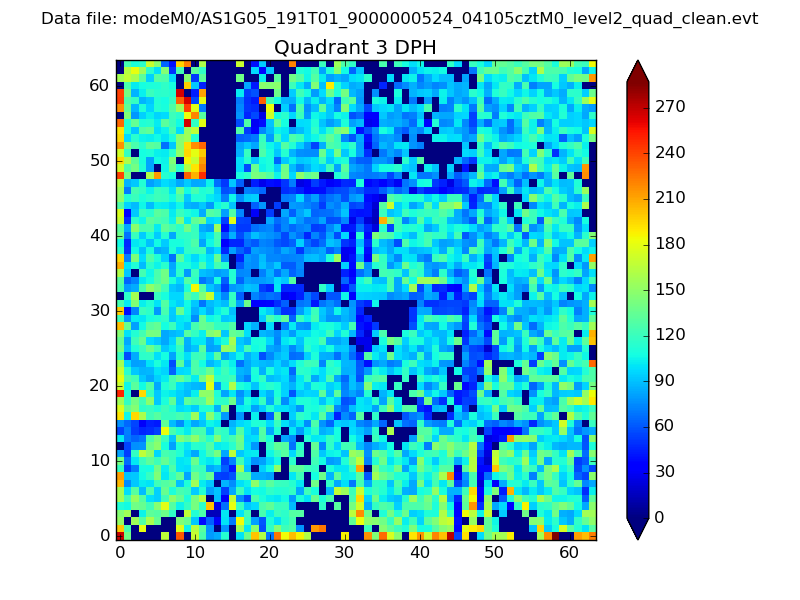 |
 |
Quadrant C |
| Plot type | Count rate plots | Images |
|---|---|---|
| Comparison with Poisson distribution Blue bars denote a histogram of data divided into 1 sec bins. Red curve is a Poisson curve with rate = median count rate of data. |
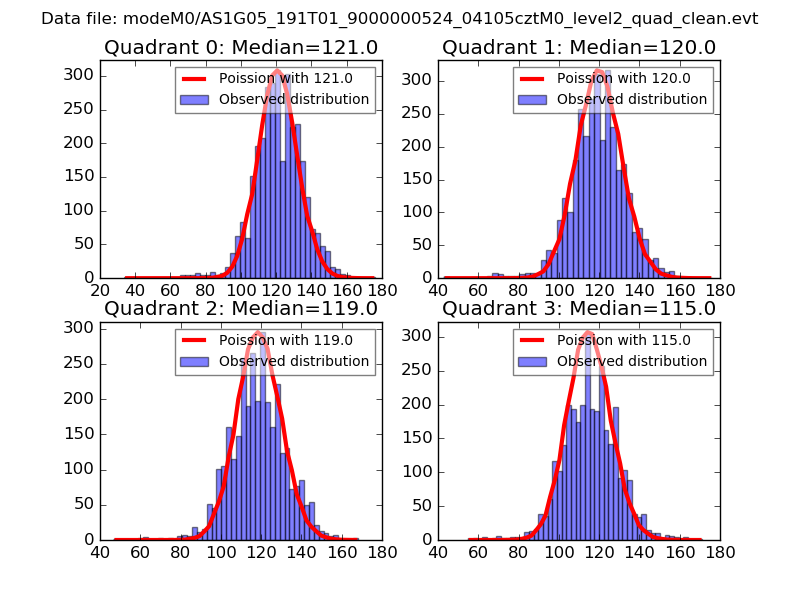 |
 |
| Quadrant-wise count rates Data is divided into 100 sec bins |
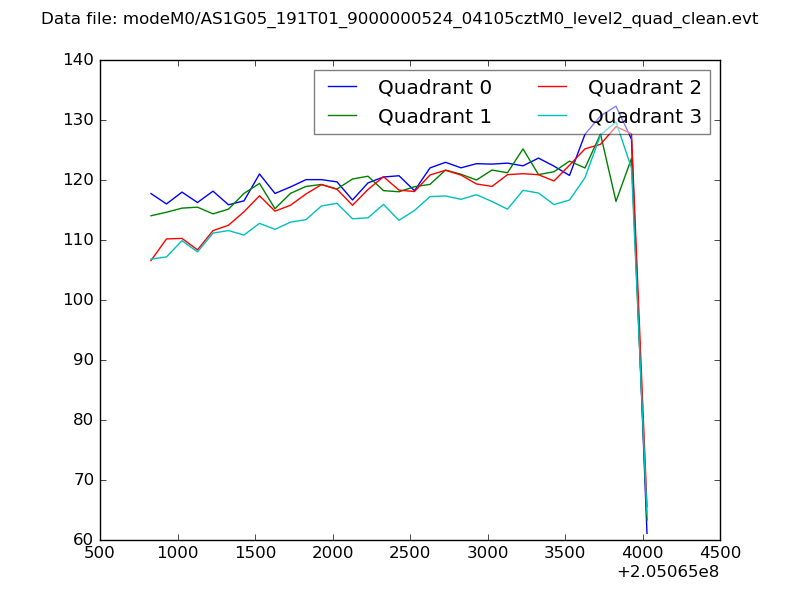 |
|
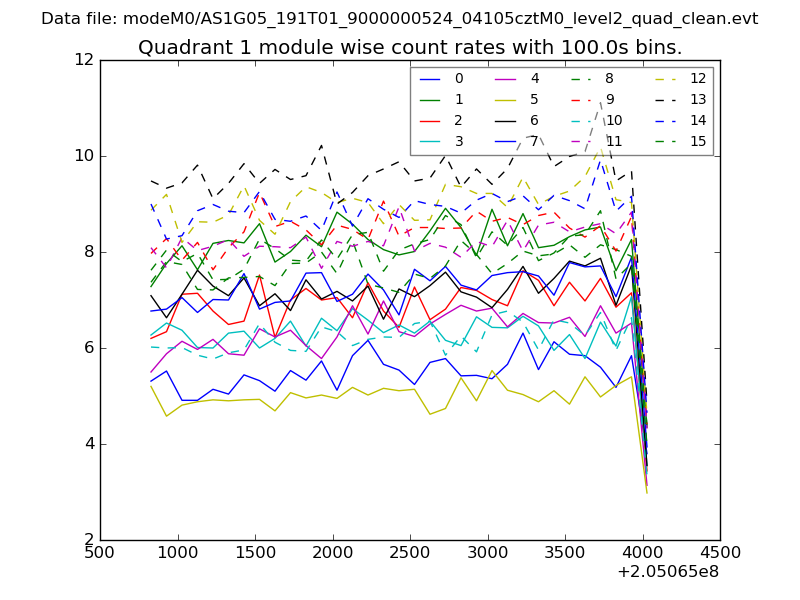
| Module-wise count rates for Quadrant A Data is divided into 100 sec bins |
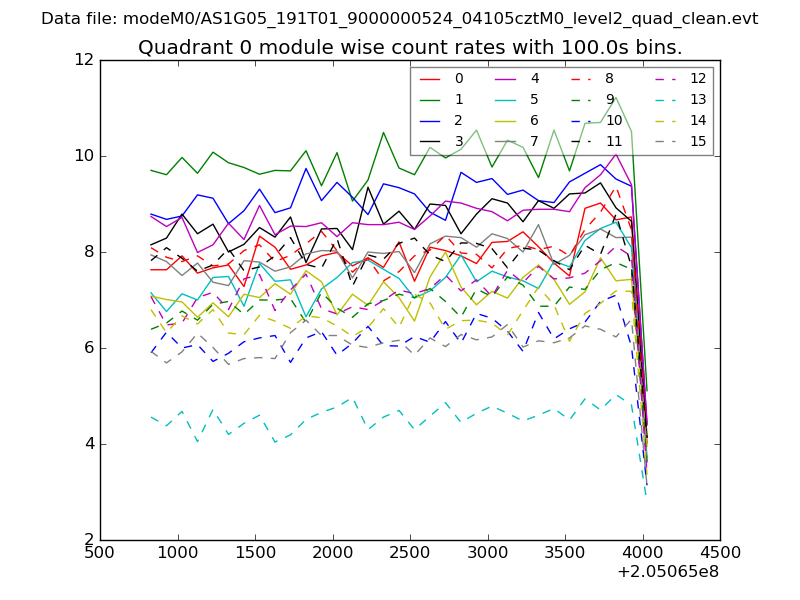 |
 |
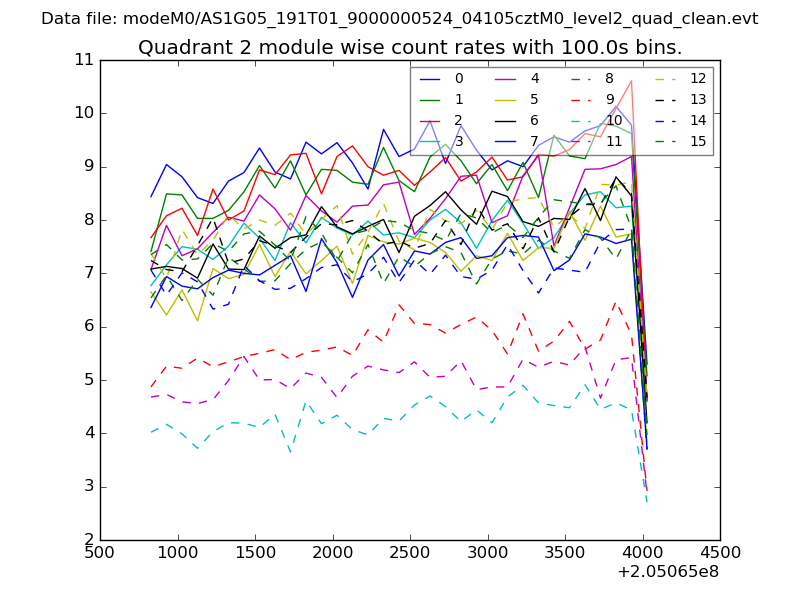
| Module-wise count rates for Quadrant B Data is divided into 100 sec bins |
 |
 |
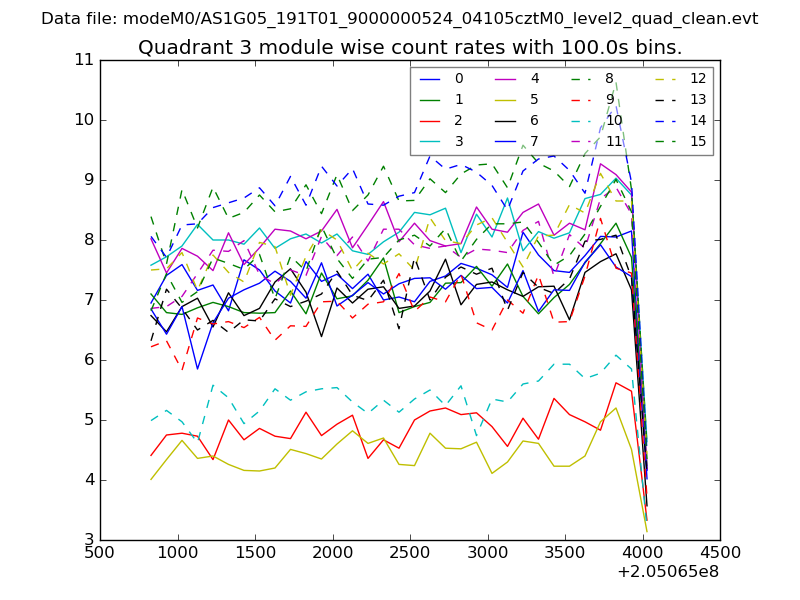
| Module-wise count rates for Quadrant C Data is divided into 100 sec bins |
 |
 |
| Module-wise count rates for Quadrant D Data is divided into 100 sec bins |
 |
 |
| Parameter | Plot |
|---|---|
| CZT HV Monitor | 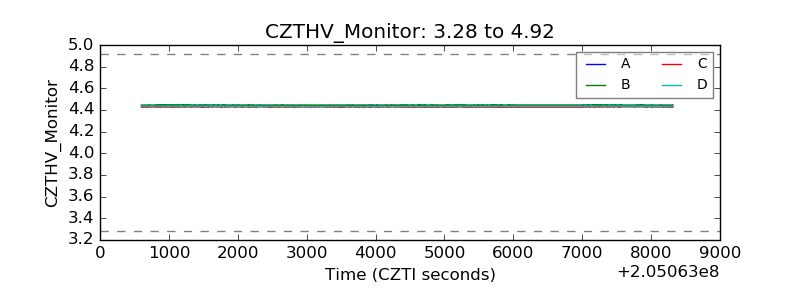 |
| D_VDD | 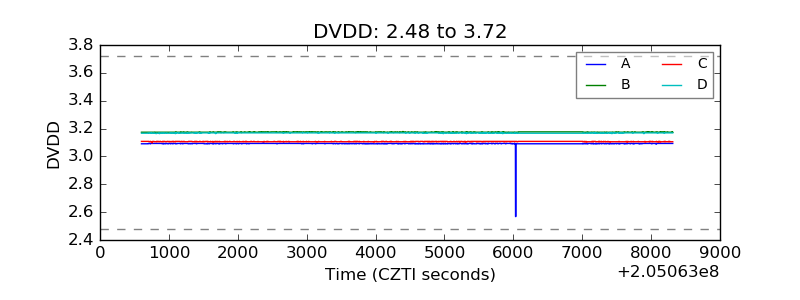 |
| Temperature 1 | 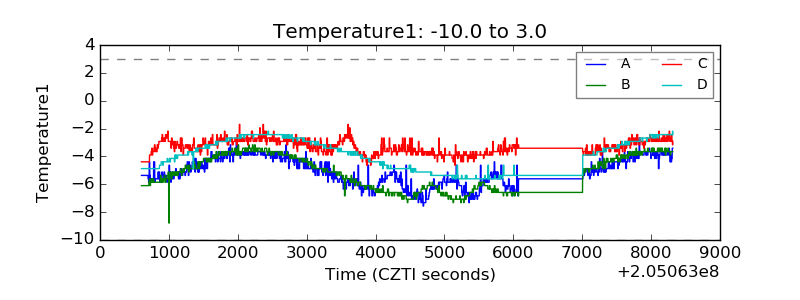 |
| Veto HV Monitor | 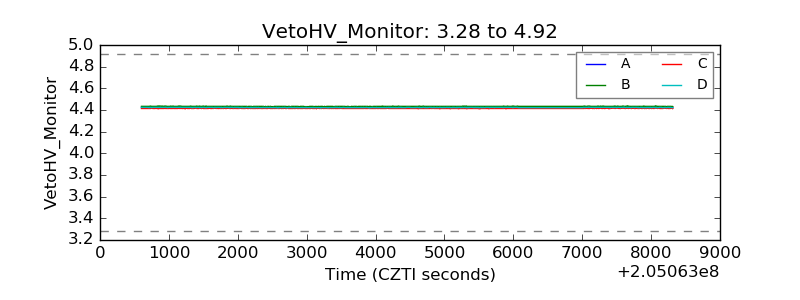 |
| Veto LLD | 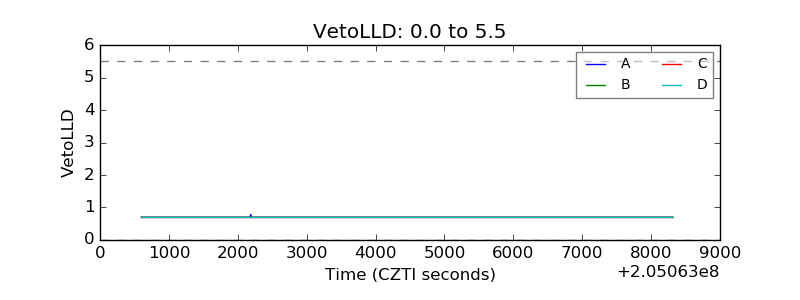 |
| Alpha Counter | 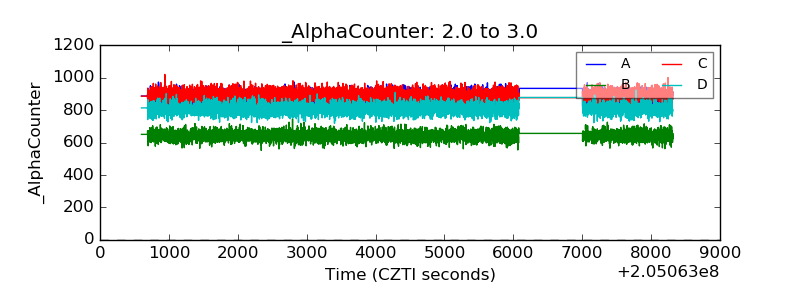 |
| _CPM_Rate | 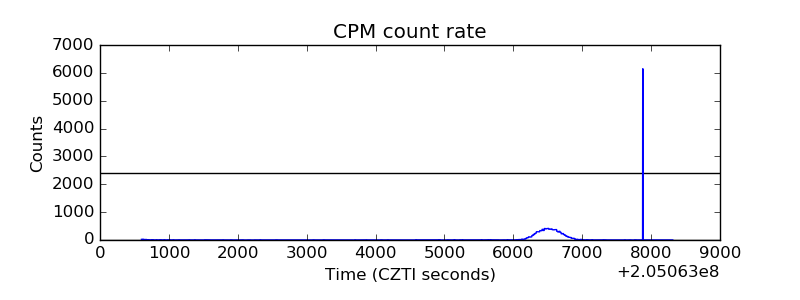 |
| CZT Counter | 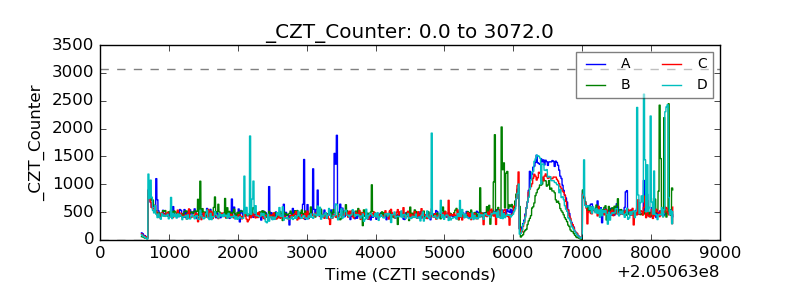 |
| +2.5 Volts monitor | 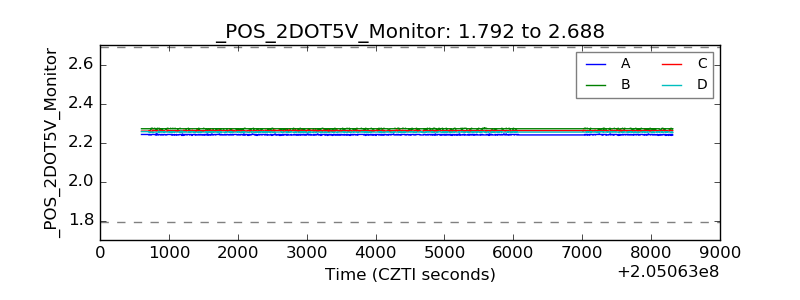 |
| +5 Volts monitor |  |
| _ROLL_ROT | 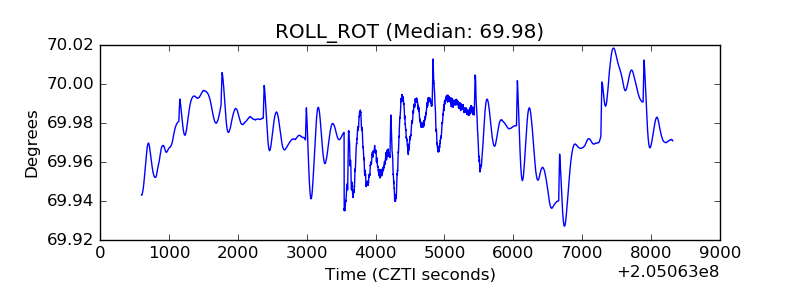 |
| _Roll_DEC | 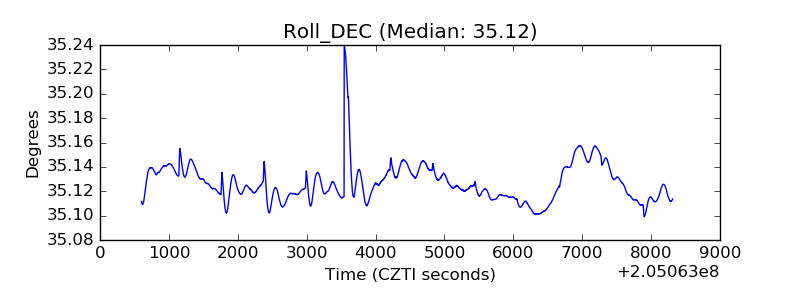 |
| _Roll_RA | 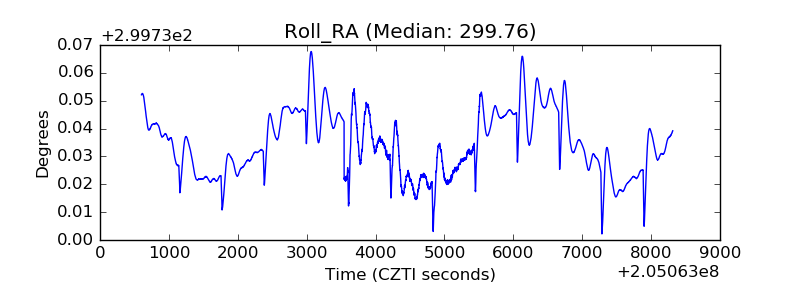 |
| Veto Counter | 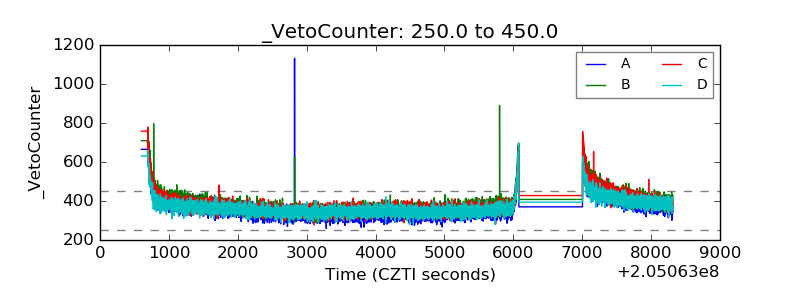 |