| Param | Original file | Final file |
|---|---|---|
| Filename | modeM0/AS1G05_191T01_9000000524_04106cztM0_level2.evt | modeM0/AS1G05_191T01_9000000524_04106cztM0_level2_quad_clean.evt |
| Size (bytes) | 526,564,800 | 78,577,920 |
| Size | 502.2 MB | 74.9 MB |
| Events in quadrant A | 3,493,064 | 487,565 |
| Events in quadrant B | 3,736,972 | 483,347 |
| Events in quadrant C | 4,546,060 | 465,146 |
| Events in quadrant D | 3,703,442 | 463,269 |
| Mode M0 | |||
|---|---|---|---|
| Quadrant | BADHDUFLAG | Total packets | Discarded packets |
| A | 0 | 14613 | 3 |
| B | 0 | 15463 | 2 |
| C | 0 | 18015 | 2 |
| D | 0 | 15661 | 2 |
| Mode M9 | |||
|---|---|---|---|
| Quadrant | BADHDUFLAG | Total packets | Discarded packets |
| A | 0 | 21 | 0 |
| B | 0 | 21 | 0 |
| C | 0 | 21 | 0 |
| D | 0 | 21 | 0 |
| Mode SS | |||
|---|---|---|---|
| Quadrant | BADHDUFLAG | Total packets | Discarded packets |
| A | 0 | 140 | 0 |
| B | 0 | 140 | 0 |
| C | 0 | 140 | 0 |
| D | 0 | 140 | 0 |
| Quadrant | Total seconds | Saturated seconds | Saturation percentage |
|---|---|---|---|
| A | 6895 | 90 | 1.305294% |
| B | 6895 | 201 | 2.915156% |
| C | 6895 | 307 | 4.452502% |
| D | 6895 | 190 | 2.755620% |
Noise dominated data is calculated using 1-second bins in cleaned event files. If a bin has >2000 counts, and if more than 50% of those come from <1% of pixels, then it is considered to be noise-dominated and hence unusable.
| Quadrant | # 1 sec bins | Bins with >0 counts | Bins with >2000 counts | High rate bins dominated by noise | Noise dominated (total time) | Noise dominated (detector-on time) | Marked lightcurve |
|---|---|---|---|---|---|---|---|
| A | 8895 | 6895 | 6 | 6 | 0.07% | 0.09% | 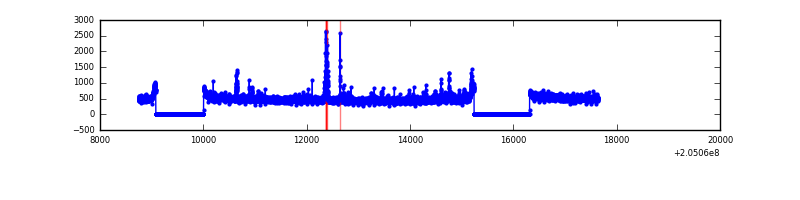 |
| B | 8895 | 6895 | 103 | 103 | 1.16% | 1.49% | 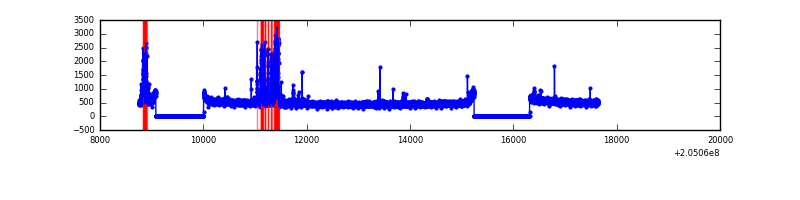 |
| C | 8894 | 6894 | 115 | 115 | 1.29% | 1.67% | 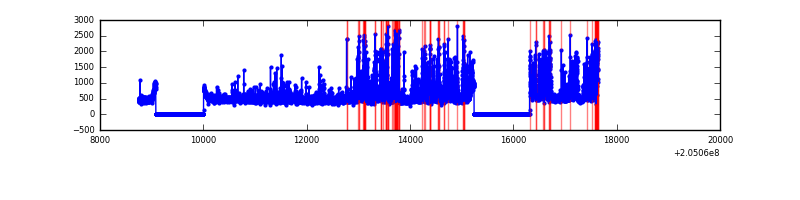 |
| D | 8895 | 6895 | 113 | 113 | 1.27% | 1.64% | 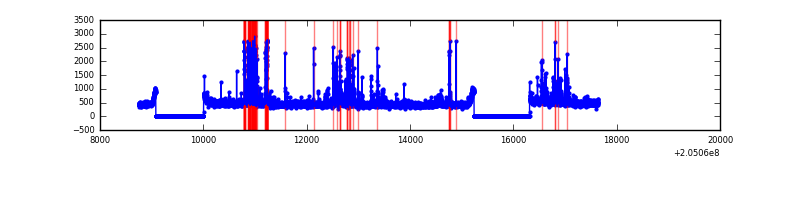 |
Top three noisy pixels from each quadrant. If the there are fewer than three noisy pixels in the level2.evt file, extra rows are filled as -1
| Pixel properties | Quadrant properties | ||||||
|---|---|---|---|---|---|---|---|
| Quadrant | DetID | PixID | Counts | Sigma | Mean | Median | Sigma |
| A | 0 | 50 | 107548 | 615.52 | 850 | 832 | 173.4 |
| A | 0 | 199 | 88540 | 505.89 | 850 | 832 | 173.4 |
| A | 0 | 226 | 16509 | 90.42 | 850 | 832 | 173.4 |
| B | 14 | 167 | 403170 | 2452.97 | 852 | 834 | 164.0 |
| B | 15 | 204 | 17627 | 102.38 | 852 | 834 | 164.0 |
| B | 12 | 111 | 14490 | 83.26 | 852 | 834 | 164.0 |
| C | 9 | 144 | 1370588 | 7241.44 | 812 | 820 | 189.2 |
| C | 13 | 61 | 6701 | 31.09 | 812 | 820 | 189.2 |
| C | 12 | 2 | 2638 | 9.61 | 812 | 820 | 189.2 |
| D | 10 | 172 | 476116 | 2405.68 | 814 | 791 | 197.6 |
| D | 13 | 223 | 50842 | 253.31 | 814 | 791 | 197.6 |
| D | 2 | 14 | 42379 | 210.48 | 814 | 791 | 197.6 |
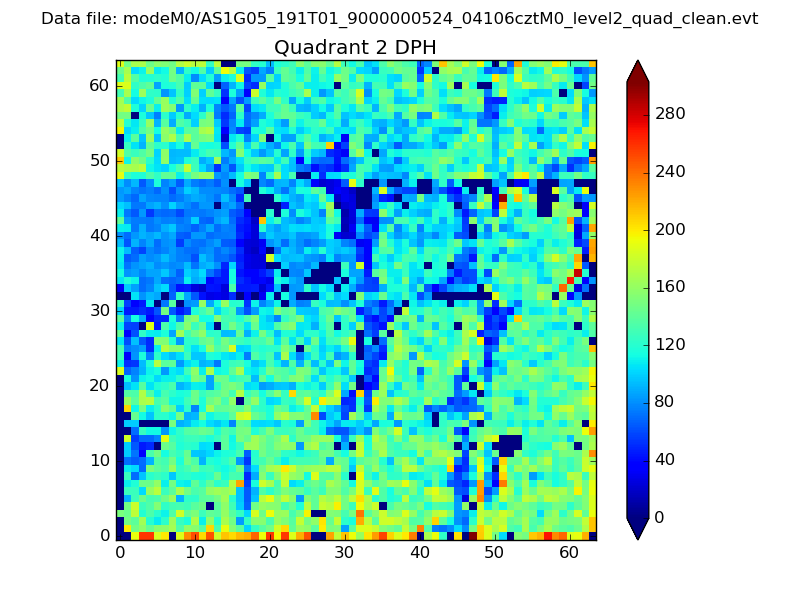
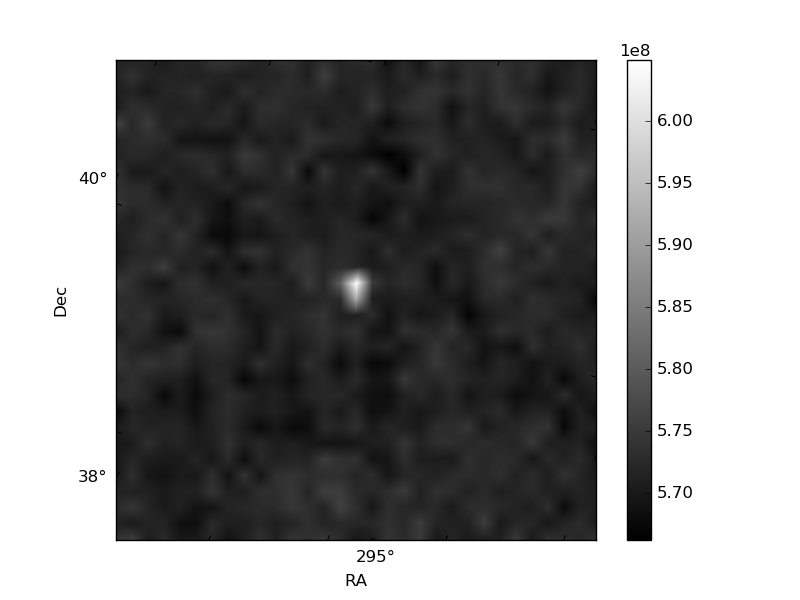
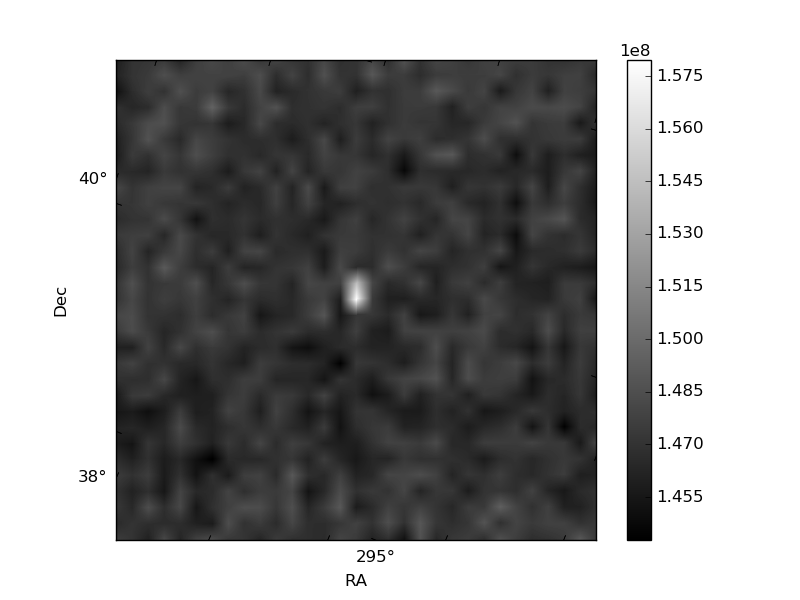
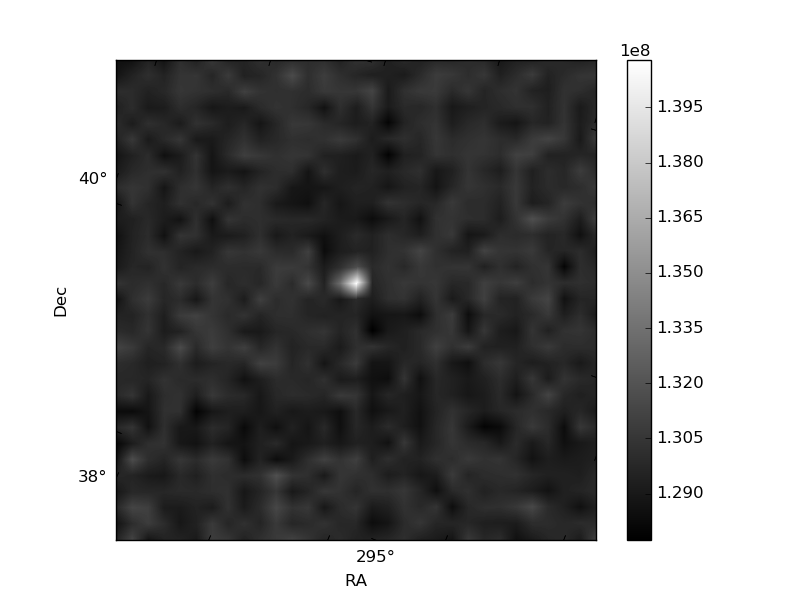
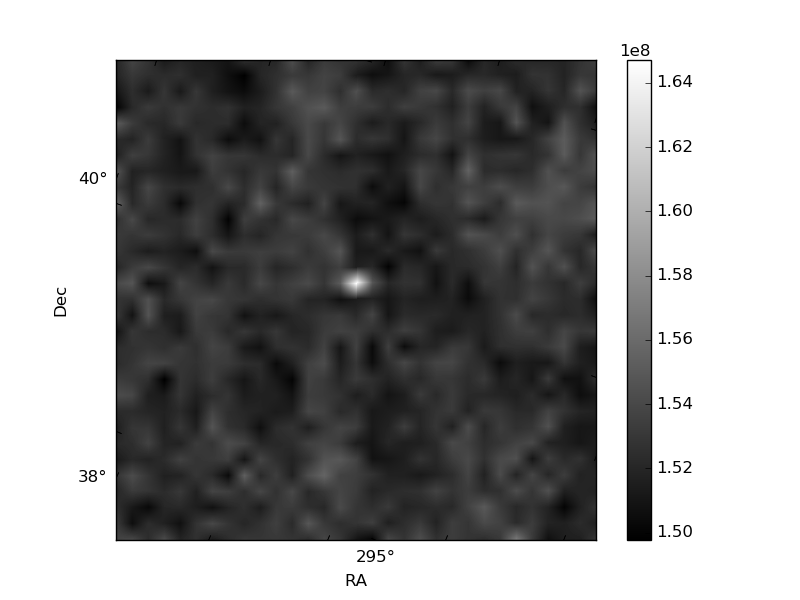
Histogram calculated using DETX and DETY for each event in the final _common_clean file
| Quadrant A | 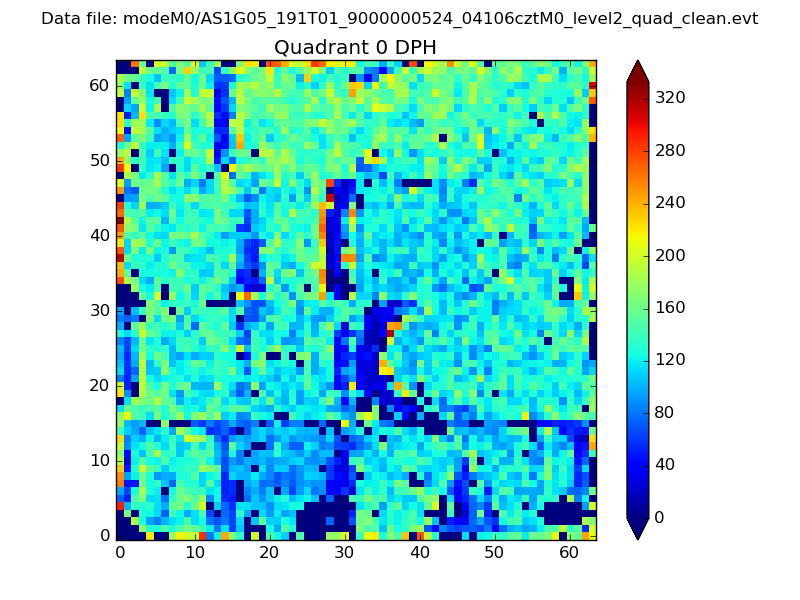 |
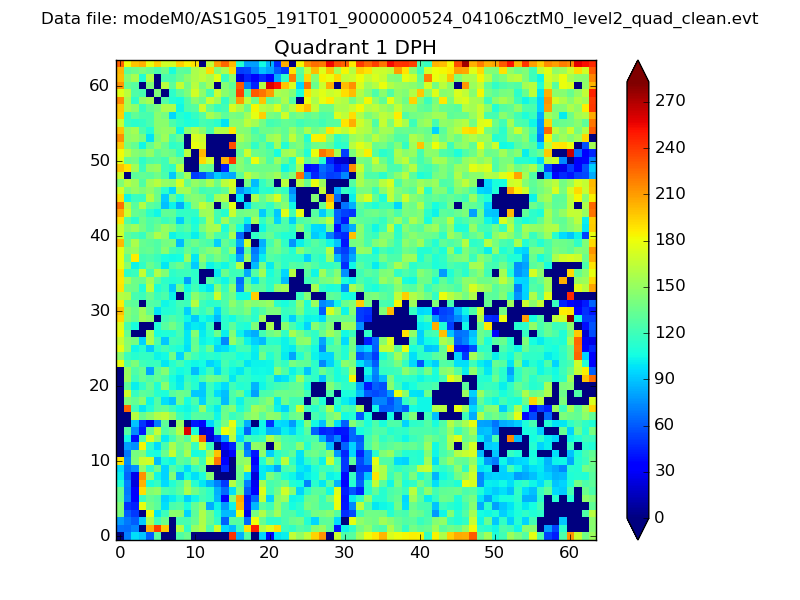 |
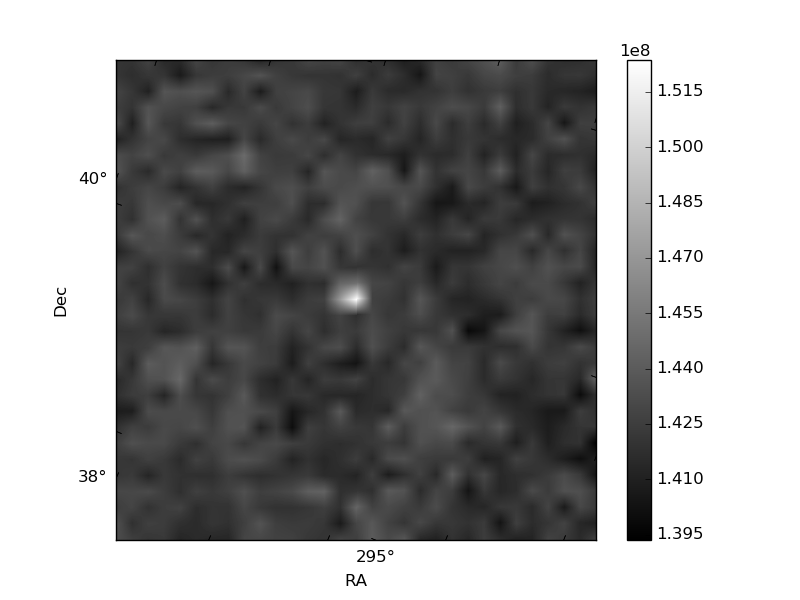
Quadrant B |
|---|---|---|---|
| Quadrant D | 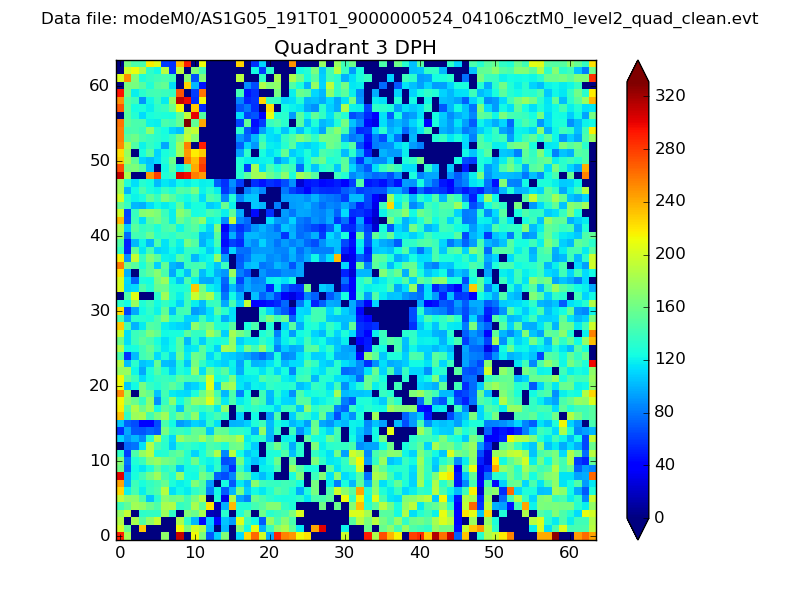 |
 |
Quadrant C |
| Plot type | Count rate plots | Images |
|---|---|---|
| Comparison with Poisson distribution Blue bars denote a histogram of data divided into 1 sec bins. Red curve is a Poisson curve with rate = median count rate of data. |
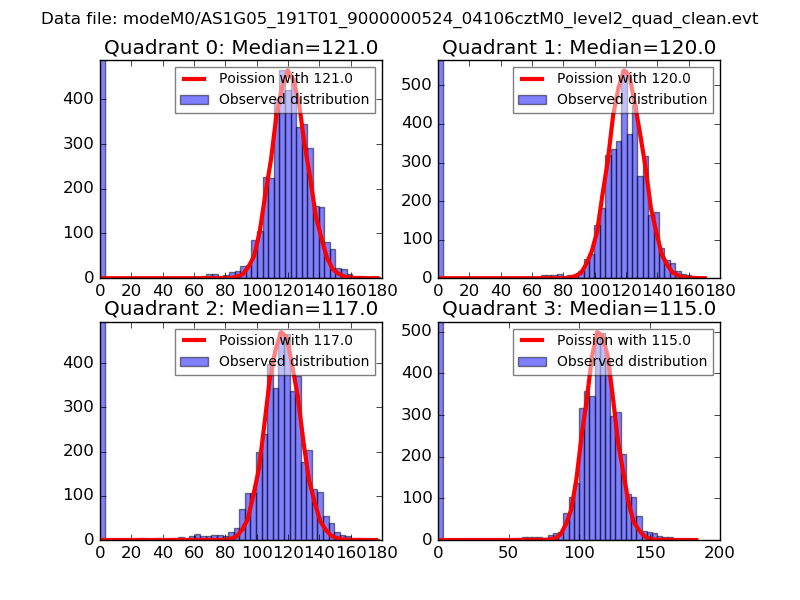 |
 |
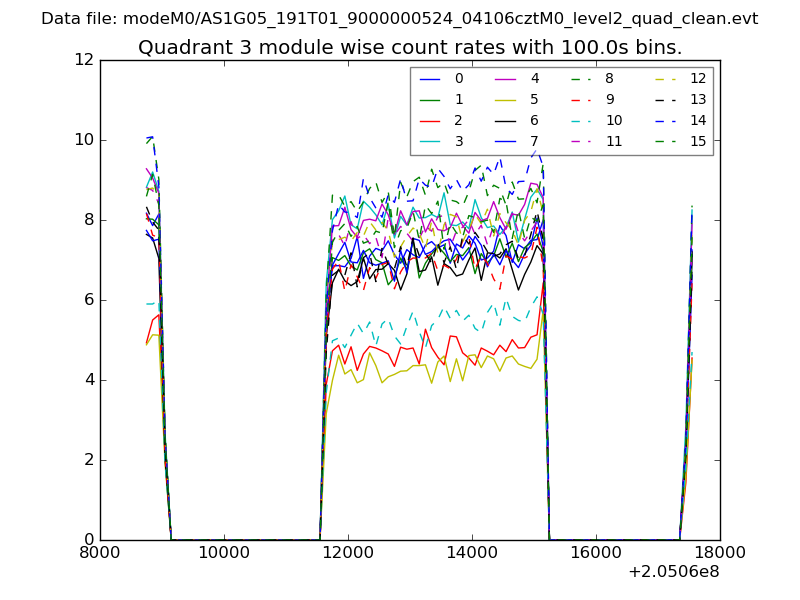
| Quadrant-wise count rates Data is divided into 100 sec bins |
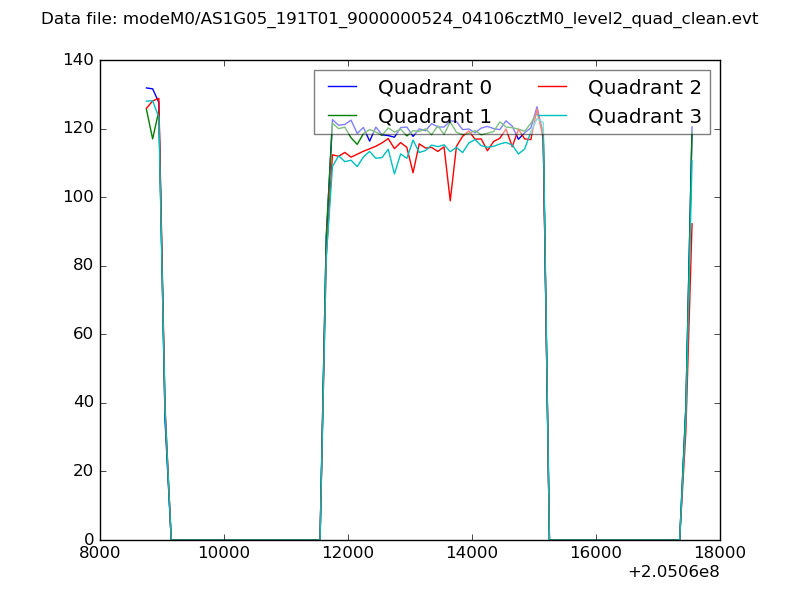 |
|
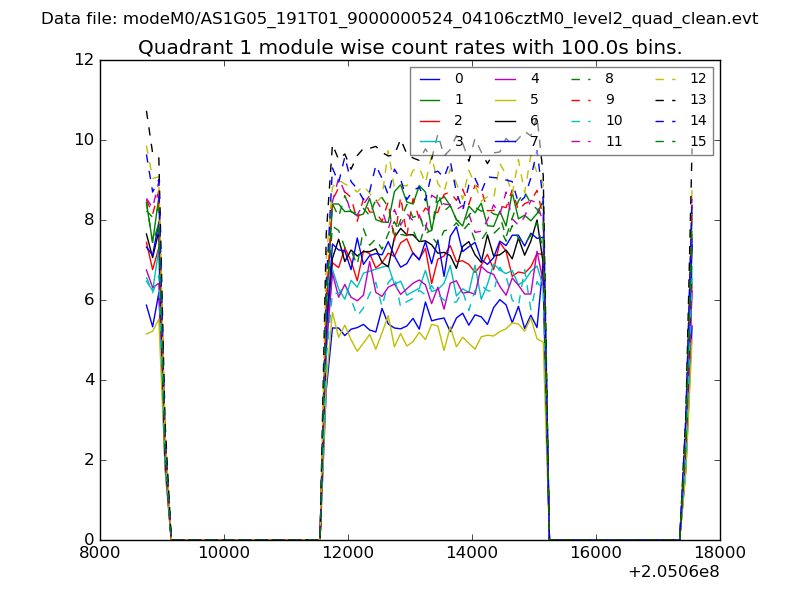
| Module-wise count rates for Quadrant A Data is divided into 100 sec bins |
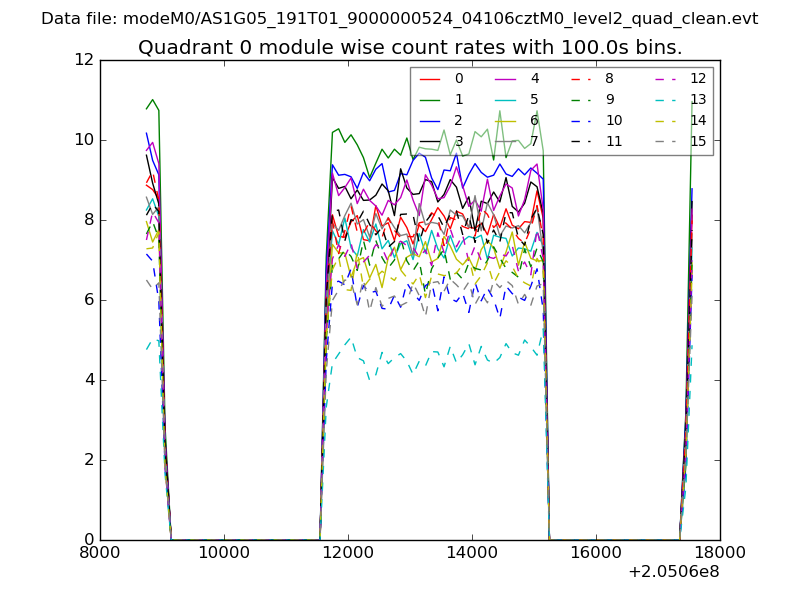 |
 |
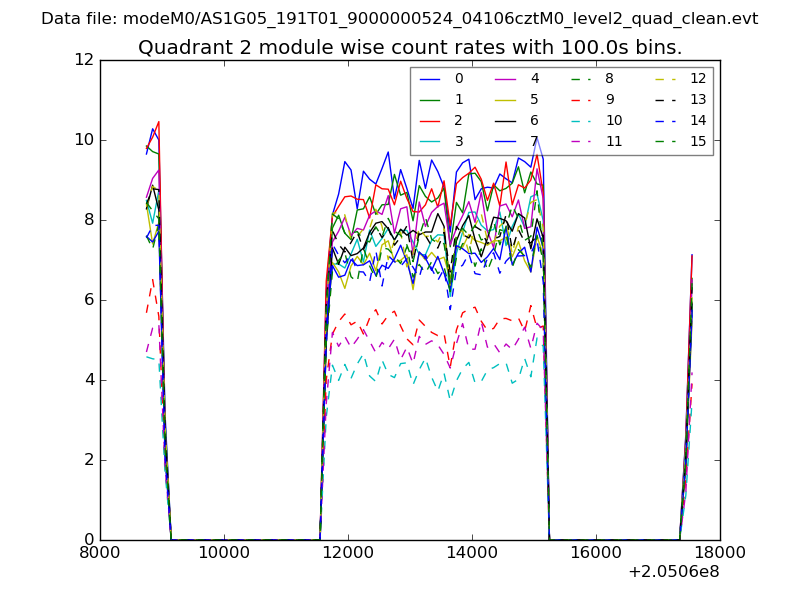
| Module-wise count rates for Quadrant B Data is divided into 100 sec bins |
 |
 |
| Module-wise count rates for Quadrant C Data is divided into 100 sec bins |
 |
 |
| Module-wise count rates for Quadrant D Data is divided into 100 sec bins |
 |
 |
| Parameter | Plot |
|---|---|
| CZT HV Monitor | 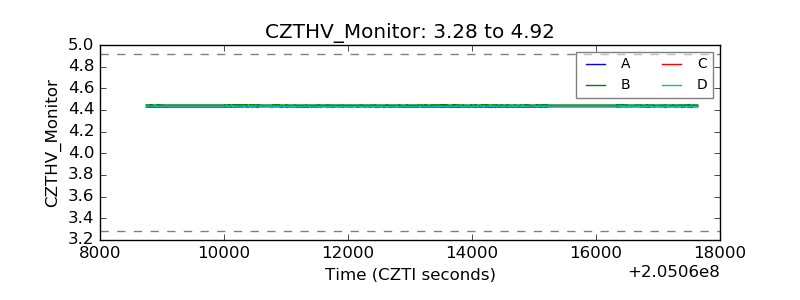 |
| D_VDD | 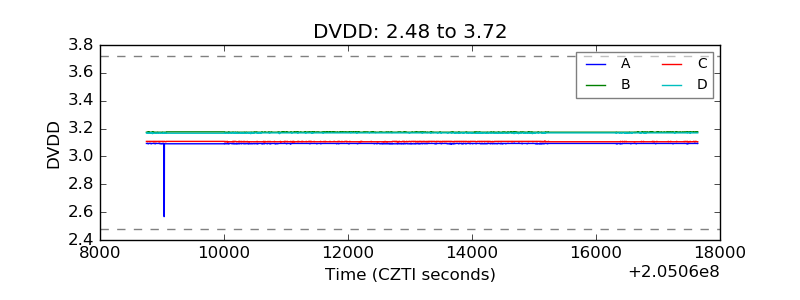 |
| Temperature 1 | 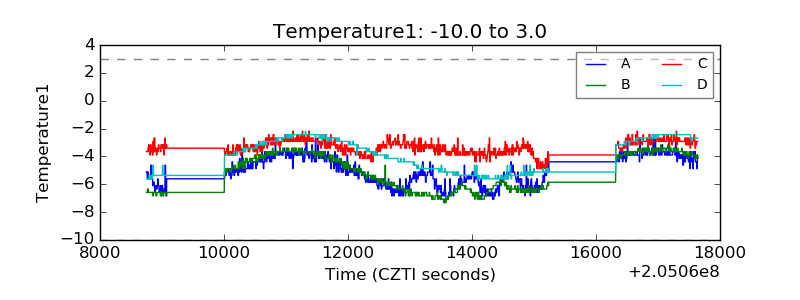 |
| Veto HV Monitor | 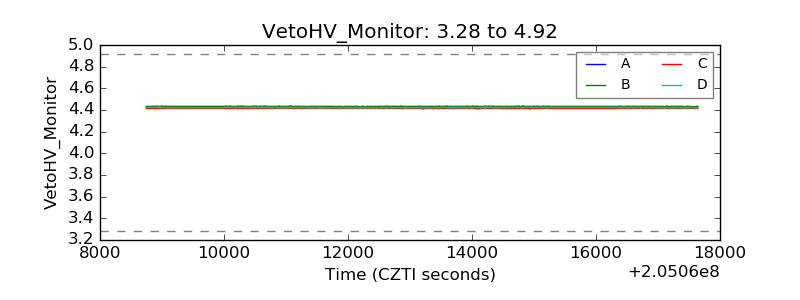 |
| Veto LLD | 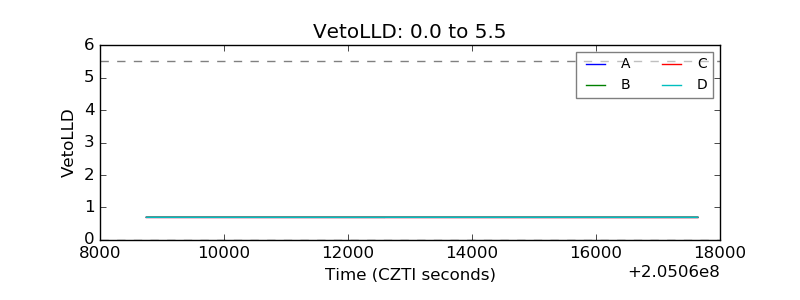 |
| Alpha Counter | 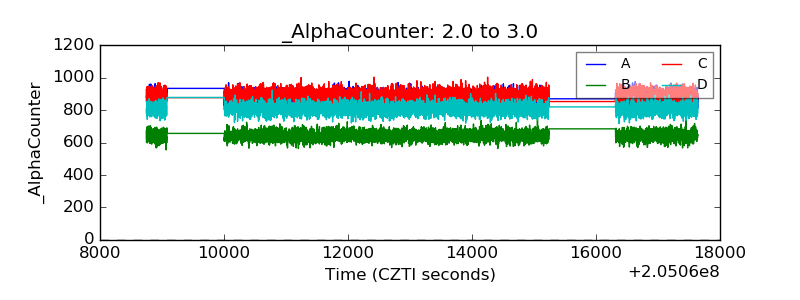 |
| _CPM_Rate | 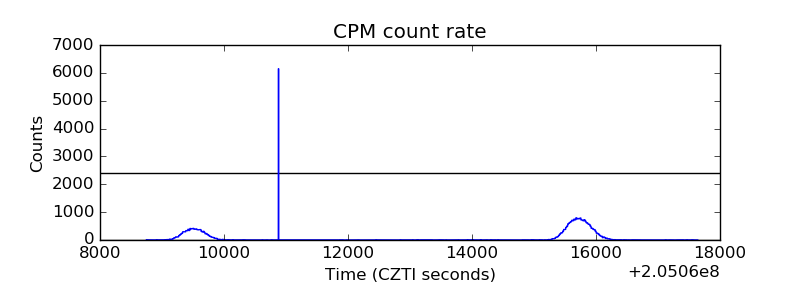 |
| CZT Counter | 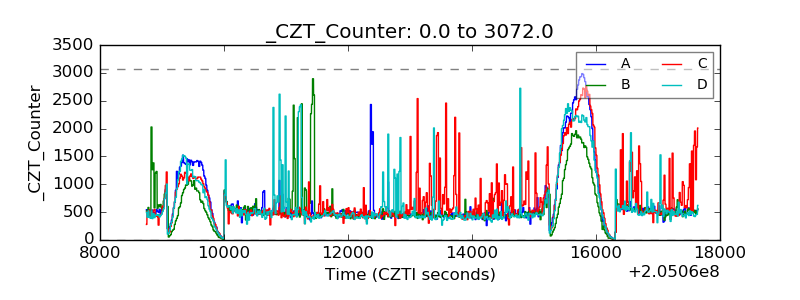 |
| +2.5 Volts monitor |  |
| +5 Volts monitor |  |
| _ROLL_ROT | 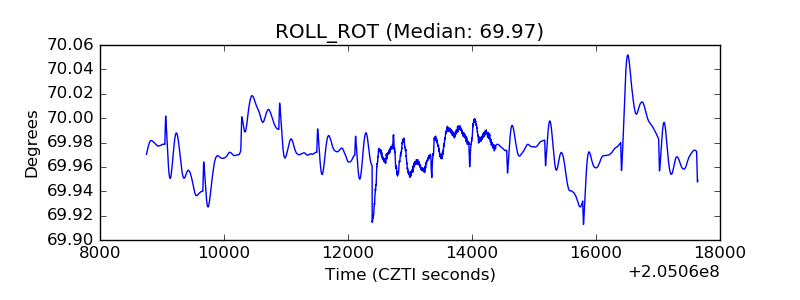 |
| _Roll_DEC | 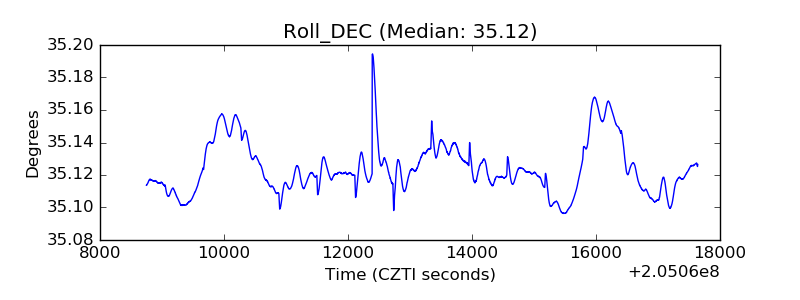 |
| _Roll_RA | 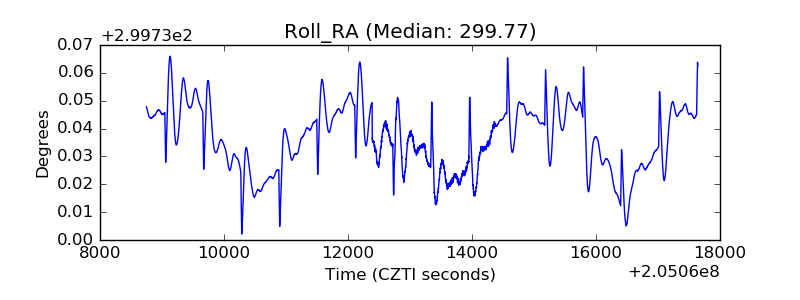 |
| Veto Counter | 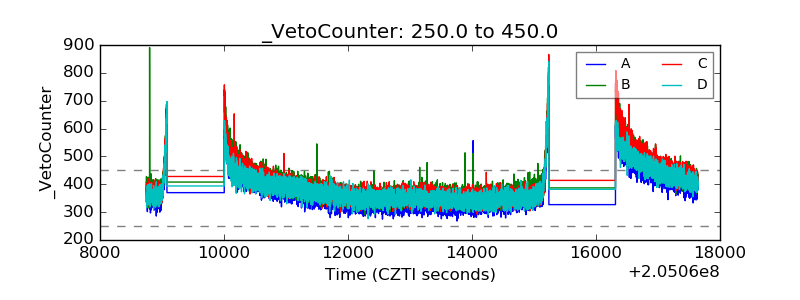 |