| Param | Original file | Final file |
|---|---|---|
| Filename | modeM0/AS1G05_191T01_9000000524_04108cztM0_level2.evt | modeM0/AS1G05_191T01_9000000524_04108cztM0_level2_quad_clean.evt |
| Size (bytes) | 492,963,840 | 81,380,160 |
| Size | 470.1 MB | 77.6 MB |
| Events in quadrant A | 3,314,597 | 517,205 |
| Events in quadrant B | 3,562,392 | 512,055 |
| Events in quadrant C | 4,467,136 | 497,951 |
| Events in quadrant D | 3,152,828 | 492,434 |
| Mode M0 | |||
|---|---|---|---|
| Quadrant | BADHDUFLAG | Total packets | Discarded packets |
| A | 0 | 13785 | 3 |
| B | 0 | 14600 | 2 |
| C | 0 | 17446 | 2 |
| D | 0 | 13574 | 2 |
| Mode M9 | |||
|---|---|---|---|
| Quadrant | BADHDUFLAG | Total packets | Discarded packets |
| A | 0 | 11 | 0 |
| B | 0 | 11 | 0 |
| C | 0 | 11 | 0 |
| D | 0 | 11 | 0 |
| Mode SS | |||
|---|---|---|---|
| Quadrant | BADHDUFLAG | Total packets | Discarded packets |
| A | 0 | 130 | 0 |
| B | 0 | 130 | 0 |
| C | 0 | 130 | 0 |
| D | 0 | 130 | 0 |
| Quadrant | Total seconds | Saturated seconds | Saturation percentage |
|---|---|---|---|
| A | 6369 | 109 | 1.711415% |
| B | 6369 | 158 | 2.480766% |
| C | 6369 | 306 | 4.804522% |
| D | 6369 | 74 | 1.161878% |
Noise dominated data is calculated using 1-second bins in cleaned event files. If a bin has >2000 counts, and if more than 50% of those come from <1% of pixels, then it is considered to be noise-dominated and hence unusable.
| Quadrant | # 1 sec bins | Bins with >0 counts | Bins with >2000 counts | High rate bins dominated by noise | Noise dominated (total time) | Noise dominated (detector-on time) | Marked lightcurve |
|---|---|---|---|---|---|---|---|
| A | 7504 | 6369 | 30 | 30 | 0.40% | 0.47% | 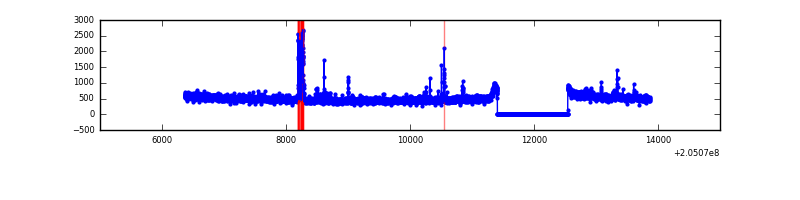 |
| B | 7504 | 6369 | 71 | 71 | 0.95% | 1.11% | 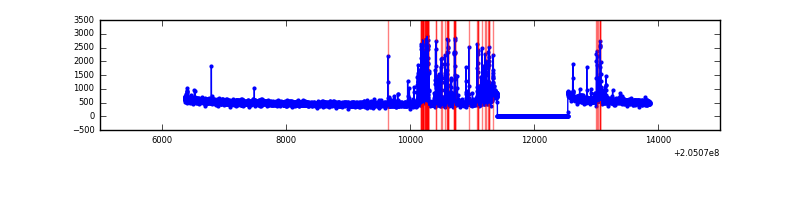 |
| C | 7504 | 6369 | 103 | 103 | 1.37% | 1.62% | 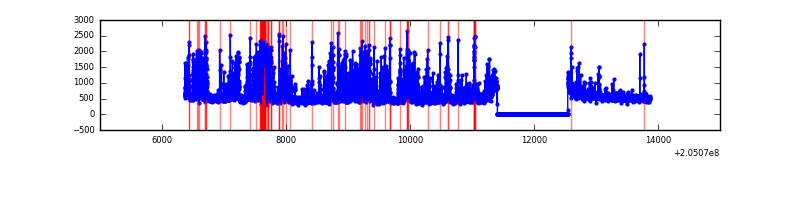 |
| D | 7504 | 6369 | 10 | 10 | 0.13% | 0.16% | 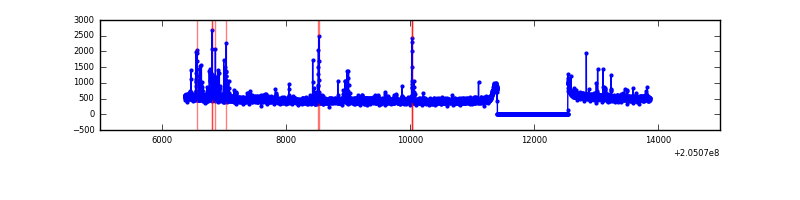 |
Top three noisy pixels from each quadrant. If the there are fewer than three noisy pixels in the level2.evt file, extra rows are filled as -1
| Pixel properties | Quadrant properties | ||||||
|---|---|---|---|---|---|---|---|
| Quadrant | DetID | PixID | Counts | Sigma | Mean | Median | Sigma |
| A | 0 | 50 | 155085 | 948.04 | 801 | 787 | 162.8 |
| A | 0 | 199 | 65160 | 395.52 | 801 | 787 | 162.8 |
| A | 0 | 226 | 13921 | 80.7 | 801 | 787 | 162.8 |
| B | 14 | 167 | 399361 | 2606.52 | 804 | 786 | 152.9 |
| B | 15 | 204 | 27953 | 177.66 | 804 | 786 | 152.9 |
| B | 0 | 183 | 16654 | 103.77 | 804 | 786 | 152.9 |
| C | 9 | 144 | 1449656 | 8089.85 | 773 | 780 | 179.1 |
| C | 13 | 61 | 6351 | 31.11 | 773 | 780 | 179.1 |
| C | 7 | 247 | 1868 | 6.07 | 773 | 780 | 179.1 |
| D | 10 | 172 | 71019 | 371.59 | 781 | 762 | 189.1 |
| D | 13 | 46 | 39622 | 205.53 | 781 | 762 | 189.1 |
| D | 13 | 239 | 33621 | 173.79 | 781 | 762 | 189.1 |
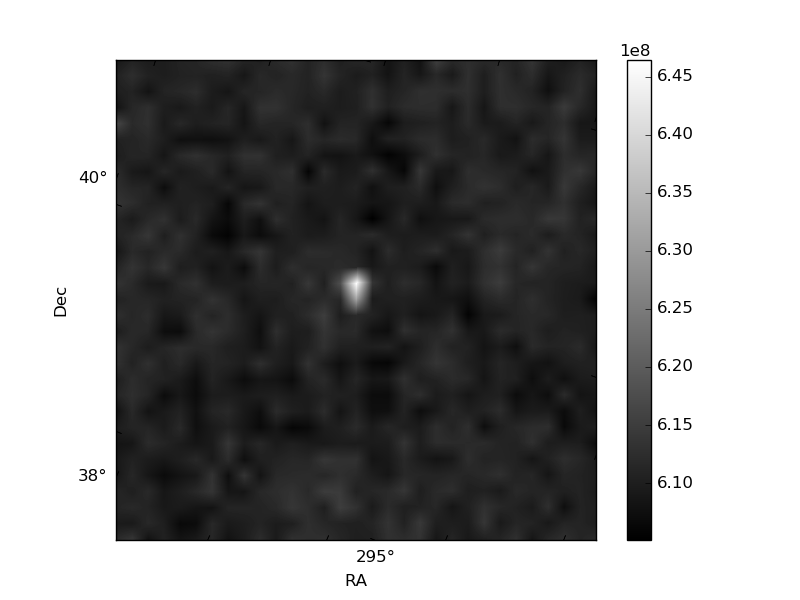
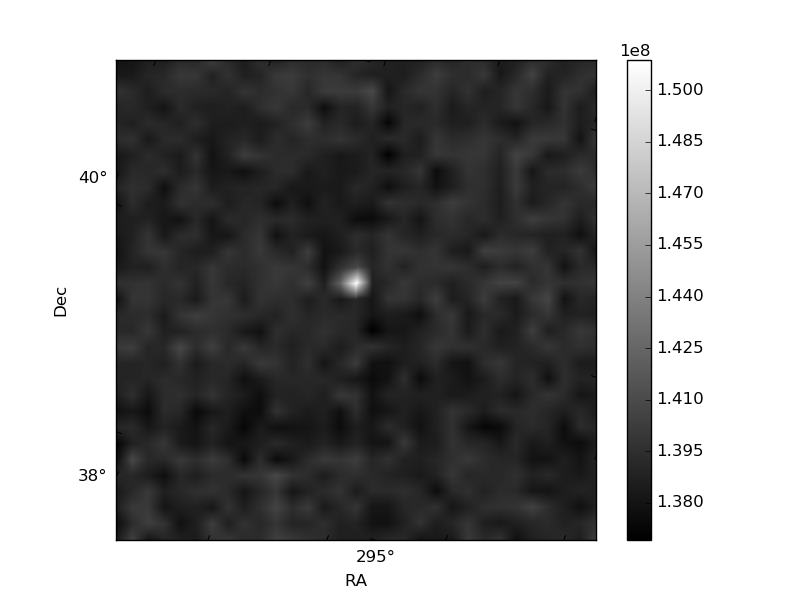
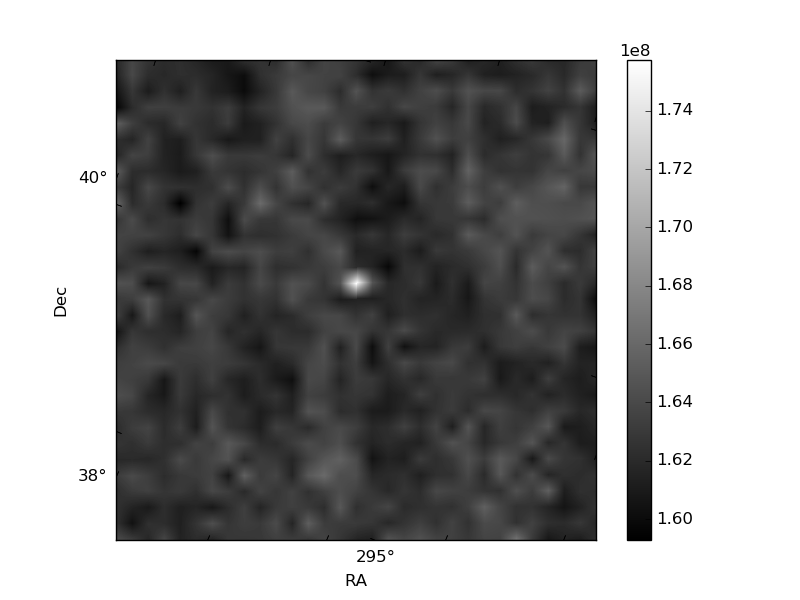
Histogram calculated using DETX and DETY for each event in the final _common_clean file
| Quadrant A | 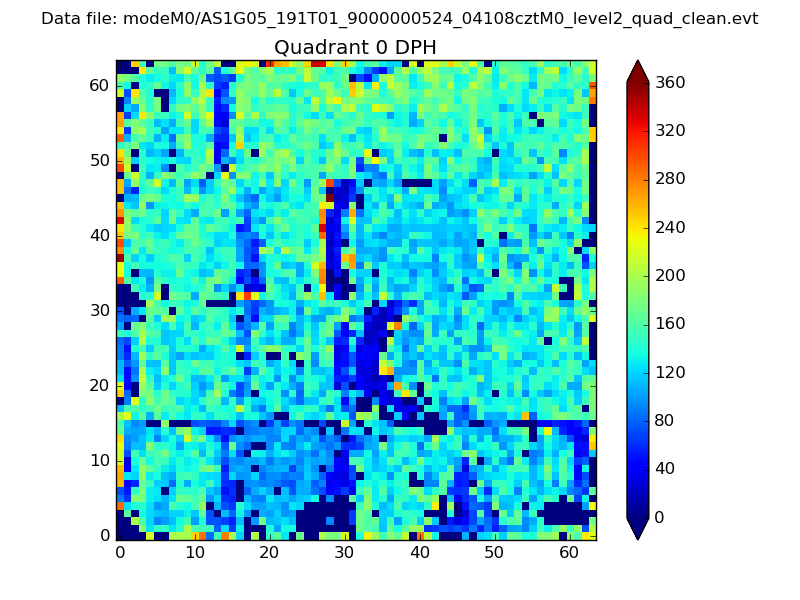 |
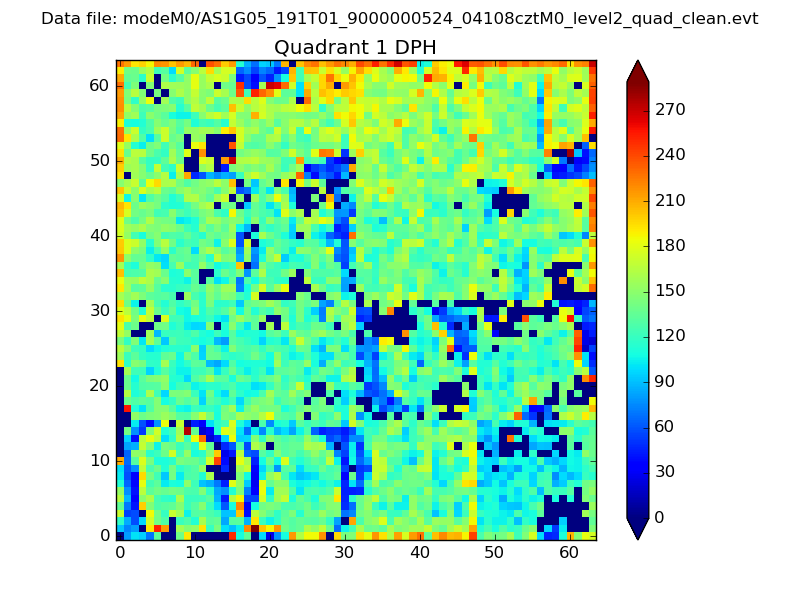 |
Quadrant B |
|---|---|---|---|
| Quadrant D | 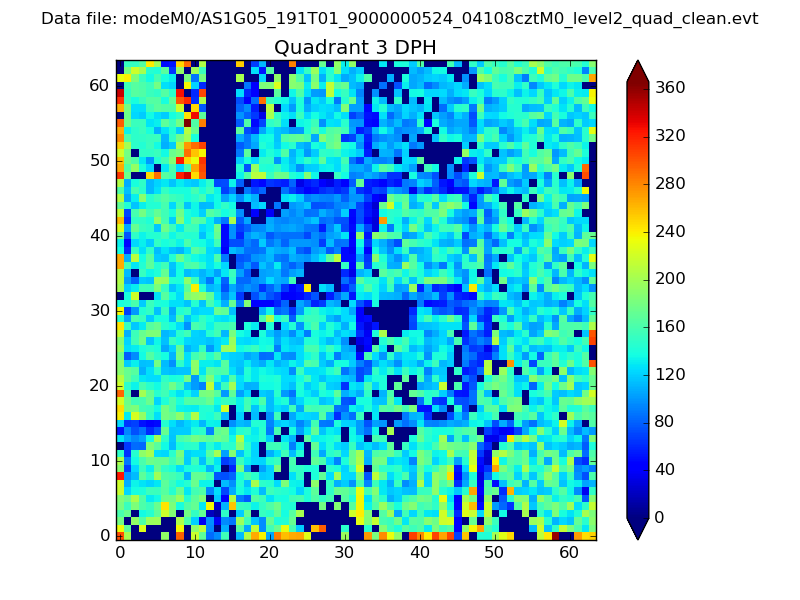 |
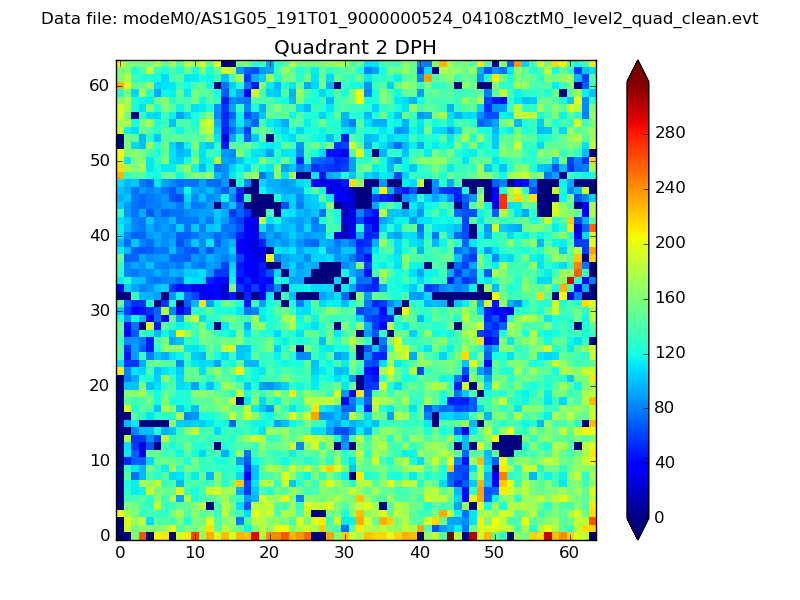 |
Quadrant C |
| Plot type | Count rate plots | Images |
|---|---|---|
| Comparison with Poisson distribution Blue bars denote a histogram of data divided into 1 sec bins. Red curve is a Poisson curve with rate = median count rate of data. |
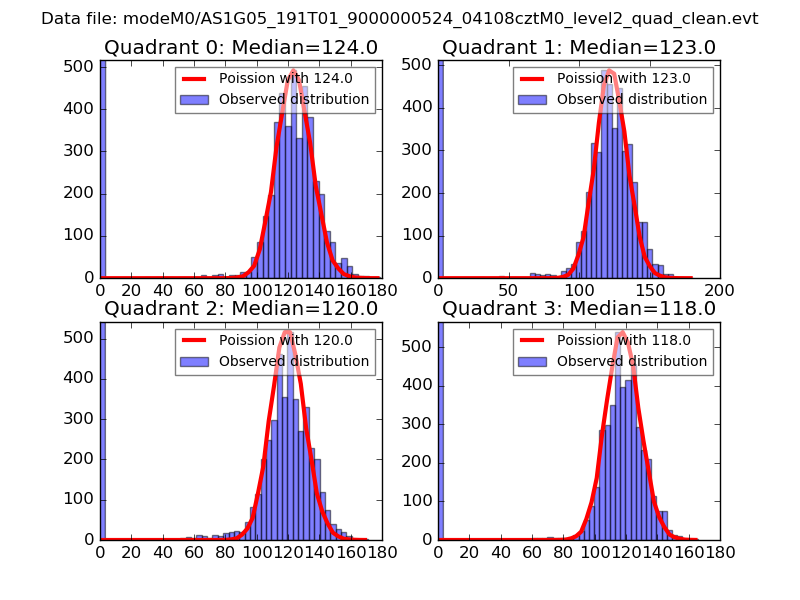 |
 |
| Quadrant-wise count rates Data is divided into 100 sec bins |
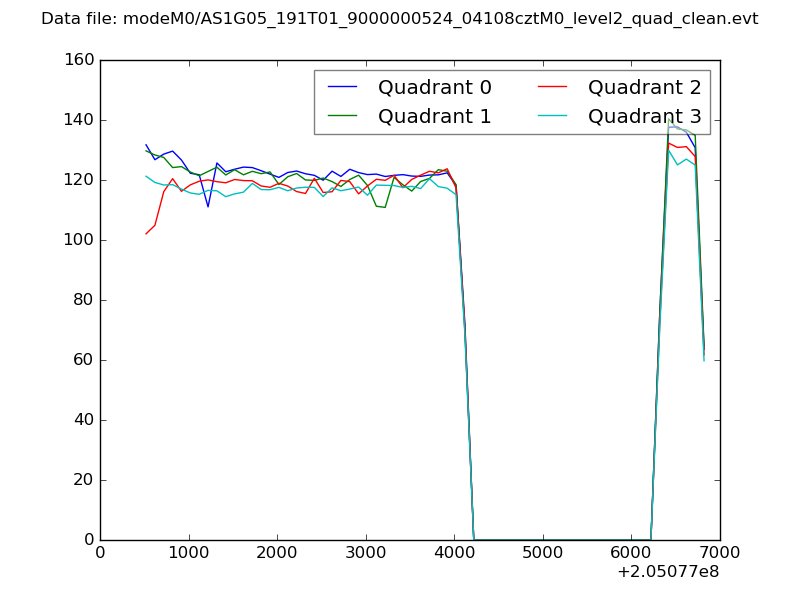 |
|
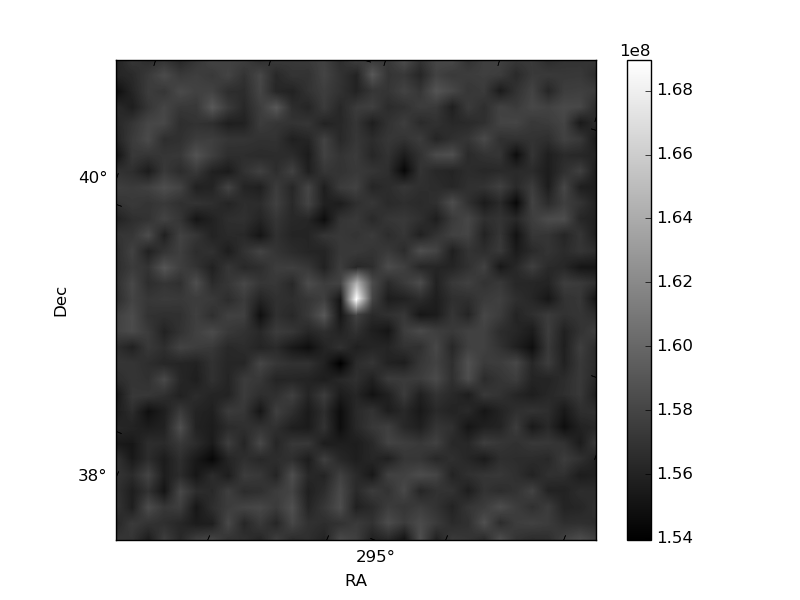
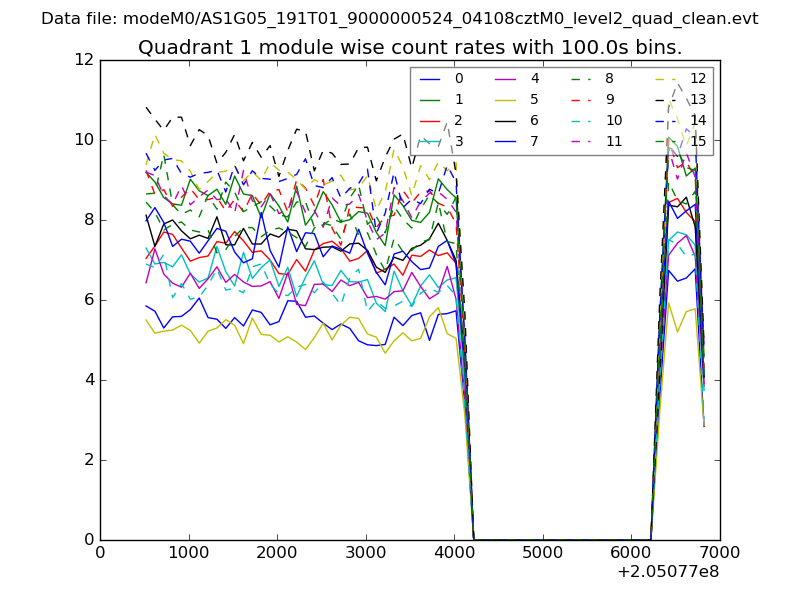
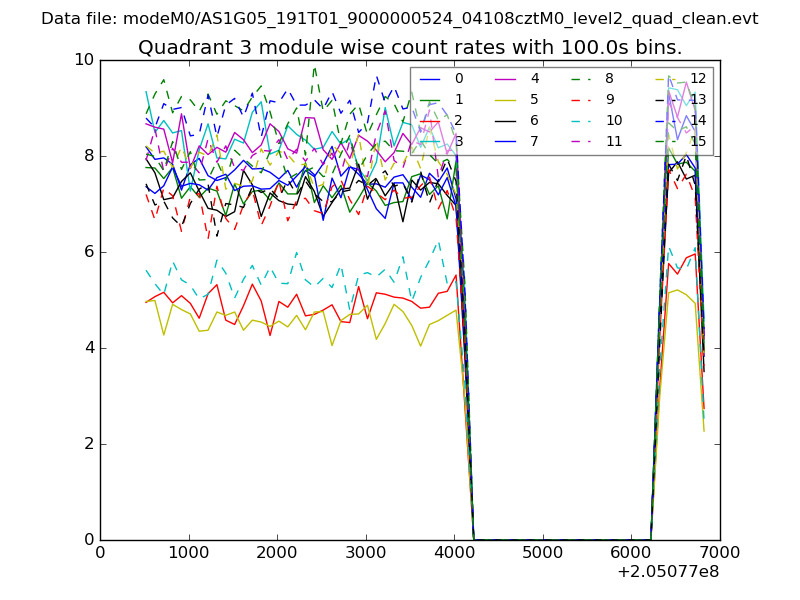
| Module-wise count rates for Quadrant A Data is divided into 100 sec bins |
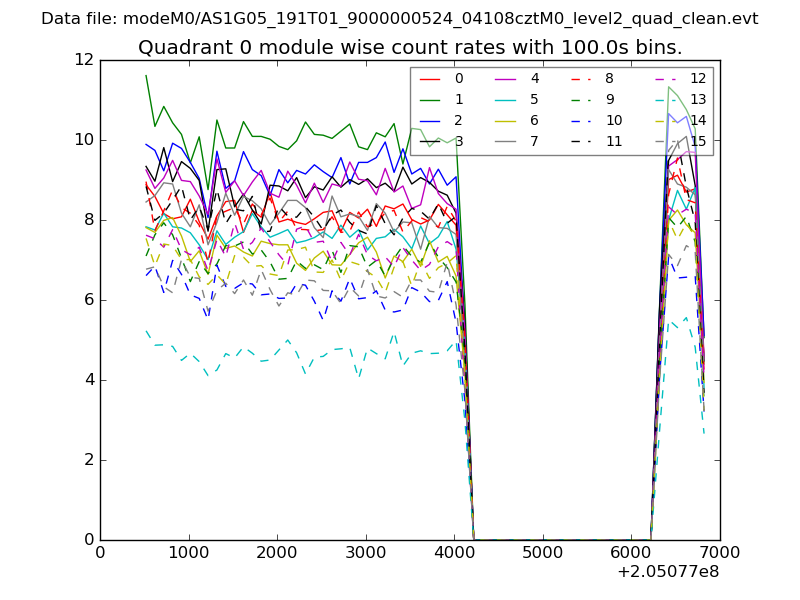 |
 |
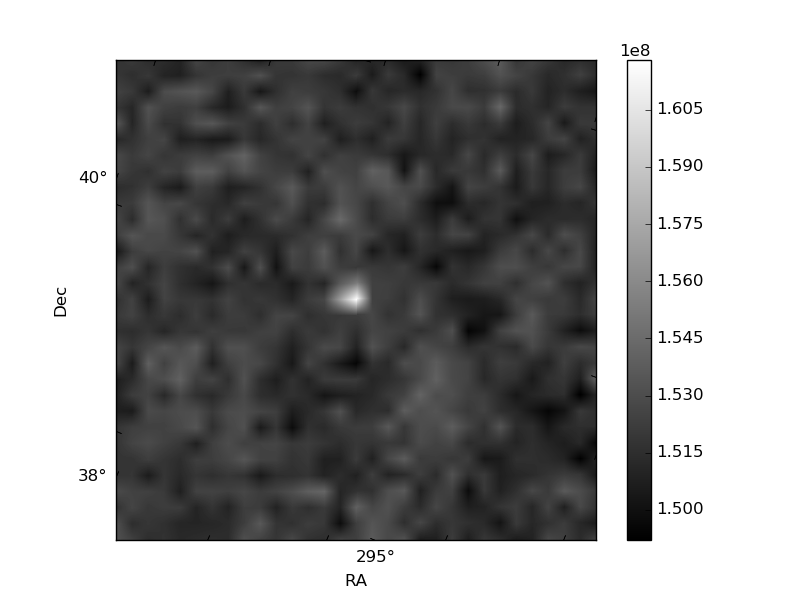
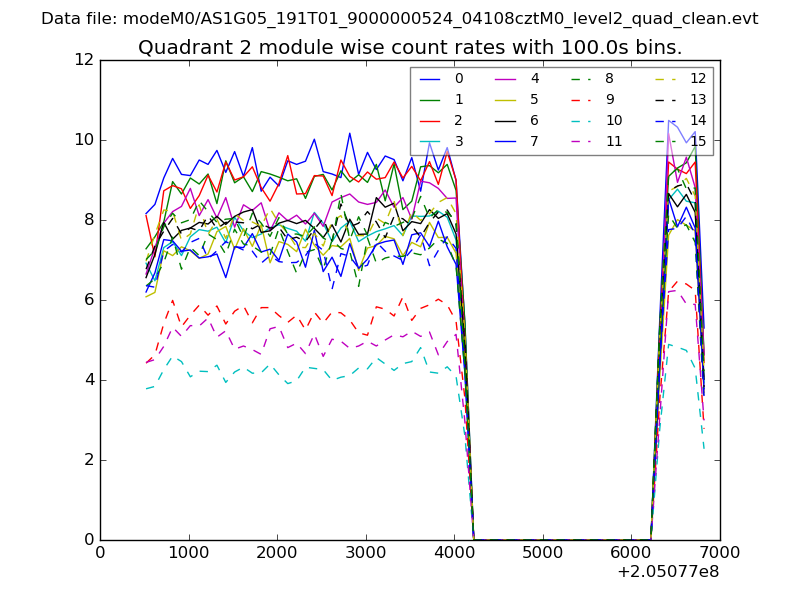
| Module-wise count rates for Quadrant B Data is divided into 100 sec bins |
 |
 |
| Module-wise count rates for Quadrant C Data is divided into 100 sec bins |
 |
 |
| Module-wise count rates for Quadrant D Data is divided into 100 sec bins |
 |
 |
| Parameter | Plot |
|---|---|
| CZT HV Monitor | 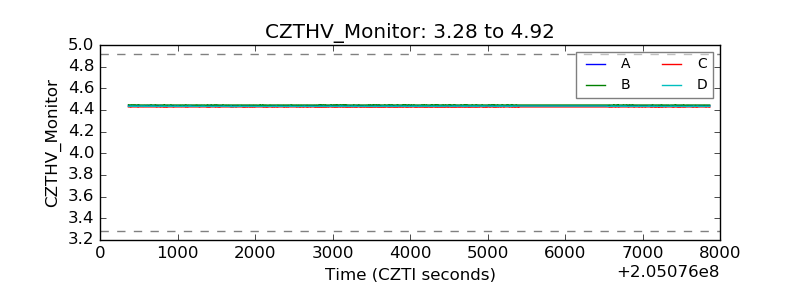 |
| D_VDD | 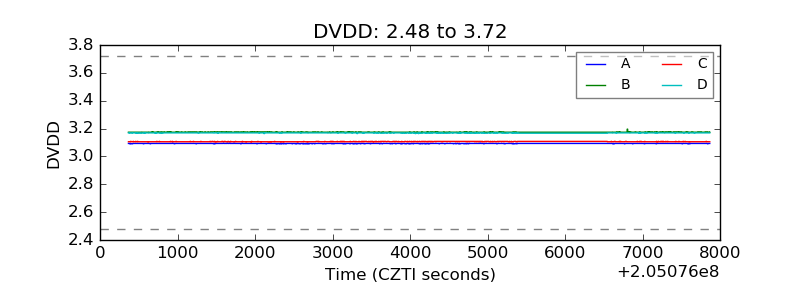 |
| Temperature 1 | 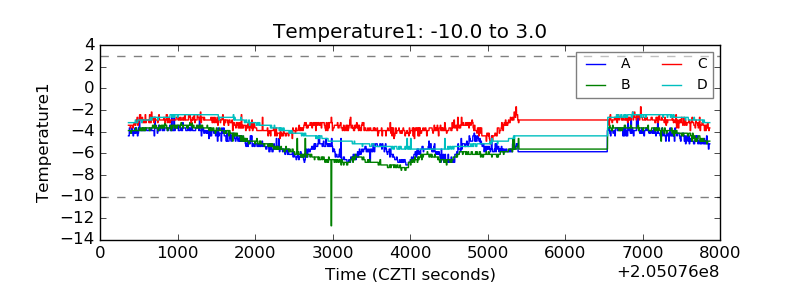 |
| Veto HV Monitor | 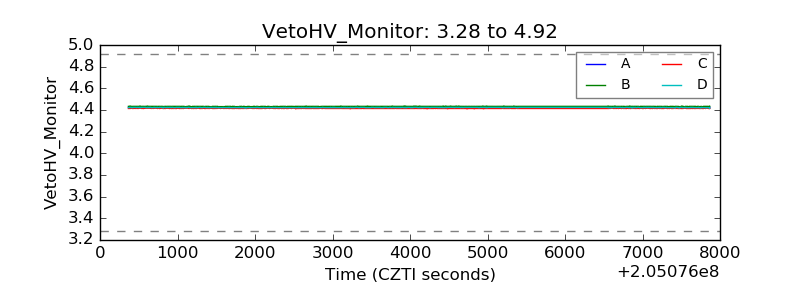 |
| Veto LLD | 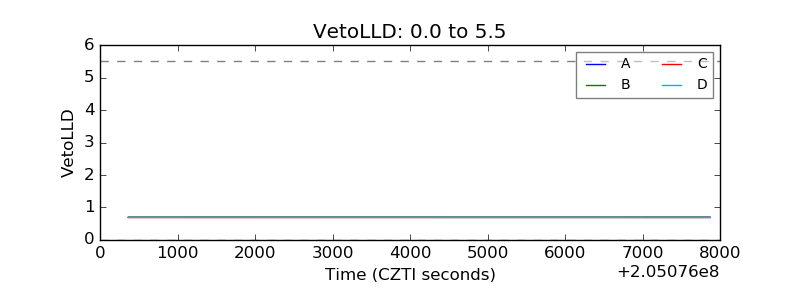 |
| Alpha Counter | 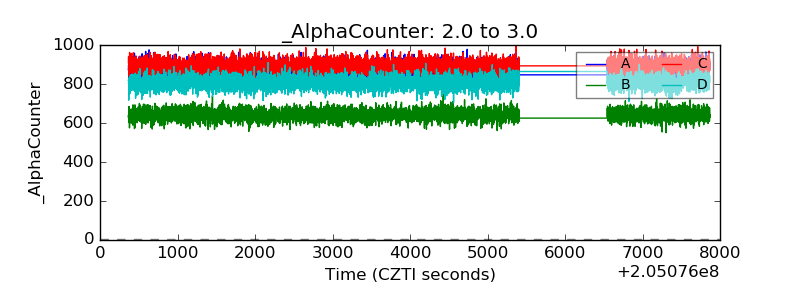 |
| _CPM_Rate | 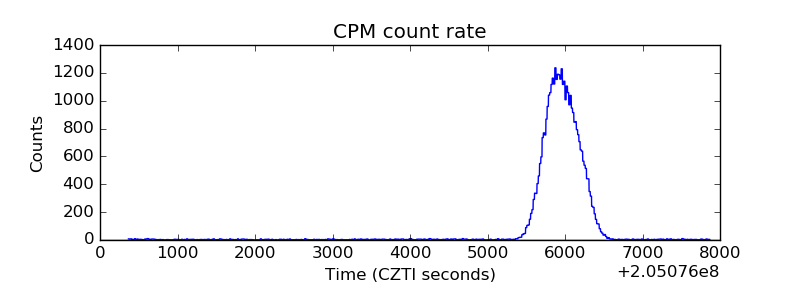 |
| CZT Counter | 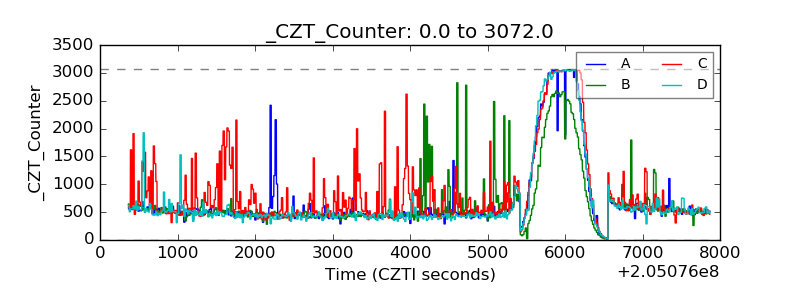 |
| +2.5 Volts monitor |  |
| +5 Volts monitor |  |
| _ROLL_ROT | 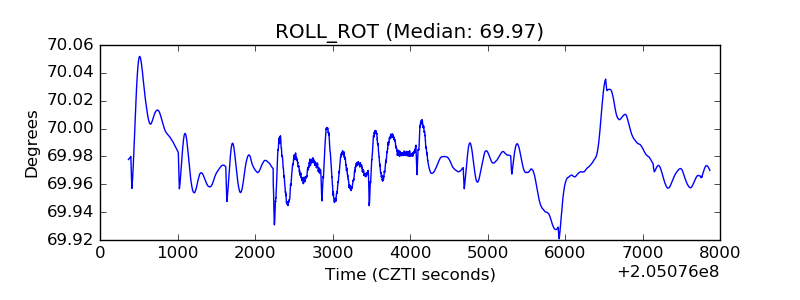 |
| _Roll_DEC | 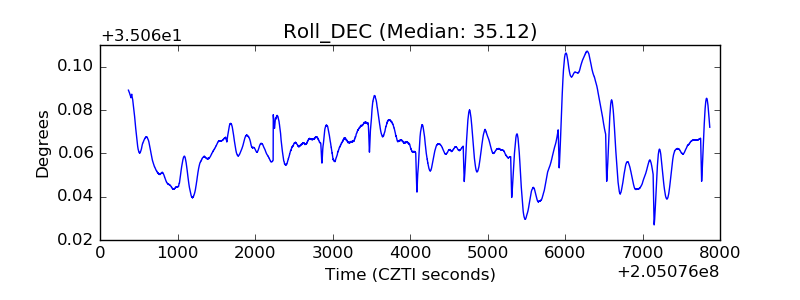 |
| _Roll_RA | 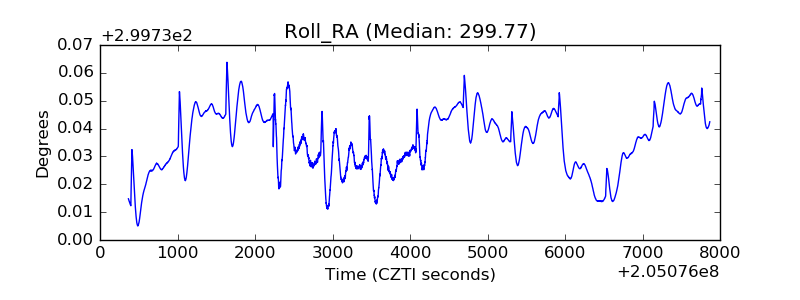 |
| Veto Counter | 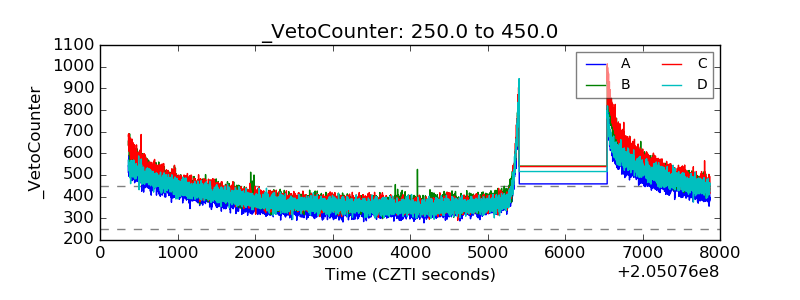 |